The manner in which a specific cost reacts to changes in the levels of activity can be described as ‘cost behavior’. It is possible that the cost may remain the same or may change in direct proportion to a change in the level of activity. Managerial decisions on creating a budget for a future period, preparing a sales/profitability forecast, determining the profitability levels of new products introduced, and selection of alternative products for continuing production can be greatly facilitated by studying the changes in the cost in relation to a change in the level of activity. This paper details an account of the cost behavior of Carnival Corporation Inc. a large multi-vessel cruise operator.
Estimation of Fixed and Variable Costs
For the purpose of estimating the fixed and variable element of the total costs the following figures are extracted from the Annual Report of Carnival Corporation for the year ended 30th November 2007.
Based on the Scatter diagram the fixed and variable costs can be determined as follows:
In a scatter diagram all elements of the cost will be plotted on a graph with the activity concerned on the horizontal axis and cost is represented in the vertical axis. A line is drawn connecting the points and an estimate is made for the total fixed costs at the point where the vertical axis is intersected at zero units of the activity. For the purpose of computing the variable cost per unit, the slope of the line is determined by selecting two points and dividing the change in their cost by the change in the unit of activity for the two points selected (Cliffs Notes).
In the case of Carnival Corporation with the available data the maximum and minimum points for the passenger cruise days (activity) can be selected as below:
Maximum: 54,132,927 days and the minimum is 47,754,627 days, leaving a difference of 6,378,300 days,
The change in the total cost is $ 10,012 million from $ 8,201 million. This leaves a difference in the cost of $ 1,811 million.
Thus dividing $ 1,811 by the change in the number of days of 6,378,330 days the variable cost per day can be calculated at $ 283.93.
Substituting the variable cost for the number of days in each year the total fixed and variable costs can be arrived at as below:
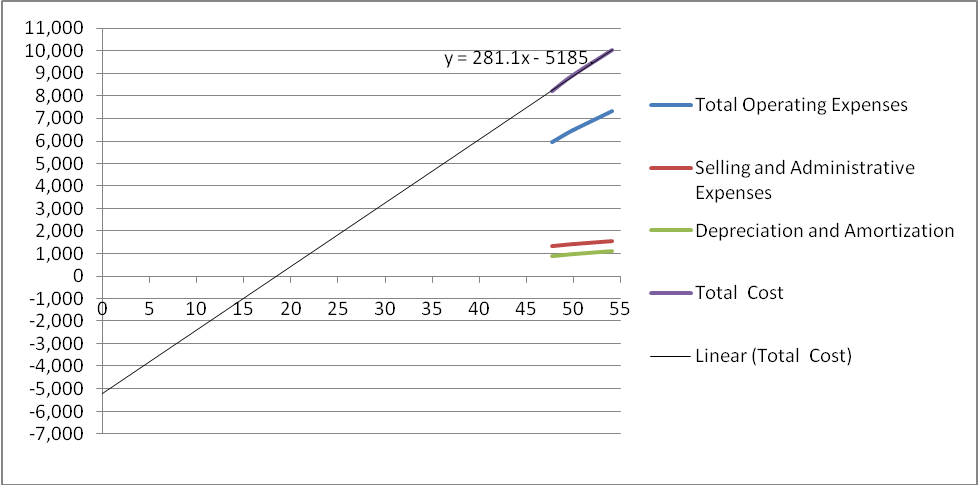
From the above table, it can be seen that the fixed costs can be estimated at around $ 5,200 million which is negative. This is represented by the following scatter diagram, from where the algebraic equation of Y = a + bX can be established, where Y represents total cost, X is the number of passengers cruised days, and ‘a’ is the fixed cost which is a negative figure. ‘b’ represents the variable cost per unit.
I do not have confidence in the estimation of negative fixed costs. Under normal circumstances, the average fixed costs decrease with every additional unit of activity. The logic behind this relationship can be explained by a simple statement of fact. Since fixed costs are supposed to be ‘fixed’ and are not expected to change with the volume of activity, a particular fixed cost is spread over to a very little extent with per unit increase of the activity. For example, if it is assumed that the fixed costs are $ 1000 and the average fixed cost would be $ 10 per unit when there is a production of 100 units. When the production is enhanced to 10,000 units then the average fixed costs per unit becomes just $ 0.10 cents. Thus the fixed costs are spread over the additional quantity of products made.
Average fixed costs when made as a component of the price, will be able to indicate whether the firm should continue the production in the short run. If the price is able to return at least the average fixed cost (arrived by dividing the total fixed cost by the quantity of output) it would be advisable for the firm to continue production in the short run. Although this would result in an economic loss, the losses in running the production would be less than shutting down the production. There are two basic concepts that go with the average fixed cost. They are:
The average fixed cost tends to be higher at a lower level of outputs and will be lesser with a relatively larger level of outputs. This is due to the reason that a given fixed cost is spread over a larger output.
Secondly, the average fixed costs always remain positive and never reach zero. It also never turns negative. The only possibility for the average fixed cost to become negative is only when the total fixed costs are turned negative “which makes neither theoretical nor practical sense” (AmosWEB).
Hence in the case of Carnival Corporation, the above estimation of negative fixed costs is totally unrealistic and hence can not be relied upon.
Variation of Total Costs with the Change in the Number of Passenger Cruise Days
The algebraic expression Y = a + bX represents the total cost broken down into the fixed and variable elements, where Y is the total cost; X is the number of passenger cruise days; ‘a’ is the fixed costs and ‘b’ represents the variable cost per unit as established by the estimation and exhibited in the scatter diagram. Substituting the values in the algebraic equation the following three equations can arrive for the three years:
- For 2007:
- Y = – 5185 + 281.1 (54,132,927) = – 5185 + 15216 = 10031 ……….. (1)
- For 2006:
- Y = – 5185 + 281.1 (49,945,184) = – 5185 + 14,040 = 8,855 ……….. (2)
- For 2005:
- Y = – 5185 + 281.1 (47,754,627) = – 5185 + 13,424 = 8,239 ……….. (3)
Note: There are slight variations as expressed in these equations against the actual total cost figures of $ 10012 (10031), 8,912 (8,855), and 8,201 (8,239) respectively.
It may be observed that the estimations though not holding to practicality still proves the expression Y = a + bX.
Increase in the Costs against Increase in the Number of Passenger Cruise Days
The following table represents the cost structure as per the estimation of the variable costs. Since the fixed costs are negative they are not taken into consideration.
The above position can be represented graphically as below:
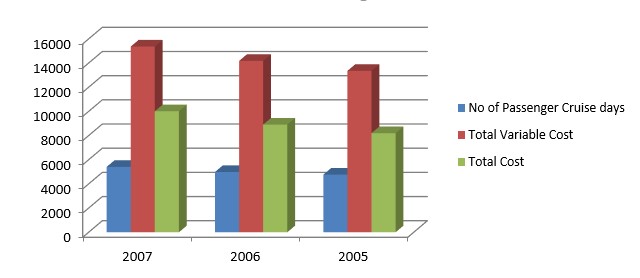
Although the linear relationship between the increase in the number of passenger cruise days and the increase in the total cost and the total variable cost could be observed from the above graph, it appears absurd to have the total variable costs much higher than the total cost because of the wrong estimation of the fixed costs and variable costs components. Hence it would be advisable to adopt the actual cost figures as shown in the annual report of the company. The following table incorporates these actual data.
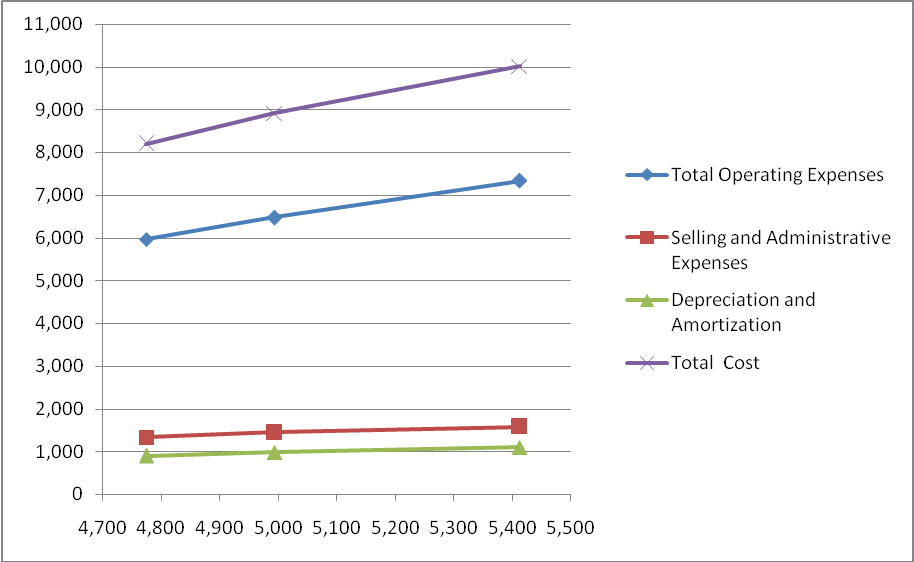
For a comprehensive understanding the above figures can be represented graphically as below: From the above graph, it can be seen that there is a definite correlation between the number of passenger cruise days and the operating expenses. With the increase in the number of passenger cruise days at 47,754,627 for the year 2005, the operating expenses remained at $ 5,964 million. When the passenger cruise days have increased to 54,132,927 in the year 2007the operating expenses have increased proportionately to reach the level of $ 7,332 million. A similar relationship can be observed in the case of selling and administrative expenses which have increased from $ 1335 million in 2005 to $ 1,579 in the year 2007. In consequence of the increase in both the operating costs and selling and administrative costs, the total costs have also increased in line with the increase in the number of passenger cruise days over the three years. There is a proportionate increase in the depreciation and amortization expense which indicates that the company has not made any changes in its fixed assets block by way of sale or addition to have a significant effect on this expense item.
Relationship between Costs, Sales Mix and the Break-even Volume
One of the most basic planning tools available to managers is the ‘Cost-volume-profit’ analysis. ‘Cost-volume-profit’9(CVP) analysis examines the behavior of total revenues, total costs, and operating income as changes occur in the output level, selling price, variable cost per unit, or fixed costs. CVP analysis is most commonly used by the managers as a help to answer such questions as to the effect of the additional sale of 1000 units on the revenue and the cost; the effect on the earnings of the company if the selling price is raised or reduced. By examining the various possibilities and alternatives CVP analysis illustrates various decision outcomes and thus serves as an invaluable aid in the planning process (Horngren et al, 2002). Cost-volume-profit analysis is based on several assumptions. Some of the assumptions are:
- Changes in the level of revenues and costs arise only because of changes in the number of products or service units produced and sold.
- Total costs can be divided into a fixed component and a component that is variable with respect to the level of output.
- When graphed the behavior of total revenues and total costs are linear in relation to output units within the relevant time period.
- The unit selling price, unit variable costs, and fixed costs are known and constant.
- The analysis either covers a single product or assumes that the sales mix when multiple products are sold will remain constant as the level of total units sold changes.
- All revenues and costs can be added and compared without taking into the time value of money.
Most of these assumptions can very well fit into the cost structure of Carnival Corporation and hence the cost-volume-profit analysis can be adapted to the cruise business of the firm. The company is able to differentiate the variable costs by clearly establishing the relationship of some of the expenses to the number of passenger cruise days. For instance, the costs of passenger cruise bookings which represent costs vary directly with the passenger cruise ticket revenues and include travel agent commissions, air, and other travel-related costs. Other variable expenses include fuel costs, food costs and payroll, and related costs representing the costs for all the shipboard personnel including deck and engine officers and crew and hotel and administrative employees.
In addition, the variability of the onboard and other cruise costs s which represent costs of liquor and beverages and other similar expenses can be easily determined as they are related to the onboard and other revenues. In fact, for disclosing some of the selected information and non-GAPP financial measures the company has adopted the operating expenses, and the selling and administrative expenses have been taken to arrive at the ‘gross cruise cost’ and ‘net cruise cost’. These factors go to prove that the variability of the expenses of the company can easily be determined to make use of the CVP analysis. Moreover, this paper also identified that there is a close correlation between the increase in the number of passenger cruise days and the increase in the variable and total cost and to some extent with the fixed costs also.
Contribution Margin, Breakeven Point, and Sensitivity Analysis
It should be noted that normally the only numbers that change with the change from selling different quantities of packages are total revenues and total variable costs. The difference between the total revenues and the total variable costs is called the ‘Contribution Margin’. Contribution margin is an effective summary of the reasons that operating income changes as the number of units sold changes. The contribution margin per unit is derived by subtracting the variable cost per unit from the selling price of the unit. The contribution margin is a key concept in the CVP analysis. It represents the amount of revenue minus variable costs that contribute to recovering fixed costs. Once the fixed costs are fully recovered the contribution margin contributes to the operating income. Instead of expressing the contribution margin as a per-unit amount it can be expressed as a percentage. The contribution margin percentage is arrived at by dividing the contribution margin per unit by the selling price. Another important element in the CVP analysis is the ‘breakeven point’. The ‘breakeven point is the quantity of output where total revenues equal total costs meaning where the operating income is zero.
The breakeven point becomes interesting since the managers by establishing the breakeven point would be able to determine the point of sales volume at which they can avoid operating losses. In other words, the breakeven point tells the managers the level of sales volume they need to avoid operating loss. ‘Sensitivity Analysis’ is also an important tool which the managers use to select among available alternatives is. Sensitivity analysis is a technique that managers can use to examine how a result will change if the original predicted data is not achieved or there are changes in the underlying assumptions. In the context of CVP analysis, the sensitivity analysis will be able to answer questions like what would be the effect on the operating income if units sold are decreased by 5 percent from the original prediction of sales volume. Similarly, the sensitivity analysis can also find an answer for the question as to the effect of a change in the variable expenses by 10 percent upwards on the operating income. The sensitivity of operating income to various possibilities broadens the perspectives of the managers as to what might actually occur before they make their cost commitments (Horngren et al, 2002).
The cost structure of Carnival Corporation is such that it would be possible for the managers to apply the Cost-volume-profit analysis to make decisions on the number of cruises to be undertaken for meeting the breakeven point. Actually, since the operating and selling and distribution costs can be expressed as unit cost per passenger cruise day, it is easier for the managers to determine the level of revenue they have to achieve the break-even point with respect to a particular voyage or particular ship. Alternatively, the number of passenger cruise days can be made use of as the base for the total breakeven point for any period. The total cost and revenue can be estimated per passenger cruise day basis to determine the optimum number of passenger cruise days so that the operating income level can be enhanced. However, for this purpose, it is important that the company determines the fixed costs more or less accurately so that the contribution margin level can be determined and planning of the level of operating the cruises can be monitored. Sensitivity analysis is another useful tool for Carnival must always have backup plans worked in anticipation of cancellation of bookings or escalation of costs. There are a number of factors that may cause the actual results of the company to differ materially from those expected including fuel costs, economic conditions, weather, regulatory conditions, geopolitical factors, and other factors that could impact consumer demand or costs (Carnival Corporation). Hence under these circumstances, the sensitivity analysis may be of great help to the managers of Carnival.
Sales Mix
Sales mix is the relative combination of quantities of products or services that constitute total unit sales. If the mix changes the overall unit sales target may still be achieved. However, the effect on operating income depends on how the original proportions of lower or higher contribution margin products have shifted. In general other things being equal for any given total quantity of units sold if there is a shift in the sales mix towards units with higher contribution margins operating income will be higher (Horngren et al, 2002). Since the cruise industry though experienced growth in general, the product offerings and customer segments had to undergo frequent changes due to the impact of the weaker US economy, which had an increasing impact on the consumers’ discretionary income. This and other factors like increased fuel costs and increase in US interest rates also resulted in the changes in the marketing strategies of Carnival by focusing more on non-Caribbean product offerings. The sales mix in the case of Carnival would include increasing the proportion of higher net revenue per passenger cruise day cruises in the total planned number of cruises over a specific period. The number of days of the cruise and the geographical destination and the customer demand are some of the factors that need considering while deciding the sales mix.
References
- AmosWEB ‘Average Fixed Cost’. Web. Carnival Corporation. Web.
- Cliffs Notes ‘Cost Behavior’. Web.
- Horngren T. Charles, Foster George, Datar M. Srikant. 2002 ‘Cost Accounting A Managerial Emphasis’ Edition X Prentice Hall India Private Limited New Delhi.
Footnotes
The passenger Cruise Days is denoted by the term ‘Available Lower Berth Days (ABLD) and “ALBDs is a the standard measure of passenger capacity for the period. It assumes that each cabin we offer for sale accommodates two passengers. ALBDs are computed by multiplying passenger capacity by revenue-producing ship operating days in the period”.