Introduction
Model ship towing tests are physical simulations used to evaluate the aerodynamic properties of this process. In real-world towing, the ship is pulled by another vessel, usually an easier vessel to maneuver and gain velocity (Boat US, n.d.). During this process, the aerodynamic performance of towing is of heightened importance because its use in design ultimately determines the success of the ship’s towing. This laboratory work aims to conduct a test with the Sylender model ship to collect information about its movement on the water and further analyze this data. The immediate mathematical analysis involved procedures such as differentiating and integrating velocity functions to find acceleration and path, respectively. By substituting time values into the functions found, it was possible to determine specific values of physical quantities. In addition, a regression analysis was performed in this work, the results of which were compared with the Excel output to check the accuracy of the calculations. The purpose of this regression analysis was to check the relationship between velocity as a characteristic of the ship’s towing and the variable R/V. This variable determines the resistance to thrust divided by the velocity of the ship, which allows us to determine how the processes of gaining velocity and resistance depend on each other. Not least in this work was the calculation of the Signal-to-Noise Ratio (SNR), which determines the sensitivity of the transmitted signal. This report successively describes the different sections of the mathematical analysis, providing valuable data for the further design of the Sylender towing ship.
Experimental Procedure
The methodological framework, defined through conducting a real experiment, guided the course of this work. To begin, the Sylender model ship was placed on a long pool of water. A rope was attached to the front of the bow of the ship, simulating a tow rope under real conditions. This rope caused the Sylender to move along the pool at some velocity, and the velocity values at each time were automatically recorded in a spreadsheet. A total of five trials were conducted, each repeating the same actions: the point of such repetition was to minimize potential errors and to allow further choices. The first run of Sylender was considered the most convenient for mathematical analysis, which was done. The data were subjected to pruning of unnecessary ends, so the final function represented only informative values. All calculations were done either manually, as reflected in this report, or using Excel.
Results and Discussion
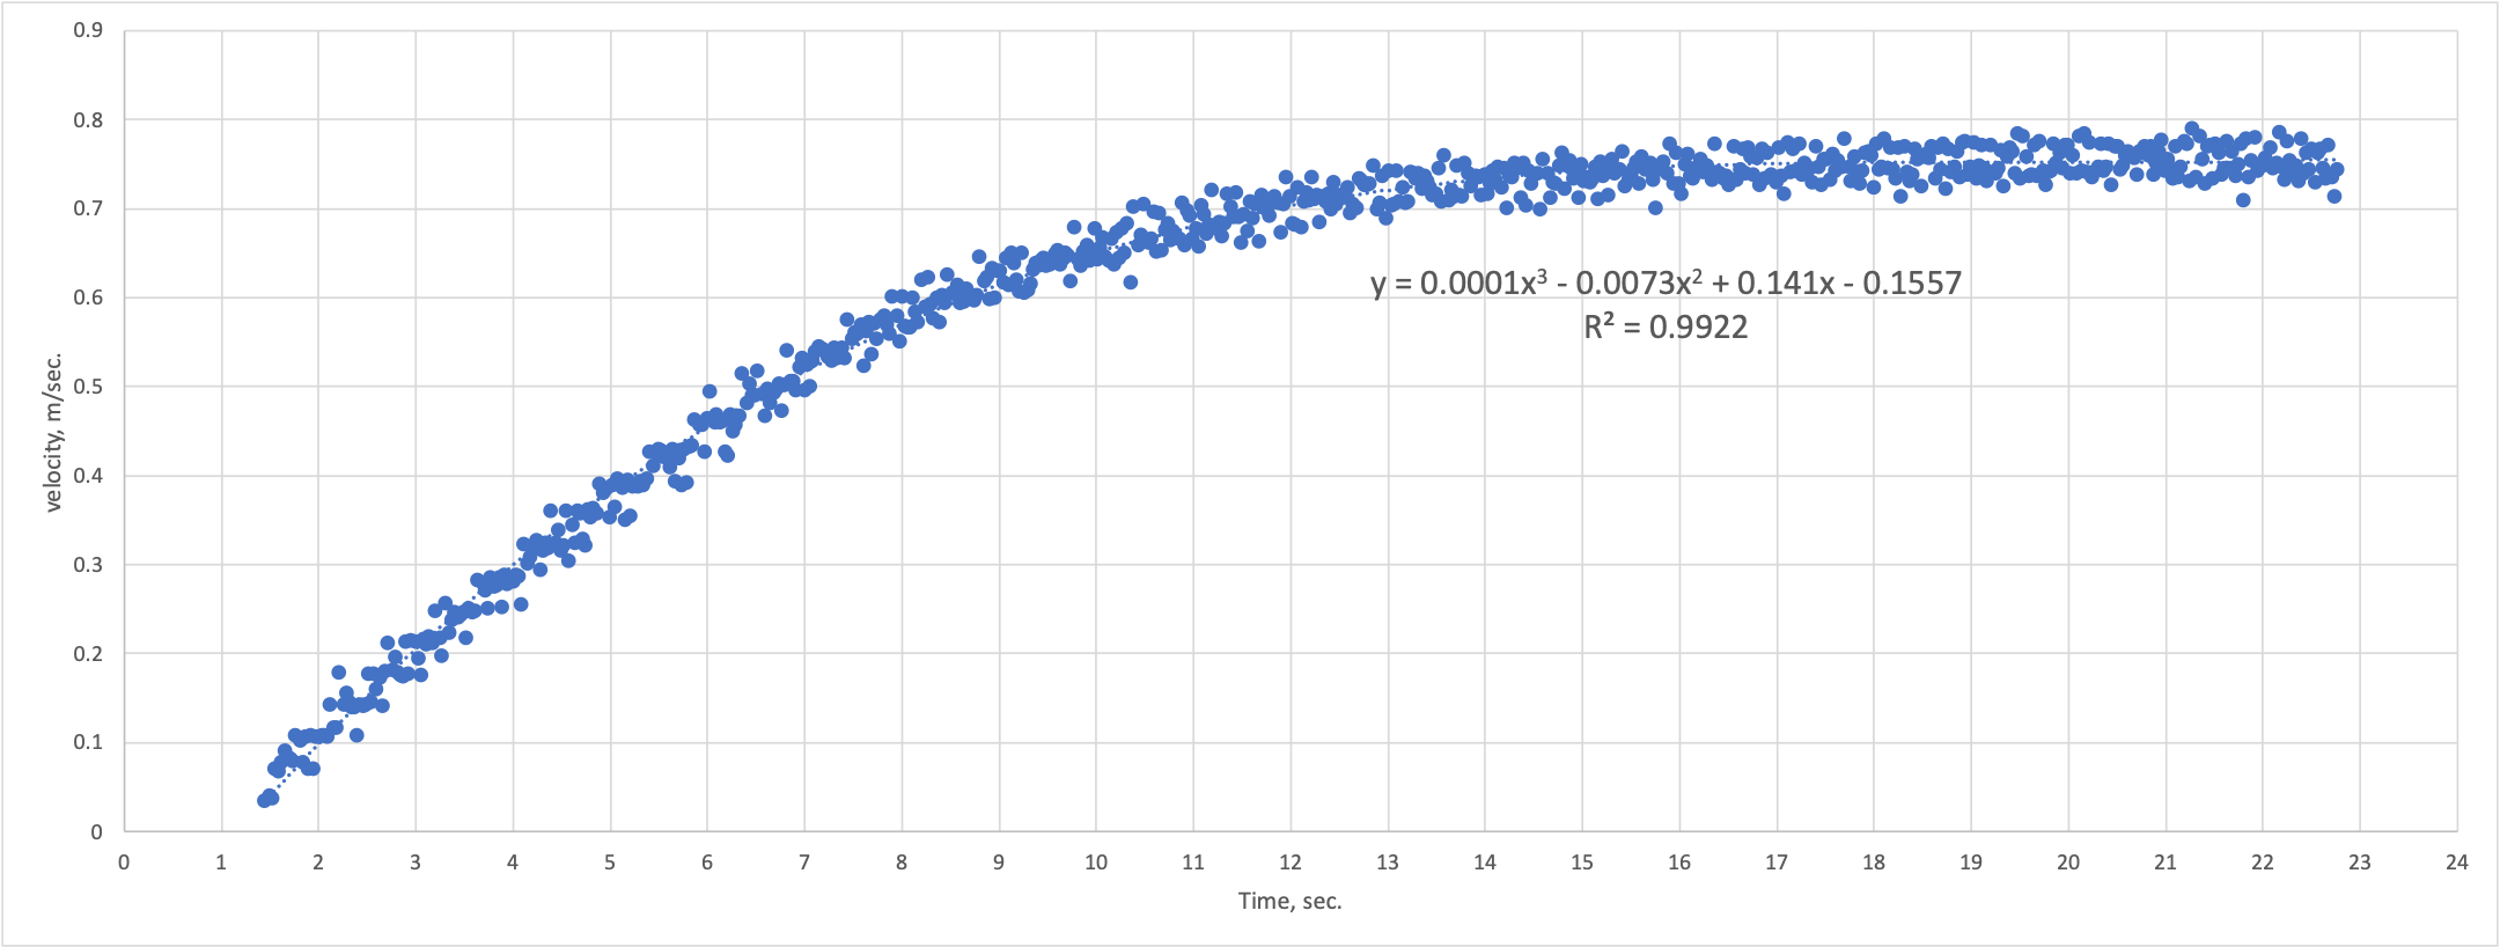
During the first part of the analysis in the current paper, it was necessary to evaluate the actual velocity vs. time relationship of the Sylender tow test. The previously clipped data was plotted on a scatter plot, which is shown in Figure 1. This figure shows that the velocity increased smoothly for the first 10 to 13 seconds, after which it came to a nearly horizontal line. This meant that the velocity from about the 13th second onward did not change significantly and maintained some constant value. It is noteworthy that this function is well described by the third-degree polynomial, which is its line of best fit. The coefficient of determination is 0.9786, as shown in the Figure, which implies that almost 98% of the variance of the data can be covered by the constructed regression.

What is even more interesting, the proposed regression equation can be seen as a real dependence of velocity on time:

It follows that there is a cubic rather than linear relationship between velocity and time, and that the horizontal line on which velocity changes little or no value may be a plateau. For this function, it is possible to determine an expression for the acceleration, which can be found by differentiating the velocity:

The acceleration for Sylender in this case is described by a parabolic form, the branches of which are directed upward. Knowing the expression for the acceleration, we can always find a particular acceleration for a particular time. Suppose at time t = 0, the acceleration of the function is:

That is, at time zero, Sylender was still gaining velocity. The velocity function can also be integrable in order to find an expression for the distance traveled. It is worth noting that taking an integral for the velocity function implies exactly a definite integral whose boundaries are defined. In this case, the boundaries defined by time are used as an interval to determine the distance Sylender traveled in that time. Since the test is interested in the total distance traveled by the ship, it is proposed to estimate its path from the minimum to the maximum values of time. Specifically, from t = 0 to t = 22.76 seconds:

This means that during the elapsed time, the Sylender ship traveled a distance equal to almost 11 meters. If we assume that the test time for each of the five launches was the same and reject any possibility of the influence of external factors on the behavior of the velocity function, we can cautiously say that in each of the launches the ship traveled a distance equal to about 11 meters. Of course, these are not accurate values at all, since in addition to rounding during calculations, there is the phenomenon of statistical error associated with measurement uncertainties and outside variables.
The second part of this report required a regression analysis to evaluate the relationship between velocity and R/V. This would involve determining the strength and direction of the relationship between the variables. A linear relationship is implied between the two, so at time V = 0, R/V would be expected to be zero. Any deviations from this value would meet the statistical errors and assumptions of regression analysis.


If the relationship between the variables were linear, it would be described by the equation:

Instead of gradient and y-intercept coefficients we can substitute formulas to calculate them:


This means that there is a positive increasing relationship between the variables. In this case the coefficients determining the reliability of the regression:


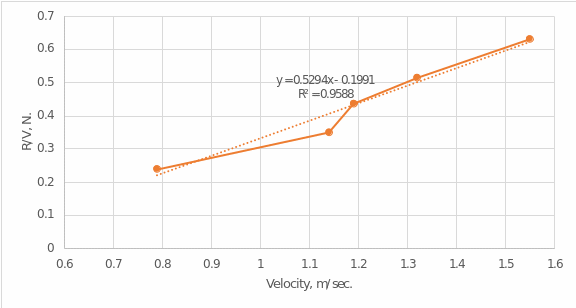
It follows that there is a strong positive relationship between the variables (r = 0.978), with the regression model being able to explain almost 96% of the variance in the data set. Comparing the calculated values to the Excel calculations gives an indication of the accuracy. Figure 2 shows the results of this Excel analysis. We can see that the values are virtually the same as those calculated above. The small deviation can be explained by the statistical error of calculations and rounding of values. Then, in general, we can conclude that the regression analysis was successful.

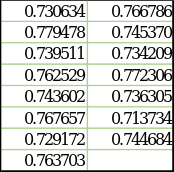
In the third part of this work, it was necessary to calculate the SNR coefficient responsible for signal purity and sensitivity in telecommunications. For this purpose, five point values were selected from those that had near maximum rate. Figure 3 shows these selected points. Figure 4 shows the calculation of descriptive statistics for them: mean and standard deviation. If we divide the first by the second, we can see how many times the mean was greater than the standard deviation. In the language of telecommunications, this ratio is called SNR.


Then it becomes possible to determine the SNR:

This value indicates that the signal is strong enough to be used to transmit valuable data. Strictly speaking, SNR is a measure of how well the useful part of the signal is isolated from outside noise. This value determines that the data will be minimally affected by outside noise.
In the last part of this report, it was necessary to calculate specific values for a given distance function:

Knowing this function, we can determine the distance traveled after ten seconds:

The function can also be differentiated to find an expression for the velocity:

Six seconds later, the velocity was:

At time t = 1.88 sec, the velocity was zero:


If we differentiate the function again, we can determine the expression for the velocity:

Four seconds later:

At time t = 0.5 sec, the acceleration was zero:


Conclusion
In this report, a mathematical analysis was performed to calculate the parameters for the Sylender tow test. The following conclusions were drawn:
- Velocity is nonlinearly dependent on time;
- Regression analysis showed a high positive correlation between V and R/V;
- The SNR level was quite high.
Reference
Boat US. (n.d.). A towing expert shares why boats get towed and what you can do to avoid these common breakdown situations. Web.