Introduction
The heart is a vital organ in living animals due to its roles in the transport of oxygen, nutrients and hormones to the rest of the body. Other functions of the heart include the elimination of metabolic wastes such as carbon dioxide and nitrogenous waste. The heart achieves these functions by the contraction and relaxation of its muscles, which is brought about by inputs from hormonal and neuronal sources (Dampney 2016). The parasympathetic autonomic nervous system (ANS) works through muscarinic receptors, whereas the sympathetic ANS uses adrenoreceptors. Acetylcholine and adrenaline are important signal molecules that control the activity of the heart.
Acetylcholine mediates its effects through muscarinic receptors that follow the G protein-coupled receptor pharmacology. Signal molecules that work via this mechanism bind to G protein-coupled receptors located on the surface of the cell membrane. Binding of the ligand leads to the release of G-proteins in the intracellular portion of the cell, which in turn activates a signal cascade that results in the production of second messengers such as cyclic AMP, calcium ions or inositol triphosphate or diacylglycerol (Newton, Bootman & Scott 2016). Second messengers lead to the amplification of the original signal by activating protein kinases that execute the final effects of the signal molecule, mainly in the parasympathetic nervous system
Adrenaline (epinephrine) is a signal molecule that exerts its effects through adrenergic receptors that are expressed in all cell types in the body. It affects the sympathetic nervous system. Adrenaline binds to alpha or beta receptors and the resultant effect of the molecule is determined by the receptor to which it binds. Two forms of beta receptors exist namely beta1 and beta2. Binding of adrenalin to beta1 receptors of the heart enhances the contractile force and heart rate (Maslov et al. 2015). In contrast, activation of beta2 receptors leads to smooth muscle relaxation. The binding of adrenalin to its alpha receptors leads to the constriction of blood vessels.
The effects of adrenalin and acetylcholine can be modulated by the presence of other molecules. Molecules that augment the action of a signal molecule are referred to as agonists. Conversely, antagonists are molecules that inhibited the action of signal molecules. Agonists mainly work by increasing the ligand-receptor binding of the molecules, whereas antagonists interfere with ligand-receptor interactions.
The effects of drug molecules can be studied by plotting concentration-response curves. A concentration-response curve is a graph showing the relationship between the quantity of a stimulus (X-axis) and the effects it elicits (Y-axis). A substance can either be classified as an agonist or antagonist based on the observed physiological response as observed on the concentration-response curves.
The Langendorff set up was established by Oscar Langendorff in 1895 (Yeo et al. 2017). It entails isolating a heart from a living organism and maintaining its contractile ability for as long as possible to facilitate further studies on cardiac physiology. The heart is removed from the host animal’s body followed by cutting off the blood vessels. The heart is then perfused in a reverse pattern in an oxygenated nutrient-rich solution. The most commonly used solutions are Krebs-Hensleit or Tyrode (Alonso et al. 2015). These conditions simulate the physiological conditions and serve to prolong muscle contraction.
The Langendorff experiment aimed at using an ex vivo isolated rat heart preparation to demonstrate the pharmacological effects of two unknown drugs (X and Y) by quantifying their effects on the heart’s response to adrenaline and acetylcholine. The Langendorff heart preparation was chosen because it provides a controlled environment to facilitate the investigation of physiological occurrences without the interference of neurological and hormonal regulations. It was hypothesised that the administration of adrenalin would increase the heart rate, whereas the inclusion of acetylcholine would
Methods and Materials
A heart was removed from a rat and its blood vessels were severed. The aorta was cannulated and attached to a source of Krebs-Hensleit solution (KHS) with 95% oxygen and 5% carbon dioxide at constant pressure as described in the lab manual. Once the heart was completely perfused with the KHS solution and its contractile activity was restored, the baseline heart rate (in beats per minute) and left ventricular developed pressure (LVDP in mmHg) were measured and recorded in 4 runs.
Adrenaline was added to the KHS solution at a concentration of 0.1 µM followed by the measurement of the heart rate and LVDP in 4 different runs. These parameters were measured when the concentration of adrenaline was increased to 1 and 10µM. Drug X was added to the KHS solution followed by the measurement of the heart rate and LVDP. A similar procedure was repeated with acetylcholine at concentrations of 0.3, 3 and 30µM in 4 different runs. The means, standard deviations, and standard errors were calculated for each parameter at various concentrations. Unpaired student t-tests were used to compare the mean heart rate and LVDP different concentrations of acetylcholine and adrenaline. Statistical analysis was done at 0.05 level of significance.
Results
The heart rate increased from 20 bpm at an adrenalin concentration of 0.1 µM to 60 BPM at 1 µM and tripled to approximately 180 BPM at 10 µM (Figure 1). The administration of drug X reduced the heart rate from 170 to 5.75 BPM. The mean change in heart rate between adrenalin + drug X is shown in Figure 2. Acetylcholine led to a reduction in heart rate from baseline to -20 BPM at a concentration of 0.3 µM to -40 BPM at 3 µM and 94 BPM at 30 µM. Acetylcholine and drug Y led to an increase in heart rate to -47.75 bpm (Figure 3). The mean change in heart rate between acetylcholine only and acetylcholine + drug Y is shown in Figure 4.
Adrenalin led to an increase in LVDP from baseline to 20 mmHg at a concentration of 0.1 µM to 38.25 mmHg at 1 µM and 53.25 mmHg at 10 µM. A mixture of adrenalin and drug X led to a reduction of LVDP from 53.25 mmHg to 18.5 mmHg (Figure 5). Figure 6 shows the mean change in LVDP with adrenalin and drug X. Figure 7 shows that LVDP increased from baseline to 12.5 mmHg at an acetylcholine concentration of 0.3 µM to 30 mmHg at 3 µM and 47.74 mmHg at 30 µM. A mixture of acetylcholine and drug Y led to a reduction in LVDP to 13.75 mmHg. Figure 8 shows the mean change in LVDP with acetylcholine and combined acetylcholine and drug Y. tables 1 and 2 show the raw data for all the runs.
Unpaired student t-tests were done to compare the mean changes in heart rate and LVDP for adrenalin and drug X as well as acetylcholine and drug Y. The mean reduction in heart rate between adrenalin and adrenalin and drug X was statistically significant (p<0.0001). Similarly, the mean reduction in LVDP between adrenalin and adrenalin and drug X was statistically significant (p= 0.0037). The mean increase in heart rate with acetylcholine and drug Y was statistically significant (p=0.0003). In the same way, the mean reduction in LVDP between acetylcholine and drug Y was statistically significant (p<0.0001).
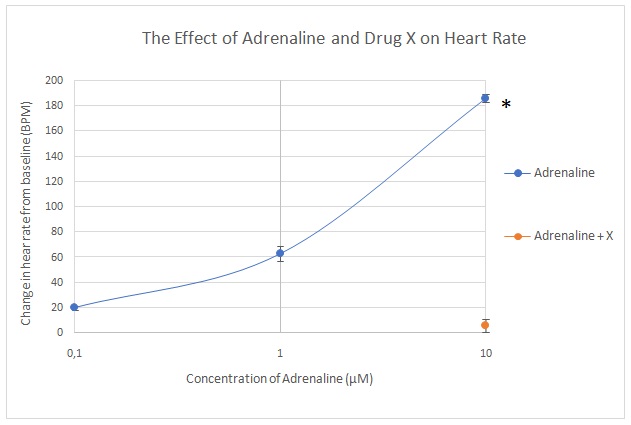
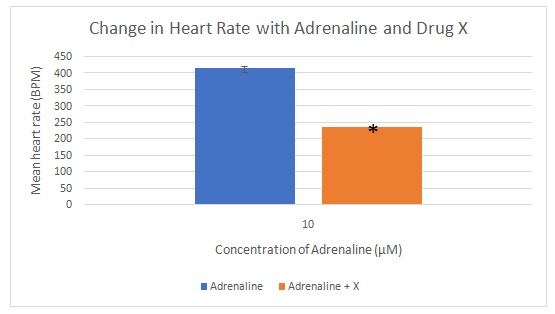
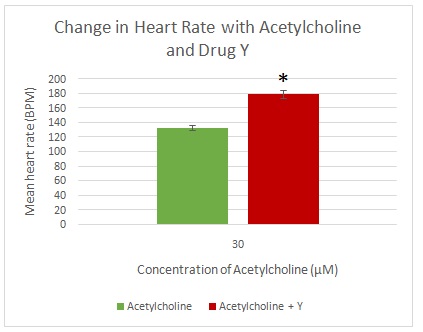

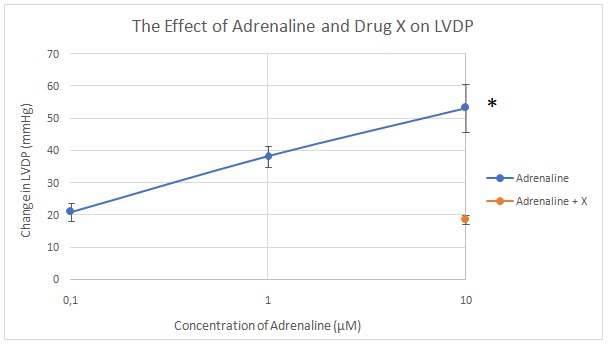
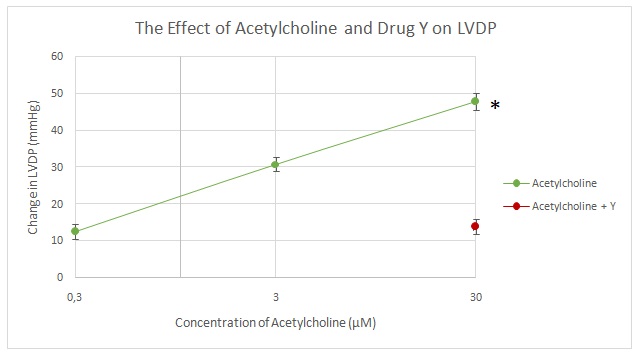
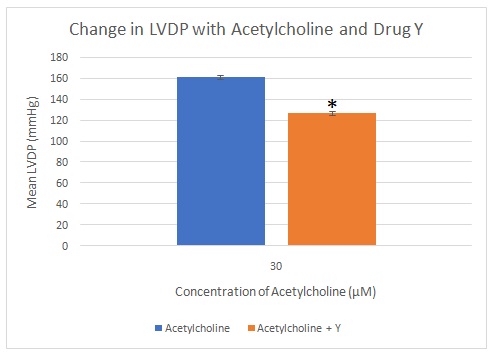
Table 1: Raw data showing the heart rate and LVDP for adrenalin as well as adrenalin and drug X. The means, standard deviations and standard errors are also included.
Table 2: Raw data showing the heart rate and LVDP for acetylcholine as well as acetylcholine and drug Y. The means, standard deviations and standard errors are also included.
Discussion
Adrenalin led to a significant increase in heart rate by binding to its beta1 receptors, which activated the adrenergic signalling cascade thereby leading to an increase in heart rate. This chronotropic effect was proportional to the concentration of adrenalin that was administered. The observed increase in LVDP was attributed to the binding of adrenalin to its alpha receptors, which increased the contractile effect of the heart (inotropic effect) (Maslov et al. 2015). These outcomes were expected because adrenalin is reported to activate the adrenoceptors and cause an increase in blood pressure and heart rate, which is usually evidenced in fight or flight reactions (Okoshi, Cezar & Okoshi 2018). Drug X was antagonistic to the actions of adrenalin because it suppressed its chronotropic and inotropic effects. Adrenalin antagonists can either be competitive or non-competitive (White et al. 2018).
Acetylcholine reduced the heart rate and contractility of the heart significantly by binding to muscarinic receptors. These effects opposed the actions of the sympathetic nerves, especially those of adrenalin by lowering the heart rate and blood pressure. Therefore, acetylcholine can be considered antagonistic to adrenalin. Acetylcholine activates muscarinic receptors on the vascular endothelium, leading to the production of nitric oxide. This gas causes the relaxation of smooth muscles, thereby lowering arterial blood pressure, which generates a baroreceptor-mediated rise in heart rate (AbouAlaiwi & Gibson 2017). A beta-blocker or ganglionic blocker can obstruct the baroreceptor reflex, leading to the direct observation of acetylcholine’s effect on the sinoatrial node to lower heart rate. However, in this case, acetylcholine was shown to increase the LVDP instead of reducing it, thereby indicating an experimental anomaly. Drug Y and acetylcholine increased the heart rate, suggesting that was antagonistic to acetylcholine effects with respect to heart rate. However, drug Y and acetylcholine reduced the LVDP, indicating that Y was agonistic to acetylcholine with respect to its LVDP lowering function.
The incorrect effect of acetylcholine on LVDP could be attributed to limitations in the Langendorff setup. Prolonged ischemic periods could cause ischemic preconditioning of the heart, which may alter the outcomes. This problem can be corrected by minimising the time taken to set up the heart and keeping it constant between experiments (Motayagheni 2017).
Conclusion
The purpose of this experiment was to determine the effects of adrenalin, acetylcholine and two unknown drugs X and Y on cardiac physiology. The findings showed that adrenaline binds to the cardiac adrenoceptor leading to a significant increase in the heart rate and LVDP. In contrast, acetylcholine attaches to the cardiac muscarinic receptors resulting in a significant reduction in heart rate. Drug X was an adrenaline antagonist, whereas drug Y was a cardiac muscarinic receptor agonist.
List of References
AbouAlaiwi, W. A., and Gibson, H. (2017) ‘Abstract P184: Muscarinic Receptor Modulators’ Effect on Cilia Structure and Nitric Oxide Release’. Hypertension 70 (suppl_1), AP184-AP184.
Alonso, H., Fernández-Ruocco, J., Gallego, M., Malagueta-Vieira, L. L., Rodríguez-de-Yurre, A., Medei, E., and Casis, O. (2015) ‘Thyroid Stimulating Hormone Directly Modulates Cardiac Electrical Activity’. Journal of Molecular and Cellular Cardiology 89, 280-286.
Dampney, R. A. (2016) ‘Central Neural Control of the Cardiovascular System: Current Perspectives’. Advances in Physiology Education 40 (3), 283-296.
Maslov, M. Y., Wei, A. E., Pezone, M. J., Edelman, E. R., and Lovich, M. A. (2015) ‘Vascular Dilation, Tachycardia, and Increased Inotropy Occur Sequentially with Increasing Epinephrine Dose Rate, Plasma and Myocardial Concentrations, and cAMP’. Heart, Lung and Circulation 24 (9), 912-918.
Motayagheni, N. (2017) ‘Modified Langendorff Technique for Mouse Heart Cannulation: Improved Heart Quality and Decreased Risk of Ischemia’. MethodsX 4, 508-512.
Newton, A. C., Bootman, M. D., and Scott, J. D. (2016) ‘Second Messengers’. Cold Spring Harbor Perspectives in Biology 8 (8), 1-15.
Okoshi, M. P., Cezar, M. D., and Okoshi, K. (2018) ‘Adrenaline: More than a Century After Its Discovery and Still A Mystery’. International Journal of Cardiology 253, 124-125.
White, J. L., Greger, K. C., Lee, S., Kahoud, R. J., Li, J. T., Lohse, C. M., and Campbell, R. L. (2018) ‘Patients Taking β-blockers Do Not Require Increased Doses of Epinephrine for Anaphylaxis’. The Journal of Allergy and Clinical Immunology: In Practice 6 (5), 1553-1558.
Yeo, J. M., Tse, V., Kung, J., Lin, H. Y., Lee, Y. T., Kwan, J., Yan, B. P., and Tse, G. (2017) ‘Isolated Heart Models for Studying Cardiac Electrophysiology: A Historical Perspective and Recent Advances’. Journal of Basic and Clinical Physiology and Pharmacology 28 (3), 191-200.