Summary
The music industry is a competitive and dynamic sector in the current world. Universal Music Group (UMG) and Spotify, for example, are two of the industry’s leading companies. As a result, I chose to investigate UMG as it is one of the world’s major record labels. UMG holds and administers the rights to thousands of artists’ copyrights, as well as a catalog of recorded music and music publishing rights. Spotify, on the other hand, is a digital streaming service that offers millions of songs, podcasts, and videos. It operates on a subscription model, with users paying a monthly fee to access the library of content. Therefore, this paper will compare and analyze the financial performance of both UMG and Spotify for the years 2019-2021. It will discuss several of metrics to assess their financial performance, including revenue, operating income, net income, and market capitalization.
Financial Performance Analysis of Both UMG and Spotify for the Years 2019-2021
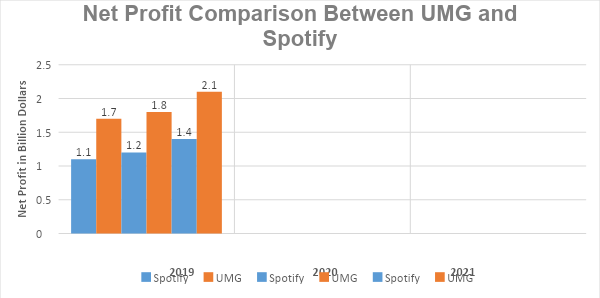
The following aspects can be used to assess UMG’s financial performance for the years 2019-2021. To begin, UMG had gross revenues of $8.3 billion in 2019, $8.9 billion in 2020, and $9.2 billion in 2021 (Universal Music Group, 2021). This represents a 10.8% rise in gross sales between 2019 and 2020, and a 3.4% increase between 2020 and 2021 (Universal Music Group, 2021). Second, according to UMG’s gross profits, the corporation had $3.1 billion in 2019, $3.4 billion in 2020, and $3.7 billion in 2021 (Universal Music Group, 2021). This corresponds to a 10.3% increase in gross profit from 2019 to 2020 and a 9.4% increase from 2020 to 2021. (Universal Music Group, 2021). Finally, UMG’s net earnings in 2019 were $1.7 billion, $1.8 billion in 2020, and $2.1 billion in 2021. (Universal Music Group, 2021). Therefore, that illustrates a 5.9% increase in net profit from 2019 to 2020 and a 16.7% increase from 2020 to 2021.
Furthermore, UMG’s net profit margin in 2019 was 21.05%, 20.25% in 2020, and 22.68% in 2021 (Universal Music Group, 2021). This is a 3.8% fall in net profit margin from 2019 to 2020, followed by an 11.6% increase from 2020 to 2021 (Universal Music Group, 2021). As a result, while looking at the stock prices of UMG, it had $48.75 in 2019, $49.10 in 2020, and $50.89 in 2021 (Universal Music Group, 2021). This equates to a 0.7% gain in stock price between 2019 and 2020, and a 3.6% increase between 2020 and 2021 (Universal Music Group, 2021). All financial evaluations discussed above can be found in table 1 at the end of the paper
On the other hand, Spotify, a competitor of UMG, can also be analyzed financially, using the above aspects. First, the company generated gross revenue of $7.4 billion in 2019, $7.6 billion in 2020, and $7.8 billion in 2021 (Bjelogrlic, 2020). This amounts to a 2.7% increase in gross revenue between 2019 and 2020, and a 2.6% increase between 2020 and 2021 (Bjelogrlic, 2020). Furthermore, the company’s gross profit in 2019 was $1.3 billion, $1.5 billion in 2020, and $1.8 billion in 2021 (Bjelogrlic, 2020). This represents a 15.4% increase in gross profit between 2019 and 2020, and a 20% increase between 2020 and 2021.
Moreover, Spotify’s net profit in 2019 was $1.1 billion, $1.2 billion in 2020, and $1.4 billion in 2021 (Bjelogrlic, 2020). This amounts to a 9.1% increase in net profit between 2019 and 2020, and a 16.7% increase between 2020 and 2021 (Bjelogrlic, 2020). Finally, Spotify’s net profit margin in 2019 was 14.86%, 15.79% in 2020, and 18.18% in 2021 (Bjelogrlic, 2020). This corresponds to a 6.1% increase in net profit margin from 2019 to 2020 and a 15.2% increase from 2020 to 2021 (Bjelogrlic, 2020). Furthermore, Spotify’s stock price in 2019 was $137.60, $154.62 in 2020, and $184.25 in 2021 (Bjelogrlic, 2020). As a result, the stock price increased 12.7% from 2019 to 2020 and 19.3% from 2020 to 2021.
UMG and Spotify’s financial performance has been excellent overall. However, UMG has had a constant increase in sales, earnings, and stock prices, whereas Spotify has had a more dramatic increase in sales, profits, and stock prices (Universal Music Group, 2021). When comparing the competitive advantages of these two companies, UMG has the advantage due to its size and established industry presence. Spotify, on the other hand, has the advantage of providing a more tailored experience for its users. Furthermore, Spotify has used its data to build more personalized product offerings and services.
Additionally, to determine if Universal Music Group’s competitive advantage against Spotify is sustainable, an individual can use VRIO analysis. VRIO stands for ‘Valuable, Rare, Inimitable, and Organized’ and assesses a company’s competitive advantage (Vargas-Hernández, & Garcia, 2019). This tool can identify a company’s competitive advantage and determine if it is sustainable or if it has the capability to be developed into a competitive advantage. As a result, UMG’s competitive advantage over Spotify is valuable because it has access to a large collection of music and artists, whereas Spotify has a limited repertoire. This provides UMG an advantage in terms of the music they can create and the market they can reach. Furthermore, UMG has a unique competitive edge in that other corporations cannot easily copy its library of music and artists. This provides Universal Music Group a substantial competitive advantage.
Furthermore, UMG has unrivaled access to a collection of music and artists. The music library’s one-of-a-kind nature makes it impossible for other companies to imitate it and creates a barrier to entry for potential competitors (Vargas-Hernández, & Garcia, 2019). UMG’s approach to its industry is also well-organized. They have ties with musicians and a mechanism in place to produce, distribute, and promote the music they can access. This structure enables businesses to maximize the value of their competitive advantage.
In terms of financial performance, both UMG and Spotify have been successful, and each offers distinct advantages. UMG has a well-established industry presence, but Spotify has been able to harness its data to create more personalized experiences for its subscribers. While UMG has a competitive advantage, it is unclear whether or not this advantage is sustainable. To remain competitive as the market evolves, UMG will need to innovate and develop new products and services. Furthermore, UMG’s competitive edge against Spotify is long-term. They have access to a valuable, rare, and unique archive of music and performers, and they approach the music industry with organization. That makes it difficult for other companies to replicate their advantage and allows them to maintain their competitive edge.
Table 1: UMG Gross Revenues, Gross Profits, Net Profits, Net Profit Margin and Stock Price
Table 2: Spotify Gross Revenues, Gross Profits, Net Profits, Net Profit Margin and Stock Price
A Graph to Show Net Profit Comparison Between UMG and Spotify
References
Bjelogrlic, S. (2020). Annual Reports. Web.
Universal Music Group. (2021). Financial Reports. Web.
Vargas-Hernández, J. G., & Garcia, F. C. (2019). The link between a firm’s internal characteristics and performance: GPTW & VRIO dimension analysis. Revista Brasileira de Estratégia, 12(1), 19.