Introduction
We posit two research questions:
- Being overweight or obese is a high-risk factor for diabetes mellitus.
- Self-care among middle-aged diabetics is a function of education and income, irrespective of insurance coverage.
Intergenerational obesity rates are worrisome and continue to rise in both North America and Europe. As of 2006, the Centers for Disease Control and Prevention found (2007), more than a third (34%) of U.S. adults 20 years and over were obese. These levels are “alarmingly high” (CDC, 2007), even though obesity prevalence had not risen by a statistically significant degree from 2003 to 2005.
Beyond the lifestyle changes and medication required for control of blood glucose levels, cardiology professor McMurray pointed out at the recent Heart Failure 2009 Conference (European Society of Cardiology, 2009) that the intertwined syndromes of obesity and diabetes will not only reinforce the standing of heart failure as the leading chronic cardiovascular disease but also cause an “explosion” in incidence rates of the syndromes. For the one-third of heart failure patients evincing symptoms of diabetes, physicians admit that treatment is very difficult. Unhappily, a longitudinal study of adults who had already had at least one episode of myocardial infarction revealed that the prevalence of obesity rose from 25% to 38% in the decade ending in 2007 (Kotsevaa, Wooda, De Backerb, De Bacquerb, Pyöräläc, and Keild, 2009).
In short, obesity heightens the risk for diabetes which in turn doubles the risk of heart failure.
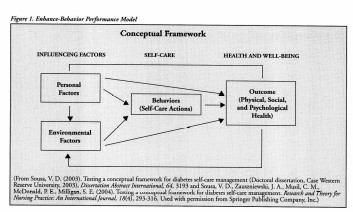
The management of diabetes is a lifelong matter. It is self-evident then that health care practice in this area relies greatly on the theories of role modeling and self-care. The theoretical framework of self-care proposes that the patient can provide for his care from day to day and that he or she should be able to balance such self-care aspects as physical health status, hope, support, control, and satisfaction with daily living (Erickson, Tomlin, & Swain, 1983; Baldwin, Hibbeln, Herr, Lohner and Core, 2002).

Focusing more closely on the management of diabetes, Sousa and Zauszniewski (2006) suggest that useful cues may be had from Orem’s Self-Care and Bandura’s Self-Efficacy theories. The former takes into account both self-agency and conditioning factors in explaining what it takes to promote, maintain and structure one’s life, function in many milieus, restore health and in general, preserve well-being (Orem, 1995; Wang, 1997; Anderson, 1996).
Conforming with most social learning theories, Bandura’s Self-efficacy Theory advances the aspects of self-confidence and belief in performing prescribed actions to obtain desired outcomes (1997). “Self-efficacy” is a multi-faceted capability brought on by directly engaging in required behavior (what Bandura terms “enactive mastery experience”), vicarious experience, encouragement, and motivation. In turn, there must be support and positive reinforcement in the form of verbal persuasion by a physician or other primary health care professional, physiological outcomes, and a kind of self-satisfaction at being able to cope with the required therapeutic regimen. Others have subsequently validated Self-efficacy Theory in finding that interventions and skill development for self-care management upgrade self-efficacy (Parent & Fortin, 2000) and that the latter is also associated with patient engagement in disease self-care management and adopting a health-promoting lifestyle (Moon and Baker, 2000; Carroll, 1995).
Sample and Methods
Profile
The sample of 2,729 adults from Alameda County is reckoned as an important benchmark because the ethnic composition of the county is said to be representative of the nation as a whole. For what it is worth, the profile of the sample that had undergone baseline interviews in 1965 is as follows:
Women outnumber men by a significant 57:43 ratio (Table 1 in Appendix). The proportion who claim to be homemakers matches almost precisely the population share of women (Table 4). More than two-thirds were married at the time of the survey (69%, see Table 7) while one-fourth of adults were either widowed/widowers or between marriages, so to speak.
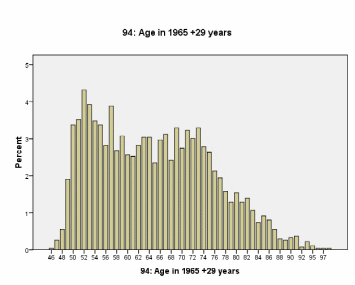
Just two in five were employed at the time of the study (Table 2). The large gap is accounted for mainly by the fact that nearly half of the panel first interviewed in 1965 could claim to have retired, at least from a first job (Table 3). Parenthetically, Figure 2 shows that the original panel interviewed three decades earlier were now in their 50s, 60s, 70s, and 80s. The median age was 64 years (Table 10).
Far from being idle, however, around 40% of these retirees were in business for themselves (Table 6). Otherwise, less than one in fifty of the population are students (Table 5).
In point of income class (Table 8), better than one-third of respondents could be counted upper-middle-class or well-off, belonging as they did to households earning at least $50,000 annually in 2003. The seriousness of the low-income skew is shown, however, by the fact that the median income range was $35,000 to $39,999 (Table 10).
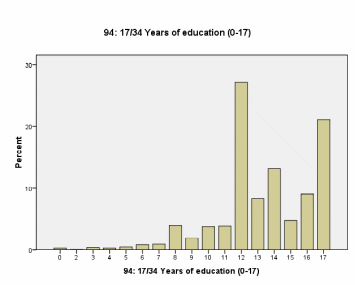
Alameda residents are highly educated, given since they were more likely to have had postgraduate education or at least some college rather than secondary education (Figure 1).
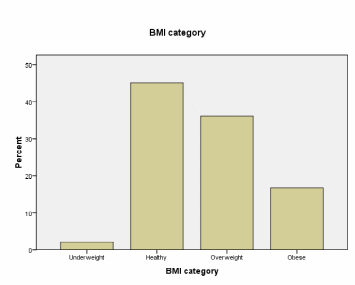
Based on claimed weight relative to reported height, over one-third could be classed “overweight” while another 16.7% were certifiably obese (Table 9).
Results
Research Question 1: Obesity and Diabetes
The survey items of concern here are BMI2 (body mass classes after calculating from the original height and weight variables) and incidence of diabetes (“diabx9” in the database). The former is an ordinal variable while the latter, being a simple “yes”/”no” question, is a nominal variable.
Examining both variables for central tendency and distribution, one finds that:
- Just 8.4% of the sample admitted to having become a diabetic at any time in the past (Table 11). Only the modal value applies for this nominal variable and that is, of course, the answer “no” (92%).
- Measures of variance are not applicable at this level of measurement.
- For body mass index, effectively an ordinal variable, the modal value is “healthy weight” (45%, see Table 12 and Figure 3).
- Variance applies to this item but it appears low at 0.6 on a four-point scale (Table 13).
- There is a rightward skew to the BMI variable (see Table 13) and this is confirmed by visual inspection of Figure 3. In short, “healthy” BMI may be the case more often than not but the population tends to be overweight or outright obese.
The hypotheses can be articulated as follows:
H0, the null hypothesis = Formally, body mass index status is equal for both categories of the variable diabetic status. In short, the BMI distribution is equal regardless of diabetes status.
Ha, the alternative hypothesis = Formally, body mass index status is not equal for both categories of the variable diabetic status. In short, BMI distribution is equal regardless of diabetes status.
Given the categorical nature of the “diabetes incidence” variable, the ANOVA assumption of the normal distribution cannot be relied on. The nonparametric Kruskal-Wallis H Test – comparing the medians of two or more samples to determine if the samples have come from different populations – is then used in place of a One-Way ANOVA.
The results (Table 14) show, first of all, that the mean rank for BMI is at 1,590.22 (see Table 14) for those who professed to be diabetic. This is higher than the 1,286.78 mean ranks calculated for non-diabetics. Table 15 shows the significance of the Kruskal-Wallis statistic is p < 0.001, which is substantially greater than the criterion level of significance of α = 0.05 for 1 degree of freedom. Since this means that there is an infinitesimally small chance that the differences in BMI across patient conditions occurred at random, we reject the null hypothesis and conclude that the analysis supports the research hypothesis that the average rank for BMI is truly greater for diabetics than non-diabetics. Diabetics are more likely to be overweight or obese.
Research Question 2: Three Antecedents of Self-Care for Diabetics
Given the proposition that self-care among elderly diabetics is a function of education and income, irrespective of insurance coverage, the survey items of concern here are incidence of diabetes (“diabx9” in the database) as the filter variable, “sweat9” (exercise enough to work up a sweat) as the dependent variable at an ordinal class of measurement, and possible independent variables in “HINS9” (no health insurance), the ratio variable “EDUC9” (Years of education), and “INCOME9” (total income in 1993).
Screening crosstabulation (Table 16) reveals that health insurance is unlikely to discriminate among diabetics who work out or not since less than 4% of diabetics had no health insurance of any kind. Irrespective of insurance status, therefore, one tests for the hypotheses:
H01, There is no difference in self-care exercise frequency by the level of education.
Ha1, Self-care exercise frequency increases with the level of education.
H02, There is no difference in self-care exercise frequency by household income.
Ha2, Self-care exercise frequency increases with household income.
Since the levels of measurement are either interval or ratio, it is possible to employ parametric tests, specifically the ANOVA, to compare means of exercise frequency across levels of the independent variables education and income.
At 12.10, the F result for between-groups differences by level of income (see Table 17) is higher than the table values for thirteen degrees of freedom at α = 0.05. The significance statistic is p <0.001, suggesting that such differences by income could not have occurred by random variation alone. Hence, one rejects the null hypothesis and concludes that diabetic patients from higher-income households are more conscientious about adhering to a self-care and lifestyle regimen that includes exercising enough to work up a sweat.
Since there is a degree of auto-correlation between income and educational attainment, it stands to reason that the F value associated with between-group differences by level of education is also high enough for df=16 to return p<0.001. Again, we reject the second null hypothesis and conclude that complying with vigorous physical workouts is more likely when the patient is better-educated.
References
Anderson, J. A. M. (1996). Basic conditioning factors, self-care agency, self-care, and well-being in homeless adults. Unpublished doctoral dissertation, Wayne State University, Detroit, Michigan.
Baldwin, C. M., Hibbeln, J., Herr, S., Lohner, L. & Core, D. (2002). Self-care: As defined by members of the Amish community utilizing the theory of modeling and role-modeling. Journal of Multicultural Nursing & Health, 8(3) 60-64.
Bandura, A. (1997). Self-efficacy: The exercise of control. New York, NY: W. H. Freeman.
Carroll, D. L. (1995). The importance of self-efficacy expectations in elderly patients recovering from coronary artery bypass surgery. Heart and Lung: Journal of Acute and Critical Care, 24(1), 50-59.
Centers for Disease Control and Prevention (2007) New CDC study finds no increase in obesity among adults; but levels still high. National Center for Health Statistics, Office of Communication (301) 458-4800.
Erickson, H., Tomlin, E. & Swain, M. A. (1983). Modeling and role-modeling: A theory and paradigm for nursing. Englewood Cliffs, N.J.: Prentice-Hall.
European Society of Cardiology (2009) Obesity and diabetes double risk of HF — Patients with both conditions ‘very difficult’ to treat. Atlanta: NewsRx Health, proceedings of the Heart Failure 2009 Conference, 138.
Kotsevaa, K., Wooda, D. De Backerb, G., De Bacquerb, D., Pyöräläc, K. & Keild, U. (2009, April 1) EUROASPIRE III: a survey on the lifestyle, risk factors and use of cardioprotective drug therapies in coronary patients from 22 European countries. European Journal of Cardiovascular Prevention and Rehabilitation, 16(2) 121-137.
Moon, L. B. & Baker, J. (2000). Relationships among self-efficacy, outcome expectancy, and postoperative behaviors in total joint replacement patients. Orthopaedic Nursing, 19(2), 77-85.
Orem, D. E. (1995). Nursing: concepts of practice. (5th ed.). St Louis, MO: Mosby.
Parent, N. & Fortin, F. (2000). A randomized controlled trial of vicarious experience through peer support for male first-time cardiac surgery patients: impact on anxiety, self-efficacy expectation, and self-reported activity. Heart and Lungs: Journal of Acute and Critical Care, 29(6), 389-400.
Sousa, V. D. & Zauszniewski, J. A. (2005/2006). Toward a theory of diabetes self-care management. Journal of Theory Construction & Testing, 9(2) 61-67.
Wang, C. Y. (1997). The cross-cultural applicability of Orem’s conceptual framework. Journal of Cultural Diversity, 4(2), 44-48.
Appendices
Table 1
Table 2
Table 3
Table 4
Table 5
Table 6
Table 7
Table 8
Table 9


Table 10
Table 11
Table 12
Table 13
