The main objectives of these portfolios are to construct a portfolio that is of low risk and low correlation between the stocks selected for a period of 3 weeks. The portfolios selected should have a volatility of less than 130 percent.
The portfolio aims at investing 10 million in Hang Shang (market). This portfolio is aimed at managing the stocks for the benefit of the customers.
HIS index and portfolio selection
HSI is comprising 42 stocks but we have selected a few stocks, five, of them with stock Hong Kong electrical holding ltd (006), Hong Kong Exchanges and clearing ltd (0388), China overseas land and investment ltd (0688), Tencent Inc( 0700), Bank of communications (3328). These stocks are from diversified sectors i.e. it is not from one sector. Hong Kong electrical holding ltd is in the business of electrical while stock 0388 is in the business of clearing and forwarding. An investment company from china is stock 0688, while another company 0700 is a local company that deals with online services. These companies are used to construct this portfolio.
The main aim of selecting stocks from different sectors is to spread and minimize risk. The reasons are related to inherent differences in equity contracts, coupled with the notion that an investment in forms in dissimilar industries would most likely do better than in firms within the same industry. Holding one stock from each sector is likely to do better than in firms within the same industry. Holding one stock each from finance, utilities, properties, and commerce and industry leads to the conclusion that the best diversified comes through holding large numbers of securities scattered across industries.
Observation from this industry one would agree that a Portfolio consisting of five stocks is probably less risky than one holding one stock alone. However this will depend on the investor attitudes toward portfolios risk. And risk is, by proxy, the statistical notion of variance or standard deviation of return.
Four weeks portfolio review and analysis
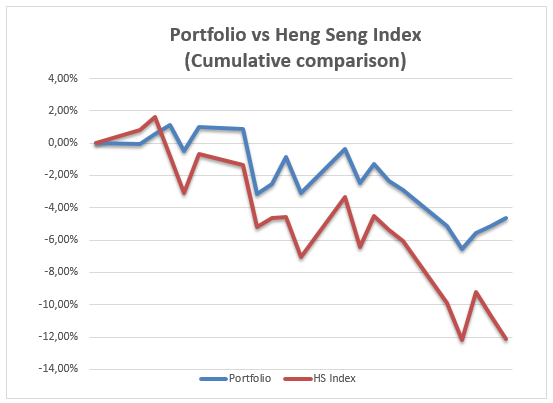
Looking at these portfolios for the last three weeks there is a downward trend in the return of the portfolio as well as the return of the index. However the portfolio is performing better as well as the index. The graph below shows the performance of portfolio and the market index. The downward trend being witnessed has made most investors suffered in the market as a result of their unwarranted expectations and these expectations had fuelled speculative highs that market had reached earlier before the crisis. Proposed solutions must focus on the irrational behavior of finance and provide controls on currency and capital movements that will restrict speculative activity and restore power to the levers of economic policy.
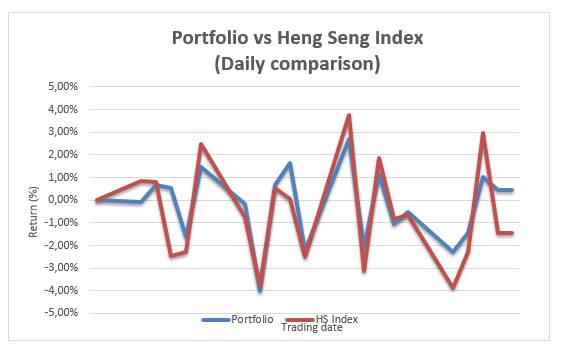
From the cumulative comparisons of the portfolio it can be observed that the portfolio performed well in terms of cumulatively as compared to the market. However, in terms of daily comparisons it can be observed that the portfolio was taking same direction the market was taking. Except in a few occasions like on the 9th on 13th 23rd 25th 26th the portfolio performed better than the market.
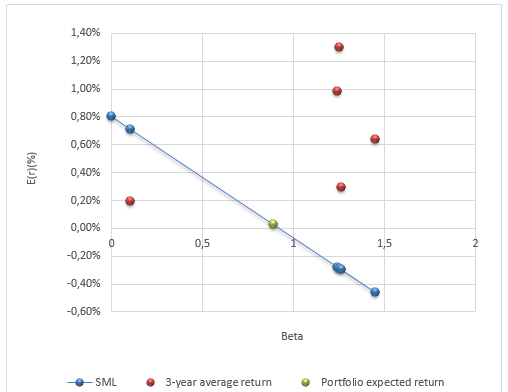
Looking at the capital pricing model of the portfolio it will be noted that there was improvement or the beta for the portfolio was better off as compared to the market. The total beta was less than one which was 0.637 for the whole period and the systematic risk was 0.0123. The historical capital asset pricing model verses historical mean is shown below. The portfolio period that considered was 4 weeks between the 9th February to March 6th which is 4 weeks.
The portfolio weighting has been kept constant for the whole period therefore there has been little change.
Sharpe’s Performance Measure For Portfolio
William Sharpe has attempted to get a summary measure of portfolio performance. His measure properly adjusts performance for risk. The Sharpe index is given by:
S1 = r1 – r*/ó
Where S1 = Sharpe index, R1 = average return on portfolio t, R* = riskless rate of interest and Ó = standard deviation of the returns of portfolio t
In this case
= 0.02—0.07 = -0.01438
6.46
Thus the Sharpe index measures the risk premiums of the portfolio (where the risk premium is the excess return required by investors for the assumption of risk) relative to the total amount of risk in the portfolio. Thus the Sharpe index summarizes the risk and return of a portfolio in a single measure that categorizes the performance of the fund on a risk adjusted in a single measure that categorizes the performance of the fund on a risk adjusted basis. The larger the S,1 the better portfolio has performed.
Treynor Perfomance Measure for Portfolios
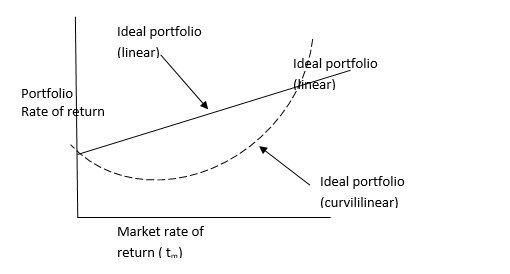
A key to understanding Treynors portfolios performance measure is the concept of characteristic line. In figure above the graphical representation of a characteristic line of an ideal portfolio. More accurately this linear representation is approximations of what is probably move frequently a curvilinear relationship. This curvilinear representation is the dashed line. If a line were added to this graph that intersected the origin at a 450 angle, it would represent a portfolio return that was equivalent to the return of the market portfolio. The ideal portfolio lies above and to the left of the imaginary 450 line.
Its return is at all times superior to one earned on the market portfolio. When the market portfolio earns a low or negative return the ideal portfolio still earns an even higher to a specific portfolio return, the ideal portfolio earns an even higher return. To put it more succinctly the characteristic line related the market return higher return. This line can be “fitted” via a least squares regression such as that involving a single index of a market portfolio.
The slope of the characteristic line is the beta coefficient, a measure of the portfolio’s systematic risk. Some people view systematic risk as a type of volatility measure. Thus, by comparing the slopes of characteristic lines the investor gets an indication of the funds volatility. The steeper the line, the more systematic risk or volatility the fund possesses. Treynor has proposed incorporating these various concepts into a single index to measure portfolio performance more accurately.
This index is given by the following equation
Tn = rn – r*/βn
Where Tn = Treynor index, Rn = average return on portfolio n, R* = riskless rate of interest and Βn = beta coefficient of portfolio n
= 0.02-0.07 = -0.05618
0.89
Thus, the Treynor index measure the risk premium of the portfolio, where risk premium equals the difference between the return of the portfolio and the riskless rate. This risk premium is related to the amount of systematic risk assumed in the portfolio. So the Treynor index sums up the risk and return of a portfolio in a single number, while categorizing the performance of the portfolio. Graphically the index measures the slope of the line emanating outward from the riskless rate to the portfolio under consideration.
Again portfolio preformed better than market both the Sharpe and Treynor indexes ranked portfolio higher than market.
Jensen’s Performance Measure for Portfolio
The Treynor and Sharpe indexes provide measures for ranking the relative performances of various portfolios, on a risk-adjusted basis. Jensen attempts to construct a measure of absolute performance on a risk-adjusted basis. That is a definite standard against which performances of various funds can be measured. This standard is based on measuring the “portfolio manager predictive ability – that is his ability to earn those returns through successful prediction of security prices which are higher than those which we would expect given the level of riskiness of his portfolio. In other words we are attempting to determine if more than expected returns are being earned for the portfolio riskiness.
W—R= ά+β(Rm-Rf)
W= average return of the portfolio
Rf = Risk free rate
ά = intercept that measures the forecasting ability of the portfolio
β= beta
(Rm= market return
= (0.002-0.07)- 0.89(12-7) = – 0.1125
And hold strategy,. The lower line ó 1 = a negative inferior management performance, because management did not do as well as an unmanaged portfolio of equal systematic risk. this situation could arise in part because portfolio returns were not sufficient to offset the expenses incurred in the selection and managing process.
The intercept may be interpreted in the fashion by examining equation this occurs because if the portfolio manager is performing in an superior fashion, his intercept will have a positive value because it will indicate that his portfolio is consistently over performing the overall market. This would happen if he either had superior ability in selecting undervalued securities or had superior ability in recognizing turning points in the market. This would happen if he either had superior ability in recognizing turning points in the market. Conversely, if the intercept were negative, it would indicate that the manager consistently underperformed the overall market. That is, the risk adjusted returns of his portfolio were consistently lower than the risk-adjusted returns of the market over the same period of time.
References
Bodie, Z., A. Kane and A.J. Marcus (2002); Essentials of Investments , the McGraw-Hill Companies, Inc.
DeFusco, R.A., Dennis W. M., Pinto J. E., Anson J. P., and Runkle, D. E. (2007). “Quantitative Investment Analysis” J. Wiley and Sons.
Fischer D. E. and Jordan R.J. (2006); Security analysis and Portfolio management, Prentice-Hall, India. Pp. 559-560.
Holmström, B. (1982). “Moral hazard and observability” International Bell Journal of Economics 12, 74–91.
McLaney E., (2003); Business finance theory and practice; Prentice Hall. Web.
Schlosser M.;(2002); Business finance: application, Models and cases, prentice hall. Web.
Westerfield R., Jaffe, and Jordan (2007); Corporate finance core principles and applications by McGraw-Hill. Web.