Capital budgeting analysis addresses the predicament of strategic long-standing investment decisions. It entails analyzing, evaluating and deciding whether resources should be allocated to a venture or not. In addition, it analyzes costs and benefits associated with potential investment expenditure (Pamela & Frank, 2002). This work will attempt to carry out a capital budget analysis for the $ 1 million new research cancer that Trinity Hospital considers putting up.
Trinity Hospital is considering putting up a new $ 1million cancer research wing in five years’ time. For the computations, the initial investment cost is $ 1 million, which will be invested wholly at the beginning of the first year. The amount will be used to purchase machinery and equipment for the cancer center and some will cater for operational costs. The project is estimated to have a useful life of 10 years. Other cash outflows for years 1 to 10 are expected to be $120,000 per annum. The expected cash flow is $400,000 per year from year 1 to 10. We shall assume that all cash flows are after-tax and no cash flow is expected after year 10. Further, it is assumed that the residue value for types of machinery will be zero. The required rate of return will be 10%. The techniques for capital budget analysis include the use of net present value (Pamela & Frank, 2002). From the table below, the project would generate a positive net present value of $654,980.32. Therefore, it is considered feasible. The table below gives the computation of the net present value for the cancer center.
Table of net present value
Table 1.0
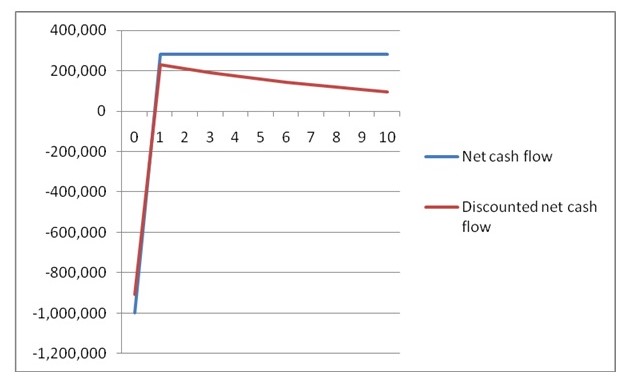
Graph showing trend of net cash flow and discounted net cash flow
Another approach is the payback period which considers the length of time that it takes for a project to recoup its initial cost out of the cash receipts that it generates (Kent & Philip, 2011). It is arrived at by dividing investment with net annual cash inflow.
Initial investment cost $1,000,000
Net annual cash flows $ 280,000
Period = 1,000,000/280,000
The project will take four years to recoup its initial investment. A project with a shorter payback period is considered viable. However, this method does not take into consideration the time value of money. Discounted payback period approach is preferred to the payback period. It computes the length of time required to recover the initial cash outflow from the discounted future cash inflows, the present value of cash inflows is cumulated until they equal the initial investment. This method considers the time value of money. However, it does not take into account the profitability of a project (Pamela & Frank, 2002).
Due to the downswing in the economy, management may be skeptical about investing in the cancer center. This can be attributed to limited capital due to the expected reduction in revenues. From the above capital budget analysis, we can deduce that investment in the cancer center would be profitable. The project will generate a positive net present value amounting to $654,980.32 with a payback period is of 4years. The profitability index is 1.56. Since the project is feasible, management should inject into in to it.
References
Kent, B. & Philip, E. (2011). Capital investment choice. Capital budgeting valuation, Alabama: Cangage
Pamela, P. & Frank, J. (2002). Capital budgeting evaluation technique. Capital budgeting, New York: Tailor and Sons