Introduction
The purpose of the present report is to determine whether the current expansion criteria of Pastas R Us, Inc. can be improved using statistical analysis. In order to achieve the purpose, statistical analysis was used to study correlations between key performance indicators of the company. According to Mariappan (2019), statistical analysis is the key to making unbiased business decisions.
A database of 74 restaurants that includes nine crucial metrics was used for the purpose. The data base included information on the area of the restaurants in square feet, per person average spending, sales growth over previous year, loyalty card percent of net sales, annual sales, median household income, annual sales per square foot, median age, and percentage of adults in the area with a bachelor degree or above. The descriptive statistics of the sample are provided in Table 1 below.
Table 1. Descriptive statistics
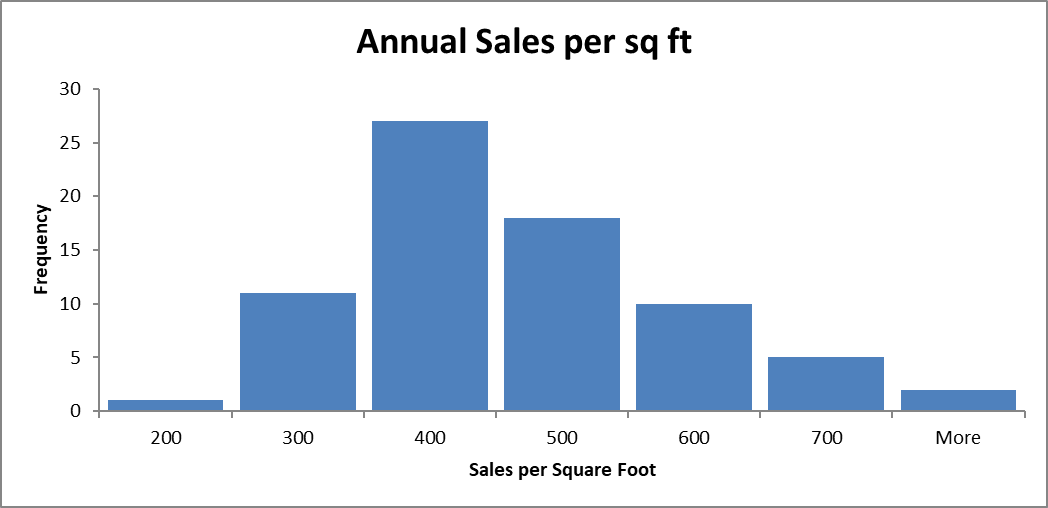
Descriptive statistics is of extreme importance, as it can help to summarize the data and spot correlation between variables (McClaive et al., 2018). The descriptive statistics demonstrates that the average size of the company’s restaurants is 2,580 square feet (SD = 375) with a person average spending of $7.04 (SD = 0.3) per person. The average sales growth of the restaurants was 7.41% (SD = 6.62) during the last year, and the loyalty card sales were around 2.03% (SD = 0.55) from net sales. The average median household income three miles around the restaurants was $62,808 (SD = 17,904) and the average median age in the area was 35.2 year (SD = 3.65). The average percentage of adults with a bachelor’s degree in the are was 26.31 (SD = 7). The average annual sales were $1,059,381 (SD = $280,423). All of the variables had a distribution close to the normal distribution curve, except for annual sales per square foot, which had a moderate positive skew (see Figure 1 below). According to Field (2018), such a distribution may demonstrate a violation of the assumption of normality, which may affect the reliability of further statistical analysis.
Section 2. Analysis
This section focuses on the analysis of relationships between various pairs of variables. The relationships are examined in Figures 2-5 below.
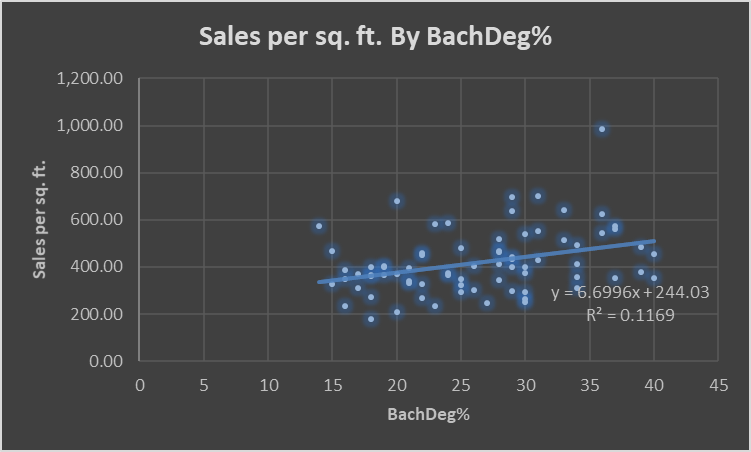
The analysis demonstrates that there was a positive linear correlation between the variables. This implies that the higher the percentage of adults with a bachelor’s degree living in the three-mile area, the higher the sales per square foot in the restaurant. Even though the line is somewhat close to being parallel to the x-axis, the slope was still significant. Moreover, the R2 coefficient demonstrated that the equation could explain 11.7% of the changes in the sales per square foot.
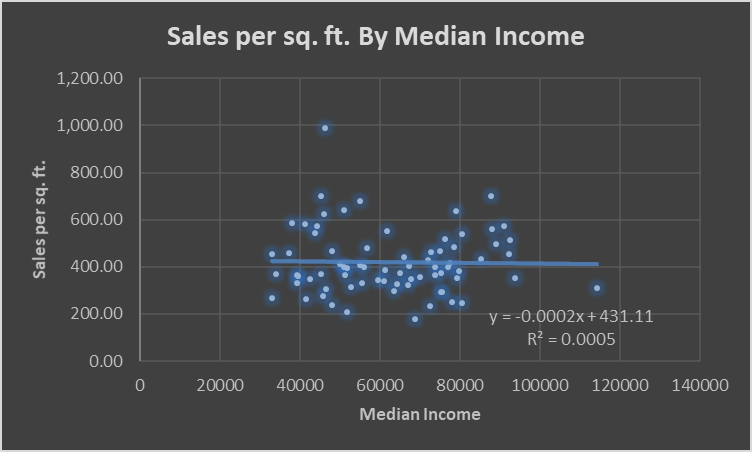
Figure 3 above demonstrates that there was almost no correlation between median income in the area even though the trendline indicates an insignificant negative linear correlation. The trendline was very close to being parallel, which demonstrates that a constant-only model would have a similar coefficient of determination. Therefore, it was concluded that median income had no significant impact on sales per square foot. It was confirmed by the R2 coefficient, which was very close to zero.
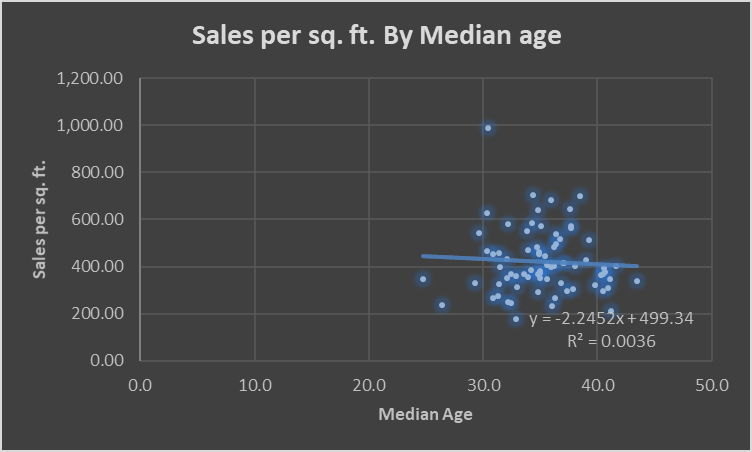
Figure 4 above demonstrates that there was almost no correlation between median age in the area even though the trendline indicates an insignificant negative linear correlation. While it should be acknowledged that the trendline had a greater angle in comparison with the median income, it was still concluded that the median age had no significant impact on sales per square foot. Moreover, R2 coefficient demonstrated that the model could explain less than 1% of the changes in sales per square foot.
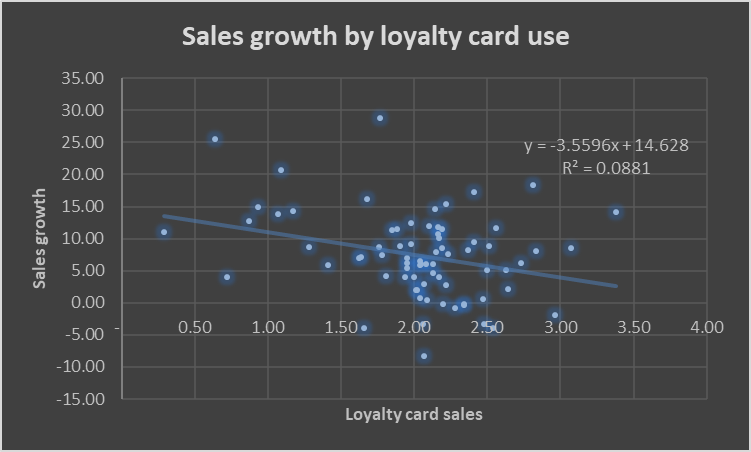
Figure 5 above demonstrated that there was a negative linear correlation between loyalty card sales and sales growth. Even though the relationship was relatively weak (R2 = 0.0881), it was considerable. The coefficient of determination state that the model could explain 8.8% of the changes in sales per square foot.
Recommendations and Implementation
The analysis demonstrates that the current expansion criteria is imperfect. In particular, median age and median income of people in the three-mile area appeared to have very little effect on sales per square foot, while the percentage of adults with a bachelor’s degree was a strong criterion. Therefore, it is recommended to avoid using median age and median income level as expansion criteria.
The analysis also demonstrated that the current loyalty card program is ineffective, as there was a negative correlation between sales growth and loyalty card sales. Therefore, the company needs to revise its current loyalty card program to avoid losses in revenues.
Conclusion
When selecting a target population for advertisements, it is recommended to target younger adults with higher level of education. This recommendation needs to be tested using surveys. Pastas R Us should randomly survey its customers asking about their education level, age, and how the marketing program affected their purchase decision. This would help to understand if more educated and younger adults were more likely to eat at the company’s restaurants.
References
Field, A. (2018). Discovering statistics using SPSS: North American edition (5th ed.). Sage.
Mariappan, P. (2019). Statistics for Business. CRC Press.
McClaive, J., Benson, G. & Sincich, D. (2018). Statistics for business and economics. Pearson.