Introduction
Background information
An accurate assessment of the concentration of dyes in food and beverages forms an integral aspect of consumer safety. Mutagenic effects stemming from high levels of concentration lead to cancer development. The determination of the concentration of dyes through spectrophotometric analysis provides an accurate method.
Objective
The lab report’s objective is to evaluate the concentration of pink dye (Powerade) in beverages based on the absorbance of red 40 as the standard curve. As the research question, what are the levels of absorbance and concentration do the pink dye in a beverage?
Variables and constants
The independent variable is the concentration of dyes, while the dependent variable is the absorbance of dyes. Measurable constants are wavelength, distilled water, and the concentrations of red 40. The standard curve is the positive control for the experiment that aid in evaluating the concentration of pink dye in a beverage.
Hypothesis
The hypothesis is that the concentration of dyes in beverages increases the level of absorbance. According to Beer-Lamberts law, the concentration of a solution has a positive relationship with the degree of absorbance (Vitha, 2019).
Experimental Procedure
Stock solutions of red dye, distilled water, cuvettes, test tubes, pipette, spectrophotometer, and beverage were materials for the experiment. To evaluate the concentration of pink dye in the beverage, a stock solution of the red 40 with a concentration of 4.0 × 10⁻⁵ uM was used. The optimum absorbance of the red dye was determined by measuring the absorbance at different wavelengths, ranging from 400 nm to 705 nm. Five solutions of the standard curve were made by adding 0 ml, 2 ml, 4 ml, 6 ml, and 8 ml of distilled water into 10 ml, 8 ml, 6 ml, 4 ml, and 2 ml of stock solutions, respectively. At the wavelength of 505 nm as the optimum level, the absorbance of each food dye solution was measured and the results tabulated with respective concentration values. The calibration curve was created by plotting a scatter plot of absorbance versus the concentration of the red 40 with a regression trend line showing the linear equation and the coefficient of determination (R2). To determine the concentration of the pink dye in the beverage, 5 ml of the sample was obtained, and absorbance was measured at the wavelength of 505 nm and recorded. The standard curve created was used to determine the concentration of the pink dye in the beverage.
Data
Observations
Observations of the dilutions of the stock solution of red 40 show that the intensity of the color decreased as the dilution factor increased. Moreover, the trend of the absorbance values decreased as the concentration of the red 40 diminished. Therefore, these observations are in line with the Beer-Lambert law of the relationship between concentration and absorbance.
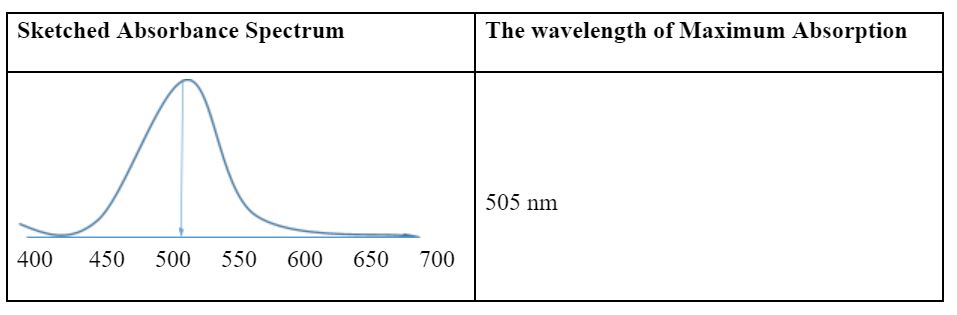
Table 2: Volumes of red 40 solutions and distilled water used in each test tube
Analysis of Results
Table 3: Absorbance of respective concentrations of red 40
Sample Calculations
C1V1 = C2V2
C1 = 4.0 × 10⁻⁴ µM
V1 = 10 ml, 8 ml, 6 ml, 4 ml, and 2 ml
V2 = 10 ml
For example, 8 ml of red 40 and 2 ml of water has the following concentration
C2 = 4.0 × 10-4 µM × 8 ml/10 ml = 3.2 × 10⁻⁴ µM
Graph
Regression equation:
Absorbance = 1725(Concentration of dye) + 0.428
Coefficient of determination (R2) = 0.9644
Table 4: The concentration of food dye in the beverage
Based on the regression equation, the concentration of the pink dye with the absorbance of 0.67 was determined
Absorbance = 1725(Concentration of dye) + 0.428
Concentration of pink dye = (0.67– 0.428)/1725 = 0.242/1725 = 1.403 × 10⁻⁴ µM
Discussion
The experiment demonstrated that spectrophotometry offers an accurate method of evaluating the concentration of pink dye in beverages using absorbance values in the standard curve of the red 40. Qualitative evidence shows that the intensity of the color of the dye increases with a rise in the degree of concentration. Moreover, the values of the concentration had a direct relationship with the absorbance level of the dye at a wavelength of 505 nm (Table 3). As quantitative evidence, the standard curve demonstrates that the concentration of the red dye has a positive relationship with the degree of absorbance (Figure 1). This evidence supports the Beer-Lamberts law because they indicate that concentration and absorbance have a positive relationship (Vitha, 2019). In essence, concentration is a significant factor that determines the degree of absorbance in various solutions.
The analysis of the experiment shows that it generated valid findings, which demonstrate that the concentration of dyes is a predictor of absorbance. A cause-and-effect relationship exists because the concentration of dye is an independent variable, while absorbance is a dependent variable. The experiment was valid because it ensured that the two constants of wavelength and blanking with distilled. Since the wavelength of 505 nm is the optimum value, its change would reduce the sensitivity of spectrophotometry and causes under-estimation or over-estimation of absorbance values. By using distilled water as a blanking solution, the experiment ensured that the spectrophotometer generated accurate findings (Rifai et al., 2019). The use of a different solution in blanking would have distorted the spectrophotometric readings. For instance, a blanking spectrophotometer with a solution would decrease its sensitivity to dyes with low concentrations. Hence, the measurement of the absorbance at 505 nm and blanking with distilled water guaranteed the validity of the experimental findings.
The collected data indicated that the experiment had a high level of reliability because the results were consistent. The absorbance values had a narrow range of 0.58 with a maximum value of 1.1 and a minimum one of 0.52. This narrow range and the small values measured imply that the scale of measurement is insensitive to minor changes in the level of absorbance. The trend line indicates that the values of absorbance obtained are reliable because they did not deviate significantly from the average values. Furthermore, the trend line obtained is in tandem with the Beer-Lamberts law of the positive relationship between absorbance and concentration of solutions.
A possible source of an error in the experiment is the preparation of dilute solutions from the stock solutions. Over-dilution of the stock solution would result in the preparation of solutions with lower concentrations than expected. In contrast, under-dilution of the stock solution would lead to the preparation of solutions with a higher concentration than expected. Overall, inaccuracies in the preparation of solutions cause over or underestimation of absorbance and, subsequently, prediction of concentrations of solutions (Rifai et al., 2019). Another possible source of error is the calibration of the spectrophotometer. An accurate calibration requires the use of distilled water in blanking the spectrophotometer to provide a valid reference point. However, blanking with other solutions would cause an error since the presence of solutes distorts the calibration process and affects the accurate measurements.
As an improvement to future experiments, increasing the number of dilutions in each test tube would improve the validity and accuracy of the trend line and regression model in predicting the influence of concentration on absorbance. Furthermore, the addition of another dye is essential to act as a positive control for comparative purposes and validation of outcomes.
Summary
The experiment demonstrated that concentration accounts for 96.44% of the variation in the level of absorbance in solution. The pink dye in the beverage was estimated to have a concentration of 1.403 × 10⁻⁴ µM, which is within the normal range of the standard curve. Results of the experiment connect to the real-world problem of estimating the amount of starch or sugar in various foodstuffs.
References
Rifai, N., Horvath, A. R., Wittwer, C., & Tietz, N. W. (2019). Tietz fundamentals of clinical chemistry and molecular diagnostics. Elsevier Health Sciences.
Vitha, M. F. (2019). Spectroscopy: Principles and instrumentation. John & Wiley.