Introduction
Population is a very important variable to study and understand as everything that we do is centered at people and therefore, to understand the needs, aspirations and also to fulfill the same it is very useful to have a very good understanding of head count. The world is divided in many countries and therefore, it is useful to have information about relevant statistics on population across different countries.
Life expectancy, literacy rate and per capita GDP are very good indicators of quality of life in a country and therefore, these variables should be studied in detail and understood well. Besides, it is only natural to expect that there should be some kind of relationship between literacy rate and per capita GDP. From instinct it comes that a higher literacy rate should lead to a higher per capita GDP and also to a higher life expectancy. These can be confirmed by appropriate statistical analysis procedures.
In this study, descriptive statistics tool of MS Office Excel will be used to understand relevant statistical attributes of data on population of different countries and correlation analysis will be performed to examine relationship between variables like literacy rate and per capita GDP and literacy rate and life expectancy. These analyses are present in subsequent sections.
Descriptive Statistics on Population Data
The data (AISE_cia_global_demographics_data_set_13e-1) on population, area, life expectancy, literacy rate, per capita GDP etc of 62 large countries was used for this statistical analysis. The descriptive statistical analysis was performed on the variable population. This analysis was performed using MS-Office Excel. For this Descriptive Statistics option from Tools menu was selected and the population data range was provided as input. The output of descriptive statistical analysis from MS Office Excel is presented in Table 1.
It can be seen from this table that mean population of the countries is 72.6 million, while the median population is ~ 12 million. This implies that the population data is positively skewed as obvious from the high values of Kurtosis and Skewness. The large gap between the mean and the median also points towards a large scatter in the data which is supported by very large value of the standard deviation, which is ~ 207 million. What this means in plane English is that there are huge differences in population of different countries in this world and this is true as we all know that just two countries India and China hold approximately one third of the world population and the Asian countries have very high population densities. This has come out very clearly in the value of Range, which is ~ 1273 million. This analysis shown great disparity in population distribution across different countries.
Table 1: Descriptive Statistics on population of different Countries
Correlation Analysis between Literacy rate and per capita GDP
Literacy rate is a measure of quality of life in a country. This says the percentage of people in a country who can read and write. A high literacy rate means more people can read and write and this in turn improves their employability. An increased employability is expected to increase their productivity and hence will lead to higher per capita GDP. But there are other factors as well which affect per capita GDP of a nation, besides the literacy rate. Therefore, one need to examine the relationship between these variables using suitable statistical analysis and this is done using correlation analysis. In this analysis, the correlation coefficient between a pair of data set is calculated using Pearson’s formula which is given below.

Where x and y are two variables and r is correlation coefficient between these two variables. Values of correlation coefficient lie between -1 to +1. Values of correlation coefficient r near +1 imply strong positive correlation, while those near -1 imply strong negative correlation and values near zero imply no correlation.
In this case, the value of correlation coefficient was calculated using MS-Office Excel – Correl function, which uses the same Pearson’s formula described above. The value of correlation coefficient (r) between literacy rate and per capita GDP is 0.57. This implies there is positive correlation between literacy rate and per capita GDP of a country; however, this correlation is only moderate and not very strong as the per capita GDP of a country is affected by other variables – like natural resources, industrialization etc. as well besides, the literacy rate.
The scatter plot between literacy rate and per capita GDP of different countries is presented in Fig 1. The linear trend line is also imposed on this scatter plot to show the trend between these two variables.
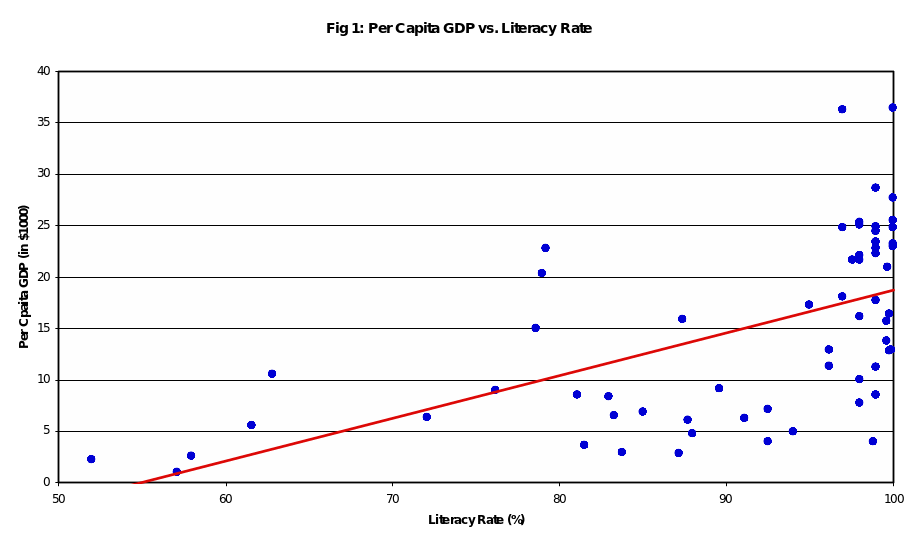
One can clearly see the uptrend in the trend line. This implies that per capita GDP of increases with increasing literacy rate. This finding can be useful for the poor Asian countries, where literacy rate is low and poverty is prevalent. If these countries increase spending on education then there per capita GDP will also increase leading to reduction in poverty.
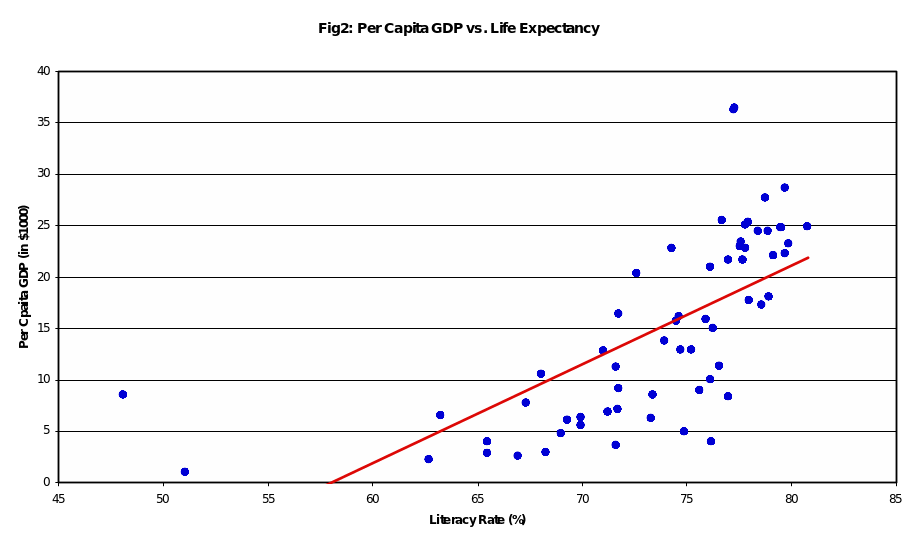
If higher literacy rate is expected to increase income (per capita GDP) then higher income should lead to better living conditions, good food, good medical care and finally higher life expectancy. To confirm this statistically correlation analysis was performed between per capita GDP and life expectancy using MS-Office Excel. The value of correlation coefficient (r) came to be 0.67. This implies positive correlation between per capita GDP and life expectancy. This means people in rich countries live longer. This is quite natural as rich people can afford to spend more on good quality food and health care which will in turn increase life expectancy of people. The scatter plot between these two variables is presented in Fig. 2 and the imposed trend line on this scatter plot is also sloping upwards implying positive correlation between these two variables.
Conclusions
Based on descriptive statistical analysis on the population data of different countries on this globe, it can be concluded that there is vast disparity in population across different countries as indicated by very high value of range and standard deviation and also by the huge difference in mean and median of the population. Based on correlation analysis performed in this report, it can be concluded that positive correlation exists between literacy rate and per capita GDP of a nation and also between per capita GDP of a nation and the life expectancy. This means education leads to increased income, which in turn leads to longer life.