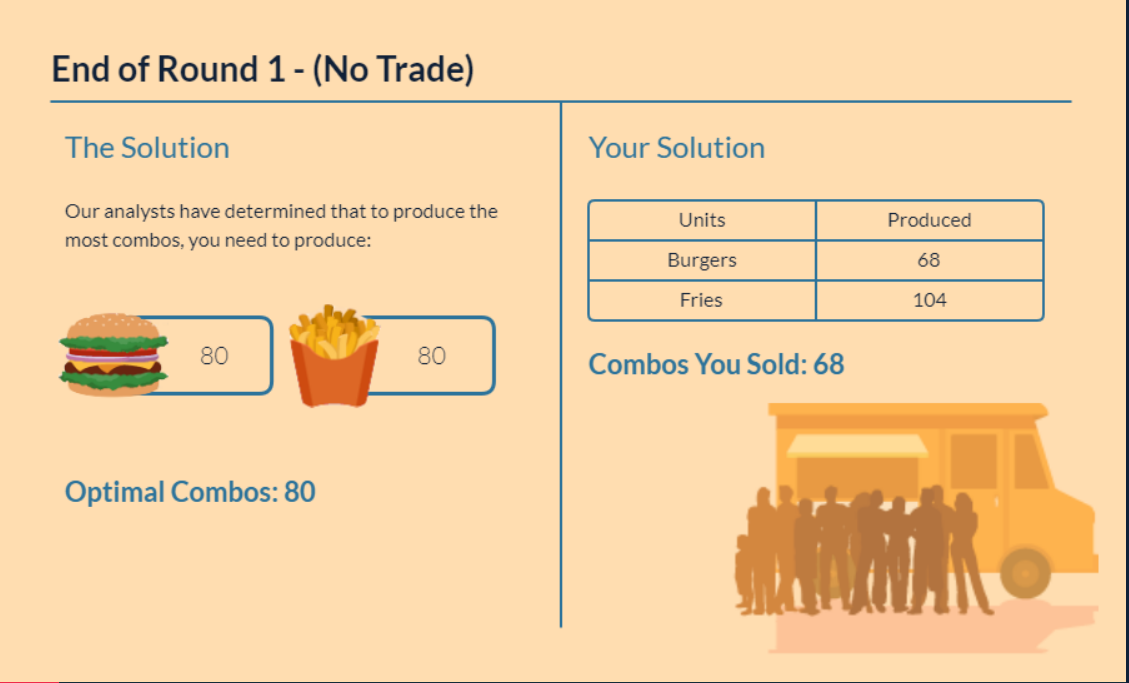
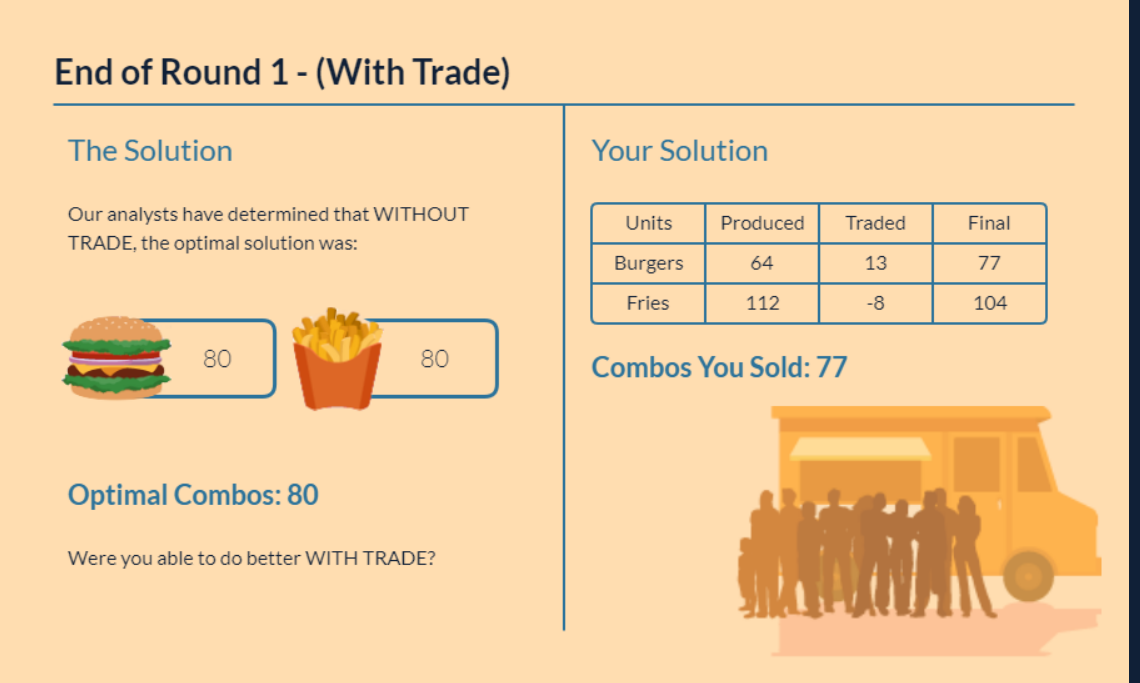
Understanding a company’s opportunity costs is crucial for identifying the optimal course of action in terms of investments and funding. The evaluation of opportunity cost would necessitate comparison of the costs and benefits accruing from each action made versus alternatives. The simulation depicted in Figures 1.1 and 1.2 compares the manufacturing volume of hamburgers and french fries. In the absence of an additional burger, the graph depicts the number of additional fries that might have been cooked.
Examining the rate of return and the risk associated with an option is crucial. However, some elements, such as market valuations and the firm’s risk appetite, must be addressed. Given the rate of return, the organization would compare the costs and benefits of employing stock against debt. In addition, it may require deciding whether to reinvest current cash or purchase new equipment. In each instance, it is essential to determine the incremental advantages of one option over another.
Comparative advantage provides the capacity to generate products and services at lower opportunity costs than competitors. Therefore, the company will only deal in items with a comparative advantage. In examining comparative advantage, a corporation will evaluate its capital and labor resources to work more effectively than rivals. The company must recognize its distinctive advantages, such as a ready market, swifter manufacturing capacity, or lower operating expenses. Each company’s PPF graph has a unique curvature; hence, each company has a competitive advantage in producing particular items. For this reason, it is advantageous for the company to make items in its area of expertise.
When a company concentrates on things with a comparative advantage and trades its production for the remaining commodities, its overall output rises. In addition, the PPF enables the company to assess the optimum trade choices accessibly. When the potential cost of manufacturing a commodity is lower for a company, the company should be able to produce the item optimally, given its available resources and production capabilities. On the other hand, it is prudent to trade-off for non-specialty items. This guarantees that the company does not lose money by producing things with no competitive edge. Trading off reduces losses that would have been incurred if the company had produced a non-specialized commodity.
Competitive Markets and Externalities
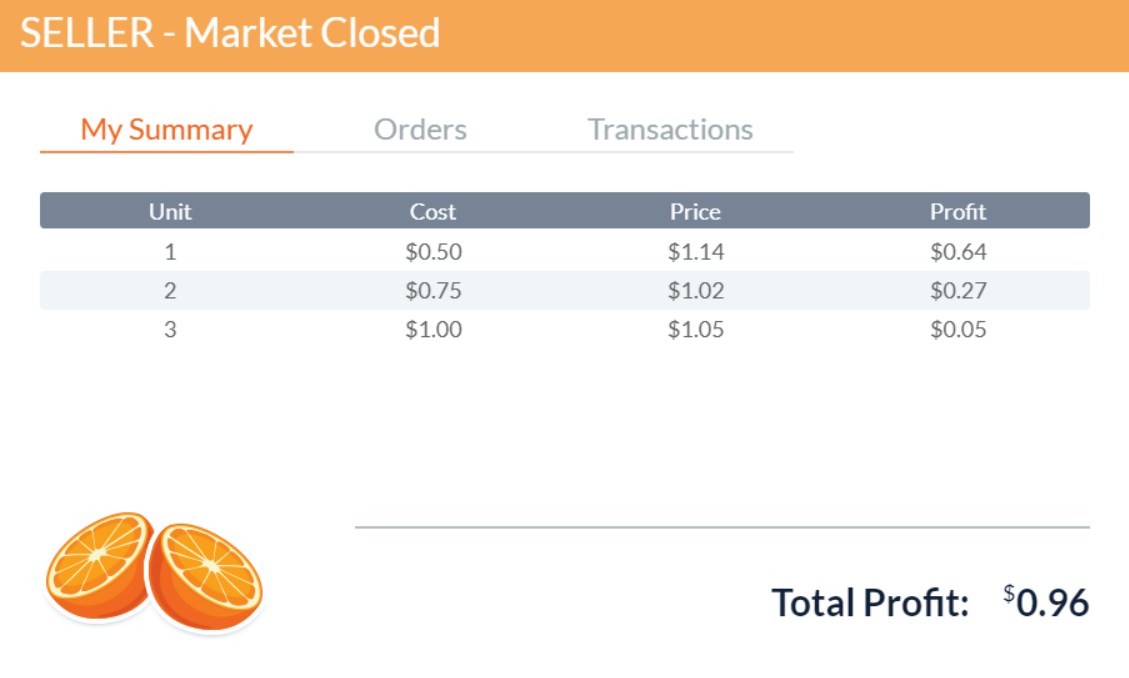
An equilibrium price in economics is one at which sellers are ready to sell, and buyers are willing to purchase; demand and supply are equal. Policy interventions aim to improve market equity via rules, maximize social welfare, and even advance diverse goals such as national unity. A commodity’s equilibrium of supply and demand will be impacted by interventions such as price regulation. As shown by the simulations, a seller’s price is lower if a charge is paid, raising the buyer’s cost of ownership regardless of the existing laws. In the long term, this implies that consumers will pay a higher price for goods, and retailers will earn more money. The supply curve shifts to the left due to policy intervention, including an increase in a commodity’s tax, resulting in higher prices for purchasers and lower prices for sellers. Price ceilings limit the prices charged for a product or service.
The availability of replacements affects a product’s price elasticity of demand; this is a determinant of the price elasticity of demand. Both short- and long-term timelines are crucial for assessing the efficiency of a pricing shift. In the near term, consumers may be able to endure an inelastic price increase. However, based on the simulations customers would buy less given that the price is high. Customers will be more amenable to price increases in the long run as they become more aware of price hikes (Mankiw, 2021). The second factor is survival requirements whether the item is necessity or a luxury. The number of replacements constitutes the third factor. Thus, the market price would be impacted by a significant number of replacements (Mankiw, 2021). As a result of the simulation, which considered oranges to be elastic as their price increased, the total number of units decreased, impacting the total income. Moreover, individuals would pay a higher price for oranges during a scarcity.
One of the market interventions is price control, which refers to reducing the market’s power to determine prices in favor of legislative regulation. Businesses may restrict how a product or service can be priced using interventions such as price floors. Typically, the government sets prices for products and services to protect the individuals who produce and offer them. Price ceilings below the equilibrium price are not binding. Yes, there is a producer surplus when an intervention such as price floors are implemented. In the simulation, as the price of a oranges increases, there will be less demand and more supply, leading to a producer surplus.
Production, Entry, and Exit
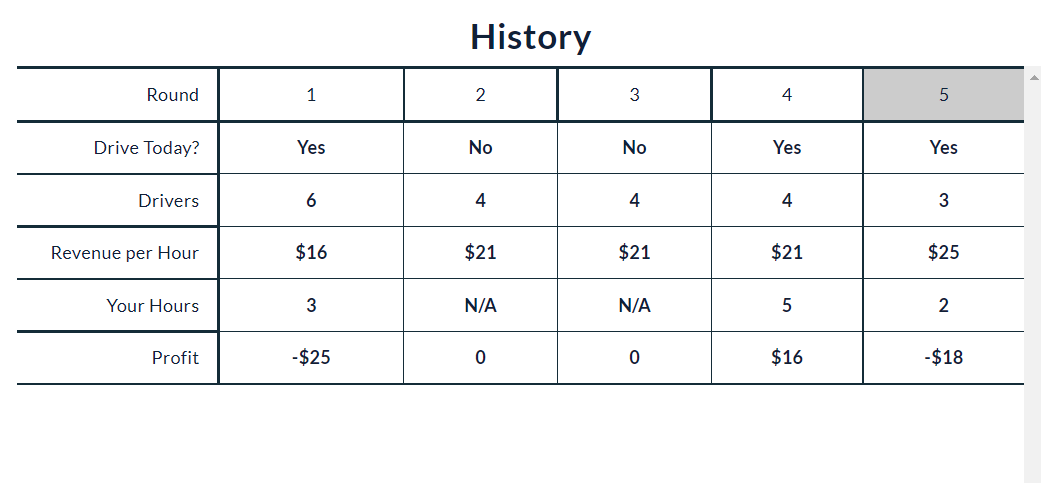
Using the model of cost and benefit linked with the company acquisition helped me decide whether to enter or exit the driving industry. Finding the minimal total average cost is essential when sizing the business location. This will assist in selecting the most effective company sizing upon entry and assess current output efficacy. Likewise, identifying the optimal times to drive and the number of other drivers on the road would assist optimize earnings per hour and each driver. Thus, in this case it is possible to enter the market in consideration of the low cost and higher profits.
A company’s marginal expenses directly impact profitability and production. If the company operates in the services industry, it is possible that the driver estimated marginal cost by analyzing the actual cost of delivering a single service and deriving the above figures. For example, the marginal cost remains low if one more person produces one additional service.
A cost that remains constant regardless of the revenue earned is known as fixed cost. It does not matter what kind of manufacturing one is doing in regards to the price of installation. Space and equipment utilization refers to increasing output by employing more workers for a one-time expense. For example, rent and water bills are both sets, regardless of output volume. While short-term changes in production may be modest, there may be long-term increases in space, workforce, and equipment. In accordance with the ATC model, the long-term average total cost will grow marginally, whereas the average fixed cost per unit of productivity will decrease.
Market Structures
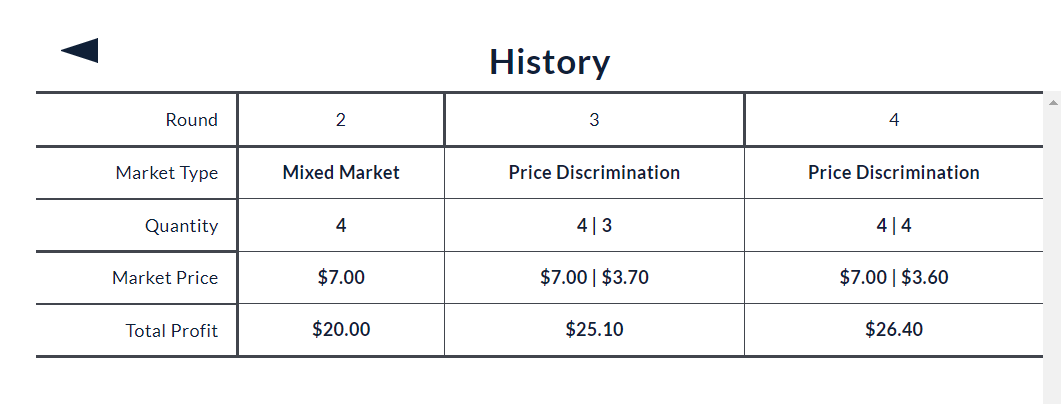
There will always be a market for products in demand, regardless of their price. Microsoft’s operating system monopoly is pervasive inside the software industry (Dabara et al., 2018). As a result of market dominance, this might result in rising prices and scarcity. Because marginal prices are lower than market prices, this market is inefficient. Certain products and services are inaccessible due to their excessive prices. This modification would result in a rise in output. Monopolistic competition and monopolies are inefficient because they need prices that exceed marginal costs.
In a market characterized by oligopoly, the price setters have greater influence than the price takers. This company’s profit margins are greater since it encounters less competition. Instead of depending on the free market, price fixing permits companies to establish pricing to their benefit. Due to increased competition for scarce resources, market prices have decreased. In this market, the quantity of stores providing a product for sale affects its price (Dabara et al., 2018).
Perfect market competition – several tiny businesses compete against one another. In this instance, a single company lacks sufficient market dominance. Since none of the companies may affect the market price, the industry as a whole produces the optimum amount of goods (Dabara et al., 2018). Monopolistic Competition refers to a market in which several small businesses compete against one another. However, unlike in a market with perfect competition, businesses in monopolistic competition offer comparable items with minor distinctions (Dabara et al., 2018). This provides them with some market power. This enables them to modify the higher process within a certain range. Oligopoly is a market structure in which a limited number of enterprises dominate. This leads to restricted competition where companies will either compete with one another or cooperate (Dabara et al., 2018). By doing so, they may use their combined market power to increase prices and increase their profits. A monopoly is a market arrangement in which one company dominates the whole market. In this scenario, the company would have the maximum amount of market power, since customers had no other product options (Dabara et al., 2018). Typically, monopolies limit production in order to raise prices and boost profits.
Conclusions
In conclusion, microeconomics is beneficial to the study of the economy’s actual operation. The operation of an economy is very complex and difficult for a layperson to comprehend. However, microeconomics enhances comprehension of the economic system. It provides the instruments essential for the proper design of different economic policies. In the future venture, microeconomic concepts should be used as guidance for critical internal company management.
References
Mankiw, N. G. (2021). Principles of microeconomics (9th ed.). Cengage.
Dabara, D. I., Omotehinshe, O. J., Chiwuzie, A., Asa, O. A., & Soladoye, J. O. (2018). The market structure of real estate investment trusts in Nigeria. In Conference of the International Journal of Arts & Sciences, 11(3), pp. 101-112.