According to Gowland (2007), monetary policy refers to the process that is used by governments through central banks in regulating the amount of money supply within the economy. This is undertaken by regulating the rates of interest. Depending on the economic conditions in a country, the government can conduct an expansionary monetary policy (Uhlig, 2005, p. 384). As a result of this, demand for finance from financial institutions is reduced. This makes it possible for investors to obtain finance from financial institutions since the cost of capital is relatively low.
To check if the interest rates are certainly too low, 2 steps are supposed to be taken. First, if the policy of a central bank’s rate is way too low, it should be low relative to some benchmark. “Though, no universally accepted benchmarks exist, a popular tool is Taylor’s rule. For example, in Monetary Trends, the Saint Louis Federal Reserve publishes the federal funds rate according to its version of Taylor’s rule” (Taylor 2003). Otmar, a previous associate of the managerial body of the European Central Bank, has shown that, “the Taylor rule has become quite important for1 us because it gives us guidance for the stance of the monetary policy.”
Orphanides (2007) explains that, an existing governor of the European Central Bank, has asserted that Taylor’s rule offers “a useful framework for the analysis of historical policy and for the econometric evaluation of specific alternative strategies that a central bank can use as the basis for its interest rate decisions.” Again, “a review on the minutes of the Federal Open Market Committee from 1993-2001 shows members regularly referred to estimations of Taylor’s rule when discussing monetary policy” (Orphanides 2007).
Consequently, Central Banks in the US and Europe as a whole have based on Taylor’s rule to update them on monetary policies. This version used by Saint Louis Fed is shown as; “ft = 2.5 + πt-1 + 0.5(πt-1 – π) + 0.5yt-1 (1)where f is the target for the federal funds rate (monetary policy rate) π is the inflation rate π is the desired rate of inflation y is the output gap” (Orphanides 2007).
In recent times the global economic downturn has given rise to the sub-prime crisis in the United States with speedy infectivity worldwide. “This has attracted the attention of academics, policymakers, and economic agents at large, to the developments in the housing sector” (Stock, 2003). Stock shows that housing prices are guiding indicators for real action, inflation, or both. It can also act as a gauge showing where the real economy is going.
Proof in current literature displays a strong connection between the housing market and monetary policies in the United States. Moreover, “the recent emergences of boom-bust cycles in house prices have been an issue of concern for policymakers” (Iacoviello, 2005). Again this is because “the bust of the house prices bubble is always followed by significant contractions in the real economy” (Iacoviello, 2005). With this fact, central banks must examine comprehensively the effects of the monetary policy on housing prices in general or particularly real estate. It would in turn, “lead to the understanding of the effects of monetary policy on the economy at large” (Strauss, 2007).
Moreover, the current literature gives proof of the fact that “numerous economic variables are potential predictors of house price growth” (Watson, 2004). Intuitively, an approach by the FAVAR “boils down to extracting a few latent common factors from large matrixes of many economic variables. The former maintains the same information contained in the original data set without running into the risk of the degrees of freedom problem” (Watson, 2004).
As shown by Carlino (2000), the incentive to use local data originate from, “the fact that the impact of monetary policy on the US economy differs according to regions since economic conditions prevailing during a monetary policy shock are not necessarily the same across the regions”. Again, it must be clarified that even if this was among the first studies to examine effects of monetary house price policy. “Inflation in the United States economy using a FAVAR model, by no means is this current study the first one to analyze the impact of monetary policy on house prices” (McCarthy, 2002).
Nevertheless, all available research has a foundation on “either a reduced-form Vector Autoregressive (VAR) model, a Vector Error Correction Model (VECM) or a Structural VAR (SVAR) model, which, in turn, limits them to at the most 8 to 12 variables to conserve the degrees of freedom” (McCarthy, 2002). Debatably, and as shown here, there is a big number of variables affecting the monetary house price policy (Minetti, 2007).
All of these should be incorporated as not counting on them, frequently leads to confusing results which are not in line with economic theories. This is because of minimal sets of information. Furthermore, in all the done, the instigators often randomly acknowledge specific variables as the corresponding theoretical constructs. A good example is “the gross domestic product as a measure of economic activity or the first difference of the logarithm transformed consumer price index as a measure of inflation, which, in turn, may not be perfectly represented by the selected variables” (McCarthy, 2002).
In addition to this, preceding research can only get hold of the “impulse response functions from those few variables included in the model, implying that in each VAR, VECM or SVAR, the IRFs are typically obtained concerning only one variable related to the housing market” (McCarthy, 2002).
Monetary policy shocks significantly contributed to the current subprime mortgage crisis. Over the past few years, US monetary policy has been expansionary. The monetary policy has been inclined towards the loose as compared to the’ tight’ (Eickmeier & Hofmann, 2009, p. 21).
Meanwhile, Eickmeier & Hofmann (2009) said that expansionary/ loose monetary policy is one of the reasons why the US experienced a housing boom during the period ranging from the early 2000s to the mid-2000s.
Loose monetary policy results in an expansion in various economic sectors. Various sectors in the US housing industry witnessed rampant growth during the period ranging from 2000 to 2004 as a result of the loose monetary policy adopted by the Federal Bank (Eickmeier & Hofmann, 2009, p. 19). Some of these sectors include the sale, resale, and construction of residential properties. This arises from the fact that investors could be able to access finance from financial institutions and invest in the housing sector. For instance, as a result of loose monetary policy in the US, the commercial banks expanded their businesses.
A lot of the current studies on the behavior of housing prices go before the current crisis involving inquiries trying to find out if housing prices were too pricey relative to essentials. OReilly (2006) studied housing price behaviors from 1985 to2006. He found that:
A model based on disposable income and interest rates accurately described housing prices for most of the period, but divergence began in 2002, implying the possible emergence of a housing price bubble. He found that much of the increase in housing prices from 1992 to 2006 can be explained by demographics, increased disposable income, very low-interest rates, the tax treatment of housing, and increased purchases of houses for investment purposes. He estimates that housing prices were overvalued by between 20 and 40% at the peak in 2005 (OReilly, 2006).
Maza (2003) on the other hand says that “the relaxation of credit constraints, evidenced by the growth in housing loans and declines in nominal mortgage rates, account for a substantial portion of house price growth”.
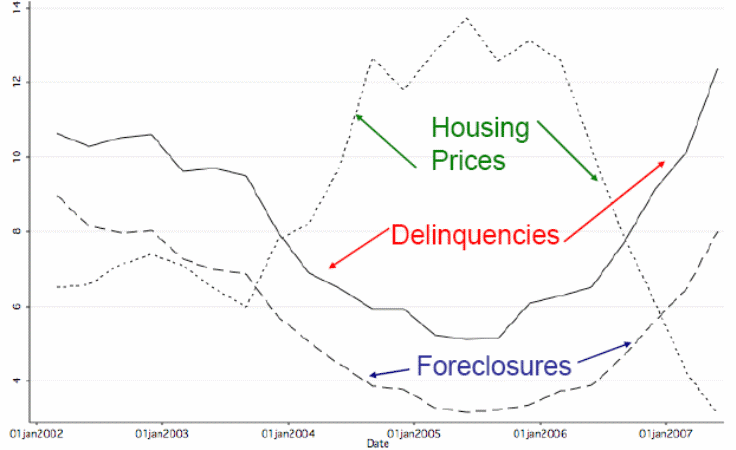
According to Swan (2009) in the United States, the situation in the housing industry was made worse by government programs (expansionary monetary policy) which were aimed at promoting homeownership, p. 125). The graph below illustrates a sharp increase in the rate of inflation within the US housing industry from 2003 to 2006. This was followed by a subsequent decline. During this period, foreclosure and delinquency rates were inversely related. Upon the rise in house prices, there was a decline in foreclosure and delinquency rates.
Increased liquidity led to the housing bubble which culminated in the housing industry collapsing. The low rate of interest stimulated demand for investing in the housing sector. This arises from the fact that investors considered it a potential investment destination after a decline in the rate of interest applicable to treasury bills which were considered as safe investments. In their investment decision, investors integrated the concept of high-risk high return (Swan, 2009, p. 125).
Other studies by Hubbard (2009) investigated the universal nature of the housing fizz. The research examined the quick increase in housing prices that took place in the United Kingdom, and the US. Hubbard (2009) concluded that “rising real estate prices cannot be explained solely by increased economic growth or lax regulation in a particular country. He cited speculation by purchasers as playing key roles, particularly late in the boom on housing prices in countries”.
Significantly, he found out that the alteration in interest rates was significant in the United State’s housing explosion as well as in many other countries. Thus, even though other aspects are cited in specific investigations, the previous study’s common thread encompasses interest rates and credit accessibility. This plays an important role in defining the performance of housing prices (Rapach, 2007). Again it takes us to the question as to which particular function they took part in the housing bubbles realized in various countries from the year 2000.
There are 3 kinds of empirical effects attached to the relationship between monetary policy and house price. The first one gives proof of the relative significance of national against regional shocks in compelling movements in the price of houses across the United States in 20 years and more. Research has it that “there is a large degree of heterogeneity across states regarding the relative importance of the national factors. Generally, the historical movements in housing prices are mainly driven by local factors that are either regional or state-specific” (Oreilly, 2006). In the second set, the results show proof of some difference in the results in this regard.
Even if the local aspects have remained significant, the rise in house prices that took place in many states in the last few years is largely determined by national factors. Given the significance of national factors, there is a question as to “whether or not expansionary monetary policy lies behind the recent national housing boom. Specifically, monetary policy shocks are identified using a VAR with sign restriction, which investigates their impact on house prices” (Oreilly, 2006). It is also evident that the effect of monetary policy on the housing boom is non-insignificant and minute about the dimension of the housing boom.
On the other hand, in the existence of liquidity restrictions, current proceeds rather than permanent ones together with nominal rather than real interest rates play a major role in defining credit growth. “It is again worth noting that asymmetric information problems imply that borrowing capacity is affected by changes in house prices since they determine the collateral available for bank lending” (Oreilly, 2006).
The accessible empirical proof verifies that the interest rates are key variables to elucidating credit growth. Watson (2004) explains that:
Determinants of household borrowing are estimated by a single-equation error correction model. He finds the long-term equilibrium level of household borrowing is negatively related to nominal interest rates. Unemployment is again positively related to spending. As for the short-term dynamic of household borrowing, the specification includes, among other variables, housing wealth and the error correction term. The evidence reported suggests that one of the main drivers of household debt between the mid-1990s and the beginning of the 2000s is the interest rate (Watson, 2004).
Watson (2004), also approximated a Vector Error Correction Model (VECM) where “consumption and household borrowing are modeled jointly. The results show that both consumption and borrowing are positively related to financial or housing wealth and labor income in the long term and negatively related to nominal interest rates”. He further analyzes house prices determinants in the US by employing single-equation error correction models that allow the distinction between temporary and long-standing equilibrium. “Interestingly, he found out that, when the parameters of the model are unrestricted house prices are only determined in the long run by income, with interest rates playing no role at all” (Watson, 2004).
Both the limited and the unlimited models propose that a big fraction of the rise in house prices from 1997 to 2002 can be elucidated by alterations in essentials. As explained by (Watson, 2004):
He finds that the expansionary behavior of house prices also reflected an adjustment towards their long-term equilibrium level. This is because since the mid-1990s houses were somewhat undervalued. In the same way, by 2002 prices had increased beyond what was needed to restore their long-term equilibrium level leading to an overvaluation between 8% and 17%. This again was compatible with the normal short-term dynamic adjustment of the housing market (Watson, 2004).
In this setting, this paper examines the effect of monetary policies on house prices in the United States by looking into a research-rich setting. The paper will look into, monetary authorities while analyzing their decision-making methods.
References
Carlino, H. (2000) The impact of monetary policy on the US economy. Journal of monetary policy, 7(2), pp. 54-74.
Hubbard, D. (2009) Economic effects on the house price. International journal of Economy, 94 (9), pp. 433-436.
Iacoviello, M. 2005. The bust of house prices. New York, NY: Oxford University Press.
Maza, D. (2003) Housing price and credit constraints. International journal of economy, 5 (12), pp. 132-165.
McCarthy, J. (2002) The economy and house price growth. International journal of economy, 3 (7), pp. 64-87.
Minetti, R. (2007). The Credit Channel of monetary policy: Evidence from the Housing Market. Journal of Macroeconomics, 30 (1), pp. 69-96.
Oreilly, B. (2006) monetary policy and housing price behavior. New York, NY: McGraw-Hill.
Orphanides, M. (2007) The Taylor’s rule. Boston: Houghton Mifflin
Stock, M. (2003). Monetary policies and the housing sector in the US. American Economic journal, 2(4), pp. 142-187.
Rapach, D. (2007) Forecasting Real Housing price Growth. Regional Economic Development journal. 3(2), pp. 33–42.
Strauss, J. (2007) Effects of monetary policies on the economy. Economic review journal, 5(8), pp. 67-81.
Taylor, G. (2003) Federal Funds. Philadelphia: Open University Press.
Watson, D. (2004) The economy and house price growth. International journal of economics, 2 (1), pp. 214-254.