Introduction
Risk is a term widely used in different contexts and different disciplines of knowledge. This is perceived in many different manners in different subjects. In probability, this is defined as the product of an event multiplied by negative impact (quantum of loss) associated with that event. Thus it is a negative term and this is how it is treated i.e. risk is generally associated with the negative or undesirable consequences of an event. However in Statistics, risk is defined as deviation from mean and standard deviation is a useful measure of risk. Thus, statistically speaking, risk could be either positive or negative deviation and it may not always be harmful. Risk and its management play a big role in finance and industry. In the subsequent section the statistical perspective f risk in financial sector will be elaborated.
Statistical Perspective of Risk in Financial Sector
Investment is something everybody is aware of. It is an integral part of life. Almost everybody tries to save and invest the savings for future when he may not be earning to support his life style. What one wants from one’s investments is capital appreciation so that whatever he has saved from his hard earned money grows with time and he has a bigger sum of money to rely upon. One always wants a return higher than inflation. But whether the capital always appreciates? Not really, depending upon where the money was invested it may appreciate or even depreciate to the extent that it may disappear. Thus there is deviation from expected return and this deviation is what is termed as risk associated with an investment opportunity. Thus risk management becomes very important and one cannot afford to overlook it for the sake of higher return. So, how risk associated with an investment opportunity is calculated. It is done on the basis of historical data and longer is the period better is the risk estimation as this value is being extrapolated in future. Let us concentrate on the risk associated with Equity investing.
Equity is considered as the riskiest investment option. The returns may be fabulously high if right call is taken regarding selection of the business at right time and it may go down the drain if a wrong call is taken in terms of the business and time. To minimize the risk further what one does is diversification. What is done is that money is not invested in single scrip rather than a basket of scrip or an index is bought. This certainly minimizes the risk but cannot eliminate. Further risk minimization can be done by prolonging the period of investment. Let us take a typical index from a typical emerging market like India, China, Brazil etc. Let us take Sensex, which is the most popular index among those interested in investing in India. India, being a rapidly growing economy of decent size offers very good capital appreciation and this has attracted many investors. As equity is high risk – high return instrument; therefore, it is better that one remains invested for reasonably long time period and also tracks performance of an index over a long time period. Ten years can be considered as a reasonably long time period for this purpose. Return of Sensex during past ten years starting January 1998 has been presented in table 1 below. The data has been taken from finance.yahoo.com. One can find historical data for almost any index and scrip traded worldwide.
Average annual return (μ) is defined as (Grewal, 1999).

It can be seen that the average annual return is 23.5%; which is very good return. But this was not without three years of very high negative return (-16.5% in 1998, -20.7% in 2000 and -17.9% in 2001) and if one would have examined in further smaller time frames the negative returns would certainly have been much higher.
Now, how to calculate the risk? Risk is nothing but deviation from the mean and a good measure of this deviation is standard deviation. Standard deviation (σ) is defined as (Kreyzig, 1993).


= 33.6
The actual annual return and mean annual return is shown in the figure 1 below. This graph was generated using the data in table 1 above in MS Office Excel.
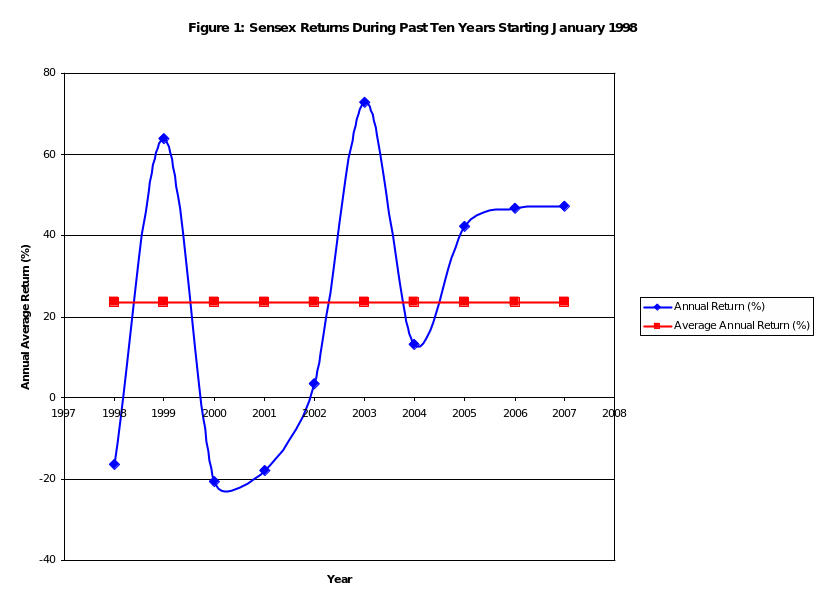
Form this figure it can be seen that there is very high deviation from the mean annual return and this deviation is what is known as risk.
Conclusion
It can be concluded that one cannot predict future and therefore, there is always a deviation from the mean or the expected outcomes. The deviation from the mean is the risk and this is best measured as standard deviation.
Reference
Grewal B. S. “Higher Engineering Mathematics”. Statistical Methods. Khanna Publishers, New Delhi. 1999. p 574.
Kreyzig E. “Advanced Engineering Mathematics”. Mathematical Statistics. John Wiley & Sons Inc. New York. 1993. p 1216. Web.