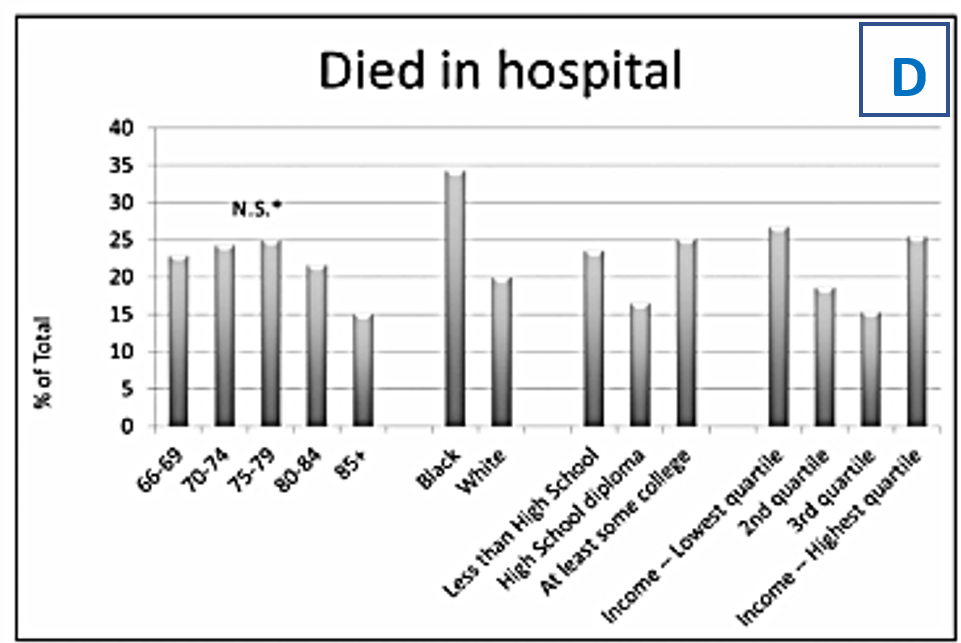
From the graph (see Figure 1), it is notable that a higher percentage of black individuals (35%) died in the hospital due to cancer compared to white individuals (20%). This means that a larger population of the black community suffering from cancer loses their lives while receiving treatment at the hospital. One of the contributing factors to this is the failure to provide suitable cancer care to the black community. For example, surgical resection is a cornerstone for patients suffering from colorectal cancer and breast cancer (DeSantis et al., 2019). Studies show that large black population-based women suffering from non-metastatic breast cancer were associated with the underuse of curative sections.
The case of patients suffering from lung cancer is another example of a disease curable if treated with resection. However, studies have reported lower rates of lung resection among blacks, even when presented as a control measure for a different cancer stage (Liu et al., 2021). Patients’ misconceptions about cancer and its treatment have adversely affected their willingness to accept surgery in the though that it might spread throughout the individual’s body. The black community is vulnerable to care by physicians who are less well-trained clinically and limited access to crucial clinical resources compared to the physicians attending to white patients. The data suggest increased deaths of black compared to white patients due to differences in medical beliefs and access to advanced cancer treatment methods.
Among the students who died in the hospital, the highest percentage was individuals studying in college, and the lowest were high school diploma students. In other words, students in college suffering from cancer are more likely to die in a hospital while receiving cancer treatment compared to other students’ education levels. College students are terrified of the effects of cancer-related treatments such as chemotherapy, which include hair loss that can be upsetting to them. For this reason, they become hesitant to receive the treatment and end up losing their lives. For example, 8863 college students died from cancer in the hospital in the year 2020 (Yoshida et al., 2019). The adversity impact of cancer treatment on the social life of college students is thus linked to greater loss of their lives.
The lowest quartile of individuals’ level of income recorded the highest percentage of deaths in hospitals, followed by the highest quartile, the second quartile, and the least percentage was recorded from the third quartile. This shows that individuals suffering from cancer with low income are more likely to die in the hospital compared to the other group’s level of income. This could be attributed to the fact that these individuals lack adequate funds to cater to the advanced cancer treatments, which are their only option for getting cured. In the instance of chronic lymphocytic leukemia, for example, the projected out-of-pocket expenditures for Ibrutinib will be approximately $700 per month for this first-line medicine over a 58-month time period (Yoshida et al., 2019). Therefore, patient access to advanced cancer drugs is limited by the relative costs of the treatment. The data set of the level of income suggests increased deaths at the hospital for the lowest quartile because cancer keeps on advancing, which means more capital will be needed to get access to them.
Table 1: Type of cancer per the level of education in Harris County
Table 2: Calculations and workings
The individual percentage entails the percentage of a single type of cancer affecting a particular group of students. The total percentage in this equation comprises the summation of all the percentages from the three types of cancer. 4,731,145 in the equation is the known population of Harris County residents provided in the question.
Table 3: Summary table of the actual population size for each cancer type per level of education

Representation Questions
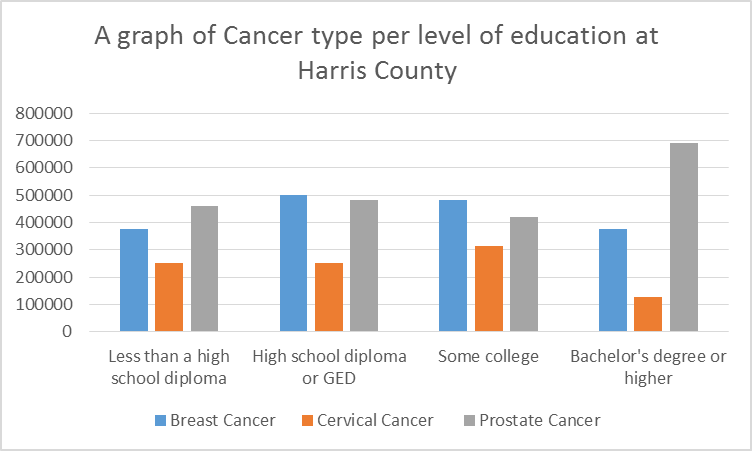
From the diagram above (see Figure 2), the x-axis represents the level of education of the individuals suffering from a given type of cancer. The unit used on this axis is the level of education per cancer type. The level of education, being the independent variable, is better represented on the x-axis because it has to show the three types of cancer and how they are distributed in the four levels of education. For example, at the high school diploma level, breast cancer appears to be the leading type of cancer affecting a large population, while cervical cancer affects the least population at this level of education. In the Bachelor’s degree and higher level, the dominating type of cancer is prostate cancer, while cervical cancer affects the least individuals at this level. The x-axis usually represents the independent variable, which means the variable has to be unvarying to fit on this axis (Sykes et al., 2018). Therefore, in this case, the level of education created is independent in that no variable can change these levels.
The y-axis represents the total population of the individuals residing in Harris town. The unit used for the vertical axis is the number in thousands. The total population is represented on the vertical axis because it is a dependent variable which means it can vary if the independent variable changes. For example, the population of the high school diploma level varies from the population of the individuals at the college level, but they both affect the total population. This means a change in the population of the school diploma level will affect the total population of the county.
Analysis Questions
In the four levels of education, individuals are greatly affected by prostate cancer, followed by breast cancer, and cervical cancer affects the least population. In other words, prostate cancer seems to be the dominating type of cancer in all four levels of education. The trend of this cancer is upward because as individuals go up to higher levels of education, the numbers increase of prostate-affected individuals increases. Like many other malignancies, prostate cancer becomes fatal when it spreads to other organs, and 90 percent of patients have evidence of bone metastasis at the time of diagnosis (Giaquinto et al., 2022). Understanding the elements of the bone matrix that prostate cancer may affect is well-established (Rogers et al., 2018). In order to understand how a successful and diverse metastasis can disrupt the bone growth environment and, in turn, drive metastatic development in a vicious cycle, it is necessary to understand the elements that characterize the normal bone environment of the prostate gland area.
Assumptions
The data provided in Table 1 represents the general population of the area; thus, there is a biasness of generalizing information. This means the findings are based on a sample of the whole population. For example, it is possible to transfer the finding of this study to another similar study. Therefore, it is difficult to test for the precision of the finding since focusing on one entity is likely to reduce the reliability of the other information. Another assumption is that the association between cancer to the level of education is dependent on each other. This means a change in the number of individuals with a certain level of education is going to affect the total population of individuals suffering from cancer.
References
Centers for Disease Control and Prevention. (2021). Obesity and cancer. Web.
DeSantis, C. E., Miller, K. D., Goding Sauer, A., Jemal, A., & Siegel, R. L. (2019). Cancer statistics for African Americans, 2019. CA: A Cancer Journal for Clinicians, 69(3), 211-233. Web.
Giaquinto, A. N., Miller, K. D., Tossas, K. Y., Winn, R. A., Jemal, A., & Siegel, R. L. (2022). Cancer statistics for African American/Black People 2022. CA: A Cancer Journal for Clinicians 0(0), 1-28. Web.
Liu, Y. Q., Wang, X. L., He, D. H., & Cheng, Y. X. (2021). Protection against chemotherapy-and radiotherapy-induced side effects: A review based on the mechanisms and therapeutic opportunities of phytochemicals. Phytomedicine, 80(1), 153402. Web.
Rogers, C. R., Rovito, M. J., Hussein, M., Obidike, O. J., Pratt, R., Alexander, M., Berge, J. M., Dall’Era, M., Nix, J. W., & Warlick, C. (2018). Attitudes toward genomic testing and prostate cancer research among Black men. American Journal of Preventive Medicine, 55(5), S103-S111. Web.
Sykes, B. L., Verma, A., & Hancock, B. H. (2018). Aligning sampling and case selection in quantitative-qualitative research designs: Establishing generalizability limits in mixed-method studies. Ethnography, 19(2), 227-253. Web.
Yoshida, Y., Schmaltz, C. L., Jackson-Thompson, J., & Simoes, E. J. (2019). The effect of metabolic risk factors on cancer mortality among blacks and whites. Translational Cancer Research, 8(4), 389-96. Web.