Introduction
Southwest Airlines Co is an airline company that operates in the United States of America. The company mainly focuses on short-haul and high-frequency travel (Ren, 2020). It also deals with point-to-point services and the low fares they provide to the consumers in the market (Ren, 2020). The symbol of Southwest Airlines in the NYSE stock market is LUV (Ren, 2020). Further, it represents the employee-customer relationship found in the Southwest region (Ren, 2020). This paper aims to explain and analyze the financial and trend ratios of Southwest Airlines and predict future financial performance. The paper discusses the trend analysis, explains the financial ratios, compares the ratios with competitor peers, and determines the return on equity. Through this analysis, it will become evident that Southwest Airlines will be viable over the next three years because of the debt ratio and profit margins.
Trend Analysis
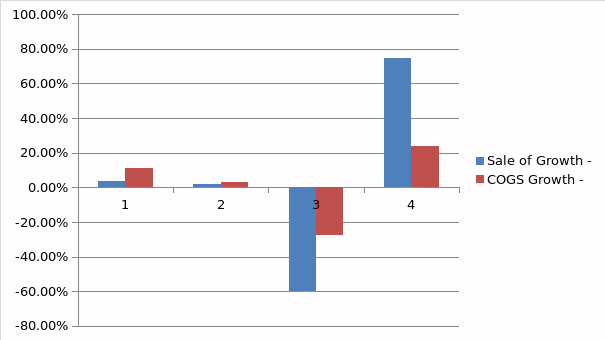
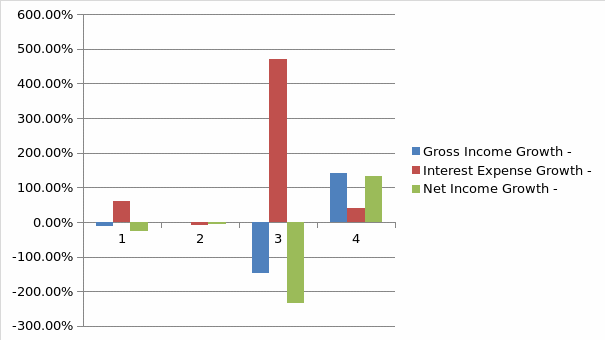
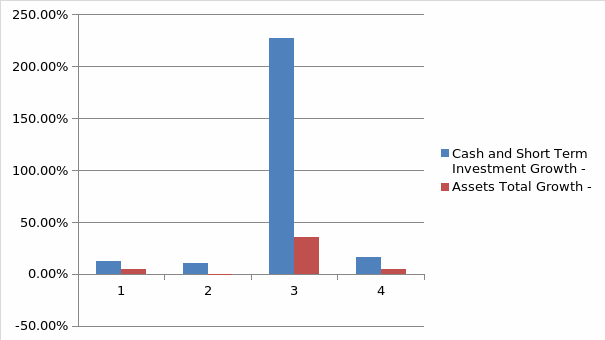
In table 1, the sale of goods and cost of goods sold decreased from 2018 through 2019. It means that the services and goods sold by Southwest airlines were low. Net income growth has been negative since 2018 and gained positivity in 2020 at 131.78. The company’s financial stability is highlighted in this growth; the sale of growth and COGS growth increased from 2018 to 2019, declined in 2020, and later rose in 2021 (Ren, 2020). The trends in the cash and short-term investments growth and assets total growth were marked by a fluctuation with an increase and decrease over the years because of the external factors affecting Southwest Airlines (Wu et al., 2019). For the gross income growth and interest expense growth, the company has not had a steady flow as in one year it increases, and in another year it decreases (Wu et al., 2019).
These changes from 2018 to 2019 show how Southwest Airlines overcame engine failures and external challenges in 2018, and while it started stabilizing in 2019, 2020 saw the impact of COVID-19, which led to a decline in operational costs. An analysis of table 1 and the fluctuations indicate Southwest Airlines’ trends of encounters with major external factors that caused destabilization; later, the company also started stabilizing in 2021. Figure 1 demonstrates the sales of growth and COGS growth of Southwest Airlines; Figure 2 depicts the percentages of gross income growth, interest expense growth, and net income growth for the company. Figure 3 contains the cash and short-term investment growth data and assets total growth.
Table 1: Trend Analysis for Southwest Airlines


Financial Ratio Analysis
Table 2 below shows the financial ratios of Southwest Airlines over the last three years, and it will be used in predicting the future financial stability of Southwest Airlines.
Table 2: Financial Ratios of Southwest Airlines
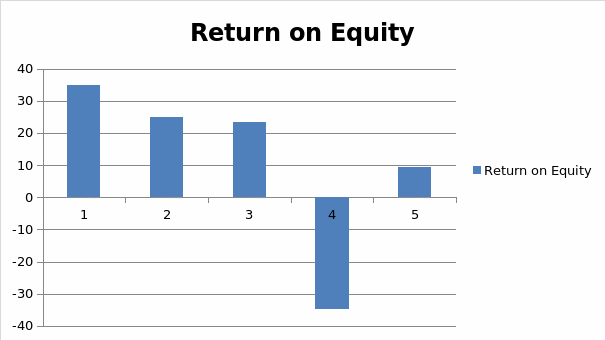
In table 2, the liquidity ratio of Southwest Airlines increased in 2020 but declined in 2021 (Wu et al., 2019). These data indicate that the company is not operating in debt to achieve its goals. Consequently, the return on investment ratios shows a decline from 2017 to 2019, which were in positive values. The company recorded negative ratios in 2020, that is, -34.63 on ROE and -8.8875 on ROA because of the COVID-19 pandemic (Wu et al., 2019). It indicates that investments in the company translate to returns because of strong operational plans in the business.
The profitability and operating performance ratios have been stable, with positive ratios over the last five years, suggesting that investment in the company guarantees profits. The business has expanded and generates more revenue hence the high profitability ratio (Wu et al., 2019). From the liquidity ratios, Southwest Airlines is strongly liquid, with a current ratio of 1.9 and a quick ratio of 1.8, explaining that the company can pay quick obligations and maintain profitability (Wu et al., 2019). From the ratio analysis, Southwest Airlines is said to have a strong business position in the market. These are aspects attributed to the growth profit margin that had remained above 32% over the last five years except for 2020, when the company suffered because of the COVID-19 pandemic (Wu et al., 2019).

In figure 5 above, 1 to 5 represents years, that is, 2017 to 2021, while the x-axis represents the scale of ratios. The indicated result is that there has been a decrease in the return on equity (Wu et al., 2019). It is highlighted in economics that when a company has been borrowing aggressively, the impact will be an increase in Return on Equity. The ROE of Southwest Airlines is at 9.7 percent after Covid-19, meaning that the company is earning lower than the shareholder’s equity (Wu et al., 2019). The net profit margin is at 6.1%, showing that low earnings translate to low net profits for the organization (Wu et al., 2019). The rationale is that equity is equal to assets minus debts. Southwest Airlines has a low-cost operating process that sees them borrow less, decreasing investment return.
The financial position of Southwest Airlines was affected in the year 2020 because of the COVID-19 pandemic (Wu et al., 2019). Receivables turnover went from 20% in 2019 to 8 % in 2020 (Fu et al., 2019). The company’s profitability ratios of 2020 recorded negatives, meaning no profits were realized in 2020 (Fu et al., 2019). These indications show that pandemics affect the airline business and make it challenging to realize a profit. However, new plans and operating strategies happened after the pandemic mitigation that saw the company start learning gains from their loyal customers. The management is generating a substantial profit from Southwest Airlines because of the expansion and market growth. The management should reduce the company’s debts and diversify on routes that the airline plies on (Wu et al., 2019). Diversifying the routes will attract more customers to the company and translate to increase revenue generation for the business, hence financial strength and stability for Southwest Airlines.
Return on Equity for Southwest Airlines
As demonstrated in Table 3, Southwest Airlines’ ROE has significantly changed over the past three years. In 2020, it was critically low (-32.86) and in 2021 only partially recovered to the level of 10.13 (“LUV financials,” 2021). Such a change was influenced by the economic factors triggered by the COVID-19 crisis. Compared to JetBlue Airways’ performance, Southwest Airlines have better indicators in terms of ROE, net margin stabilization after the COVID-19 year, and asset turnover, while financial leverage is approximately the same.
Table 3: Key Ratios for Southwest Airlines (“LUV financials,” 2021; “Southwest Airlines Co LUV,” 2022).
Table 4: Key Ratios for JetBlue Airways (“JetBlue Airways Corp JBLU,” 2022).
To improve the company’s ROE, the management should involve the stakeholders and improve on profit margin. Given the ratios’ stability demonstrated in Table 4, the management must decrease the debts they incur for business operations. Instead, the administration has to ensure that they have skilled employees that understand the company’s business operations and meet consumers’ needs (Fu et al., 2019). Therefore, if the company increases its customer base through diversification, it will increase revenue generation, reducing debts for business operations.
Specific Recommendation
Given the analysis, Southwest airlines have a strong financial value, and the price-earnings are at 11.96%. The indication is that Southwest Airlines are holding strong market value in the business and attracting investors in the market. The recommendation that can be made in the business is to ensure that they make diversification to other routes by using low-cost services and meeting customer needs (Vadlamani et al., 2022). Further, engagement in Corporate Social Responsibility programs is important to educate the public about the company and attract more consumers in the market. These will make Southwest Airlines continue operating profitably and increase its revenue, maintaining a competitive edge in the market. Leadership and constant customer analysis in the market are other recommendations that can help the business continue maintaining a reputation in the airline industry.
Southwest Airlines has a strong future of growth, and investors should be attracted to the company with these strong financial positions. The company should continue expanding its services and penetrating new markets domestically and internationally. The company should also maintain a low budget fare that will keep consumers attracted to their services, making it easy for Southwest Airlines to draw on new and repeat customers. Where possible, investments in new aircraft should be made to allow for efficiency and create positive customer experiences. In general, Southwest Airlines has a strong financial position.
Reflection
From the assignment, I have learned that the company’s position can be predicted through ratio analysis. Therefore, companies need the help of experts in financial analysis to calculate these ratios and provide in-depth explanations regarding the company’s state. Furthermore, I have learned that with good leadership strategies like transformational leadership, company employees and stakeholders work together toward the institution’s success. The leadership skills that allowed for strategies to be implemented by Southwest Airlines and overcome the Covid-19 pandemic caused a decline in revenue. The relevance of these ratios is what I will apply in my workplace to help determine the present position of the company and provide a reflection of future improvements in the organization.
References
Fu, X., Jin, H., Liu, S., Oum, T. H., & Yan, J. (2019). Exploring network effects of point-to-point networks: An investigation of the spatial patterns of Southwest Airlines’ network. Transport Policy, 76, 36-45.
JetBlue Airways Corp JBLU. (2022).
LUV financials. (2021).
Ren, J. (2020). Fare impacts of Southwest Airlines: A comparison of nonstop and connecting flights. Journal of Air Transport Management, 84, 101771.
Southwest Airlines Co LUV. (2022).
Vadlamani, S. L., Shafiq, M. O., &Baysal, O. (2022). Using machine learning to analyze and predict entry patterns of low-cost airlines: A study of Southwest Airlines. Machine Learning with Applications, 10, 100410.
Wu, W., Zhang, H., Zhang, S., &Witlox, F. (2019). Community detection in airline networks: An empirical analysis of American vs. southwest airlines. Journal of Advanced Transportation, 2019.