Statistical Analysis of the Nike Company

Summary

Nike is one of the best fashion firms in the world. It is an American corporation that has been performing well in the market for the past two decades. The company has invested in better strategic management and innovation, which has ensured its success in the market. As such, this analysis has included the statistical analysis that was done via the excel analysis tool pack. Data analysis is a crucial concept in research as it gives the business an assessment of performance for the past and prediction for the future (Fiori, 2019). The data was further presented through tables and graphs to make it more appealing to the audience.

Analysis 1

1st Quartile
-0.8
3rd Quartile
0.580002
 
Minimum
-3.81
Mean
-0.22667
Median
-0.11
Box and Whisker Plot for Daily Changes.
Figure 1: Box and Whisker Plot for Daily Changes.

Descriptive Statistics

Descriptive statistics of Nike were done through an excel analysis tool pack. The daily change data was executed in the software, and measures of central tendency were computed. Descriptive statistics help the researcher analyze the data and develop predictive analysis in the future for the business (Cichoń, 2020). Therefore, based on the descriptive analysis, Nike performs well despite the challenges in the global market economy.
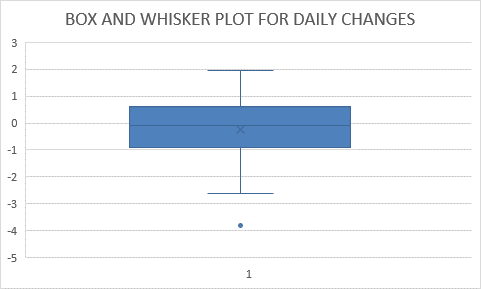
Column1
   
Mean -0.226668303
Standard Error 0.230931073
Median -0.11
Mode -0.800003
Standard Deviation 1.326598016
Sample Variance 1.759862297
Kurtosis 0.5247532
Skewness -0.533238077
Range 5.770003
Minimum -3.809997
Maximum 1.960006
Sum -7.480054
Count 33
Largest (1) 1.960006
Smallest (1) -3.809997
Confidence Level (95.0%) 0.470391203

Skewness

The data skewed to the right because the mean is less than the median. (-0.22667<-011).

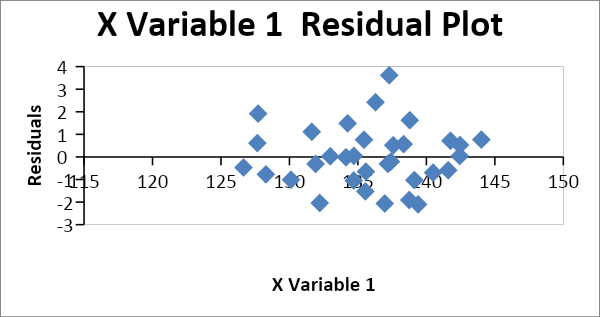
Correlation and Regression Analysis

SUMMARY OUTPUT                
                   
Regression Statistics                
Multiple R 0.958998                
R Square 0.919676                
Adjusted R Square 0.917085                
Standard Error 1.343235                
Observations 33                
                   
ANOVA                  
  df SS MS F Significance F        
Regression 1 640.4083 640.4083 354.9383 1.57E-18        
Residual 31 55.9327 1.804281            
Total 32 696.341              
                   
  Coefficients Standard Error t Stat P-value Lower 95% Upper 95% Lower 95.0% Upper 95.0%  
Intercept 3.469349 7.042994 0.492596 0.625769 -10.8949 17.83363 -10.8949 17.83363  
X Variable 1 0.976132 0.051812 18.83981 1.57E-18 0.87046 1.081804 0.87046 1.081804  
                   

Based on the regression done, Nike has a strong regression coefficient of 0.917, which translates to 91.7%. Thus, Nike has been performing well because of the right marketing strategies and innovation skills.

Probability Plots

Residual Plot.
Figure 2: Residual Plot.
Line Plot.
Figure 3: Line Plot.
Normal Probability Plot 1.
Figure 4: Normal Probability Plot 1.
Normal Probability Plot 2.
Figure 5: Normal Probability Plot 2.

Distribution

The data is not normally distributed because the mean is not equal to the median.

Central Limit Theorem.
Figure 6: Central Limit Theorem.

There is a higher likelihood of variation because of the large ranges between the daily changes. The probability also has supported the existence of an alteration in the values. For instance, when the probability of the change is higher, then the values are likely to be more altered. Alternatively, the standard error is small thus, will support the positive impacts on the firm. Therefore, Nike will change to the positive side because of the better strategies implemented.

References

Cichoń, M. (2020). Reporting statistical methods and outcomes of statistical analyses in research articles. Pharmacological Reports, 72(3), 481-485. 

Fiori, A. (2019). On firm size distribution: statistical models, mechanisms, and empirical evidence. Statistical Methods & Applications, 29(3), 447-482. 

Appendix A

Date Open High Low Close Adj Close Volume Daily change
11/10/20 130.050003 130.119995 126.25 127.709999 127.453568 8014700 -2.340004
11/11/20 128.690002 129.800003 127.18 127.660004 127.403671 6058700 -1.029998
11/12/20 126.620003 127.839996 125.629997 126.639999 126.385719 4780400 0.019996
11/13/20 127.910004 128.600006 126.830002 128.279999 128.02243 3986100 0.369995
11/16/20 129.460007 130.320007 127.370003 130.110001 129.848755 6116200 0.649994
11/17/20 130.479996 132.600006 129.110001 132.210007 131.94455 7002900 1.730011
11/18/20 133.070007 133.979996 131.529999 131.630005 131.365707 5572800 -1.440002
11/19/20 131.919998 132.110001 129.929993 131.910004 131.645142 4642800 -0.009994
11/20/20 133.300003 133.529999 131.910004 132.979996 132.712982 4318100 -0.320007
11/23/20 134.380005 134.889999 133.089996 134.130005 133.860687 6118400 -0.25
11/24/20 135 135.990005 134.210007 134.699997 134.429535 7204700 -0.300003
11/25/20 134.25 135.800003 133.619995 135.539993 135.267838 4484500 1.289993
11/27/20 136 136.130005 133.339996 134.25 133.980438 3506800 -1.75
11/30/20 133.910004 135.289993 132.690002 134.699997 134.429535 9652500 0.789993
12/1/20 136.440002 136.5 134.75 135.440002 135.168045 3834500 -1
12/2/20 135.160004 136.320007 134.669998 135.580002 135.30777 4132700 0.419998
12/3/20 135.100006 137.949997 135 136.960007 136.684998 4930900 1.860001
12/4/20 137.080002 137.399994 135.639999 137.190002 137.190002 4344000 0.11
12/7/20 137 138.860001 136.800003 138.75 138.75 4590800 1.75
12/8/20 138.240005 140.440002 137.649994 139.119995 139.119995 6953600 0.87999
12/9/20 140.570007 140.570007 138.270004 138.789993 138.789993 4341300 -1.780014
12/10/20 138.279999 139.139999 137.240005 137.580002 137.580002 4511000 -0.699997
12/11/20 137.389999 138.139999 136.229996 137.410004 137.410004 4172400 0.020005
12/14/20 138.919998 139 136.199997 136.279999 136.279999 7599000 -2.639999
12/15/20 137.429993 139.440002 137.25 139.389999 139.389999 7642600 1.960006
12/16/20 139.070007 140.490005 137.460007 138.339996 138.339996 6573400 -0.730011
12/17/20 139.919998 140.740005 138.75 140.5 140.5 8727000 0.580002
12/18/20 141.089996 141.139999 137.169998 137.279999 137.279999 17970800 -3.809997
12/21/20 144.820007 147.949997 142.509995 144.020004 144.020004 16111300 -0.800003
12/22/20 143.050003 143.470001 141.089996 142.449997 142.449997 6339400 -0.600006
12/23/20 142.559998 143.600006 141.699997 141.759995 141.759995 3388300 -0.800003
12/24/20 141.100006 142.190002 141.100006 141.600006 141.600006 1821900 0.5
12/28/20 142.539993 142.919998 141.039993 142.429993 142.429993 4080100 -0.11

Appendix B

RESIDUAL OUTPUT     PROBABILITY OUTPUT
           
Observation Predicted Y Residuals   Percentile Y
1 128.1311 1.918854   1.515152 126.62
2 128.0823 0.607655   4.545455 127.91
3 127.0867 -0.46669   7.575758 128.69
4 128.6875 -0.77754   10.60606 129.46
5 130.4739 -1.01386   13.63636 130.05
6 132.5238 -2.04375   16.66667 130.48
7 131.9576 1.112415   19.69697 131.92
8 132.2309 -0.31091   22.72727 133.07
9 133.2754 0.024642   25.75758 133.3
10 134.3979 -0.01792   28.78788 133.91
11 134.9543 0.045691   31.81818 134.25
12 135.7743 -1.52426   34.84848 134.38
13 134.5151 1.484947   37.87879 135
14 134.9543 -1.04431   40.90909 135.1
15 135.6767 0.763351   43.93939 135.16
16 135.8133 -0.65331   46.9697 136
17 137.1604 -2.06037   50 136.44
18 137.3849 -0.30488   53.0303 137
19 138.9076 -1.90765   56.06061 137.08
20 139.2688 -1.0288   59.09091 137.39
21 138.9467 1.623323   62.12121 137.43
22 137.7656 0.514425   65.15152 138.24
23 137.5996 -0.20963   68.18182 138.28
24 136.4966 2.423399   71.21212 138.92
25 139.5324 -2.10238   74.24242 139.07
26 138.5074 0.562579   77.27273 139.92
27 140.6159 -0.69588   80.30303 140.57
28 137.4727 3.617265   83.33333 141.09
29 144.0519 0.768142   86.36364 141.1
30 142.5193 0.530672   89.39394 142.54
31 141.8458 0.7142   92.42424 142.56
32 141.6896 -0.58962   95.45455 143.05
33 142.4998 0.040189   98.48485 144.82

Cite this paper

Select style

Reference

StudyCorgi. (2022, July 11). Statistical Analysis of the Nike Company. https://studycorgi.com/statistical-analysis-of-the-nike-company/

Work Cited

"Statistical Analysis of the Nike Company." StudyCorgi, 11 July 2022, studycorgi.com/statistical-analysis-of-the-nike-company/.

* Hyperlink the URL after pasting it to your document

References

StudyCorgi. (2022) 'Statistical Analysis of the Nike Company'. 11 July.

1. StudyCorgi. "Statistical Analysis of the Nike Company." July 11, 2022. https://studycorgi.com/statistical-analysis-of-the-nike-company/.


Bibliography


StudyCorgi. "Statistical Analysis of the Nike Company." July 11, 2022. https://studycorgi.com/statistical-analysis-of-the-nike-company/.

References

StudyCorgi. 2022. "Statistical Analysis of the Nike Company." July 11, 2022. https://studycorgi.com/statistical-analysis-of-the-nike-company/.

This paper, “Statistical Analysis of the Nike Company”, was written and voluntary submitted to our free essay database by a straight-A student. Please ensure you properly reference the paper if you're using it to write your assignment.

Before publication, the StudyCorgi editorial team proofread and checked the paper to make sure it meets the highest standards in terms of grammar, punctuation, style, fact accuracy, copyright issues, and inclusive language. Last updated: .

If you are the author of this paper and no longer wish to have it published on StudyCorgi, request the removal. Please use the “Donate your paper” form to submit an essay.