Business summary
The Nike Company was incorporated in 1967 to run its operations; to design, develop, and market its products of athletic footwear, equipment, and services. Nike has then developed to be among the world’s best brands. The company markets its products through its retail shops all over the world and uses digital platforms. It has almost all of its footwear is produced outside the United States, and the equipment products are produced in the United States and abroad. The Nike brands are categorized into, running, football, training, sportswear, and the Jordan brand. It has its products for different age groups, including children. Footwear is generally designed for athletics, but also there is a widened category for leisure too.
The Ratios According to the 10-k from 2018
- Current ratio=current assets /current liabilities 2018
- Current assets=cash, short-term investment, Inventories
- C.A=.22536-7131=15405
- C.L=22536-9812=12724
- Ratio=15405/12724=1.2
- Inventory turnover =Net sales/inventory
- Net sales=36397
- Inventory =5261
- Turnover=36397/5261=6.91
- 7 Times
- Debt to equity ratio=Total liabilities divided by total equity
- Total liabilities =22536-9812=12724
- Debt to Equity =12724/9812=1.3
- Net profit Margin
- Net income =1933
- Net sales=36397
- Net profit margin =1933/36397×100=5.31%
- Return on Equity
- Profit after tax divided by equity
- Income tax 2392
- G.P=15956
- PAT=15956-2392=13564
- Equity=9812
- ROE=13564/9812=1.4
- Price earnings ratio=MPS/EPS
- Basic Eps =1.19
- Common outstanding shares=1623.8
- MPs=42.9million /1623.8=0.0264
- EPS=1.19
- P/E RATIO=0.0264/1.19=0.02218
- Diluted shares outstanding=35.3
- MPS=42.9/35.3=1.2
- EPS=1.17
- P/E RATIO=1.2/1.17=0.0957
Ratios Analysis
Current Ratio
The company’s liquidity is favorable as it has high liquid investments inclusive of short-term investments. The working capital ratio is used to analyze the effectiveness of the current assets to be able to generate enough amount to pay the short-term obligations or the liabilities in a business operation (Reid & Myddelton, 2020). The ratio of Nike industries is1.2, thus it’s a desirable ratio in a business as it shows the flexibility of the firm to pay down its liabilities in the operations. This is an effective ratio for the company as it is able to meet the requirements. Nike’s current assets’ efficiency to cater to its liabilities is favorable and more than its market competitors in the industry.
Inventory Turnover
Inventory turnover means the number of times the stock was sold to achieve net sales. A higher turnover indicates that there were higher sales in the period. From our 2018 data, the company has a turnover of 6.91 times, which is equivalent to 7 times. This means it sold its inventory seven times in that period to attain net sales. The industry is a high-moving one as the inventory was sold many times. The trend of the turnover was favorable as it has increased with a positive deviation of 0.2 turnovers from the previous year. The turnover of Nike is higher compared to its competitors in the market.
Debt to Equity Ratio
The ratio measures the degree to which a company is financing its operations through debt and equity. The Nike debt to equity ratio is 1.3; this is a medium debt-equity ratio as the company can manage. It indicates that for every $1.3 of debt, it will be equal to 1 equity from the previous year; the ratio has reduced, thus showing the firm’s reduction in using debts to finance its operations in the business. Most industries in the market use debt to finance their operations, and from this information in Nike’s annual report, the company is doing great by not using debts to run its operations. Thus, Nike Company has the advantage to be ahead of its competitors in the market.
Net Profit Margin
The profit margin indicates the amount of income to be collected from net sales at the end of the Accounting period. Nike has a 5%net profit from the 2018 financial year. After it has incurred its expense and costs from the business operations at the end of the financial period, it gets a5% profit from its business activities. The net sales for this year increased from last year’s sales. From the report, it’s evident that there was an increase in the profit margin when compared with last year’s report. The company is doing quite well and has a higher profit margin than other industries in the market.
Return on Equity
Return on equity is the measure of profit or efficiency attributed to the equity invested. Nike’s return on equity is at 1.4; this shows the efficiency of the firm increasing profit generation without much capital needed. The management has appropriately deployed the shareholders’ capital. This year’s returns have increased from last year’s returns. The company is generating enough returns as it is required from its equity investments. The company’s investments generate a lot of profits than its competitors, this is a favorable return for the company.
Price Earnings Ratio
P/E ratio is used in valuing a company that measures its current price share to its per-share earnings. Investors use it to determine the relative value of a company’s share in the market. Nike has a PE ratio of common shares at 0.02218; this is a low value for the company as it is below. For the diluted shares, it is at 0.957and the value of the shares is low. The market competitors have a high value of shares than Nike. This is unfavorable to Nike as it will attract few investors in financing them. According to Nike’s annual report published at the end of its financial year in May 2018, the company has a low value of its shares on the market (Investor.nike, 2018).
Note. Investors.nike. (2018). Reports fiscal 2018 fourth quarter and full year results.
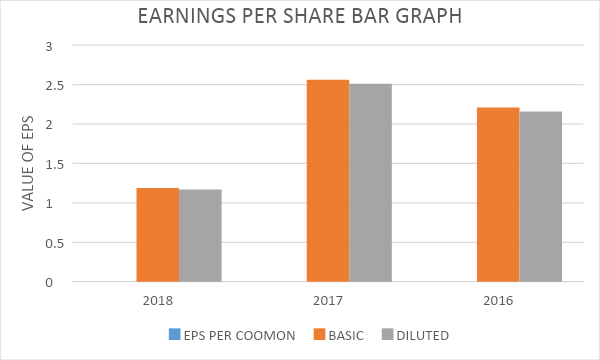
As shown in Figure 1, the earnings per share have reduced from 2017 as 2018 recorded the lowest earnings per share compared to previous years.
Liquidity and Debt Assessment
The company’s liquidity is high as it has a favorable working capital of 1.2. The company’s investments are easily convertible to cash if the liquidity ratio is high (Lee, 2020). The company has a debt-to-equity ratio of 1.4 it should maintain a low ratio to have a good credit score. The debt of the company should be reduced as it is at 1.4 of equity. The firm should avoid using debts in financing its operation.
Profitability
The company’s profits are increasing each year, and its net profit margin shows that it was increasing with a 5% increment each year. A company’s profitability is essential as it gives the company a better potential for performance (Coulon, 2020). The company is more profitable by 5% of the sales made each year. Nike’s industry gross profit margin increased in 2018. The net income from the shareholder’s dividends also has increased leading to higher profitability of the company. The total assets of the company also give a high income hence high profitability.
Cash Flow Opinion
The company can maintain a positive cash flow when it increases its cash reserves as it has a high liquidity ratio. By reinvesting, settling future debts, and paying out money to the shareholder, the firm will be able to generate a positive cash flow from its activities. The management should also understand the company’s cash flow and maintain the money in all departments in the firm.
References
Coulon, Y. (2020). Profitability and performance ratios. Rational investing with ratios (pp. 85–104). Springer International Publishing.
Investors.nike. (2018). Reports fiscal 2018 fourth quarter and full year results.
Lee, T. A. (2020). Financial accounting theory. The Routledge companion to accounting history (pp. 159–184). Routledge.
Reid, W., & Myddelton, D. R. (2020). Financial and stock market ratios. The meaning of company accounts (pp. 43–56). Routledge.