Introduction
Investing in the financial markets is very risky and investors face the possibility of losing their money. Risk in the financial markets refers to the possibility that an investor will not get the expected returns. There are some risks which the investor can do nothing about such as recession, changes in interest rates, and war. On the other hand, some risks are specific to individual investments thus can be controlled. A shrewd investor focuses on reducing controllable risks. The problem of risk in the financial markets necessitated the introduction of a means of dealing with these risks (Merton 1992).
Financial instruments refer to claims that are readily available and negotiable. This means that a person who owns security can sell it quickly and easily with minimal reduction in the price at which he or she bought the security. The main financial instruments are bonds and shares (Arditti 1996). A person with a bond has a claim on the interest and principal that was promised by the person or company who issued the bond.
Bonds are also called debt securities and can be issued by the government or a corporation. These are different from stocks as they are usually issued for only a certain period. After this time, the person who purchased the bond is entitled to the principal and interests accruing to the security. According to Williamson and Houthakker (1996), a futures contract is a claim on certain security or commodity. An option in the financial market refers to a claim that an investor could have, but the investor does not have to apply it (Merton 1992).
The main participants in financial markets are financial companies, banks, other financial/insurance organizations, and individuals. Engaging in financial markets may be through either selling or buying financial securities, receiving dividends, and borrowing securities. Shares or stocks are financial securities with are often purchased to accumulate capital (Groz 1999).
In London, for example, the London Stock Exchange is charged with the responsibility of ensuring that various viable securities are listed and that these are accessible to any investor regardless of their financial capacity. The London Stock Exchange acts as the main body for listing the various companies, monitoring transactions, and the operation of the companies that are listed in it. In addition, the body controls the operation of the brokers and intermediaries used by the investors (Michie 1999).
Types of financial markets
Financial markets are subdivided into the capital market and the money market. The capital market consists of the stock market, the bond market, and the commodity market that facilitates the trading of commodities. The money market provides short-term financing and investment while the insurance market facilitates the redistribution of various risks. The derivatives market allows for the management of financial risk. Future markets provide forward contracts which can be used at a future date (Fame 1976).
Investors in the financial market are traditionally placed in one of two groups: the hedgers or the speculators. Hedgers have an interest in the underlying asset and aim to hedge out the risk associated with price changes. Speculators aim to make returns by predicting movement in the market and getting into derivative contracts. They have no practical use for or intent to take or make delivery of the underlying asset (Arditti 1996). This means that an investor is looking for an opportunity to be exposed to an asset in the long run or even in a short-term contract. Hedgers normally include consumers and producers of a commodity or the possessor of assets that are prone to certain market variables such as interest rates (Louis & Poncet 2005).
Portfolio theory and the Capital Asset Pricing Model are useful for both the hedger and the speculative investor because they can understand and measure the actual risk in their portfolios and also have an idea of the future expected returns of their investments.
Measures of Risk
Investors cannot measure the risk of their portfolios before understating the various risks that are present in the securities, they are transacting in. The risk of holding a certain portfolio is either a speculative risk or market risk (Merton 1992). Speculative risk is the risk involved in holding specific security and varies from one security to another. Speculative risk can be avoided when an investor has a well-diversified portfolio, whereas market risk faces all investors transacting in the financial market, thus it cannot be controlled. Market risk is due to unavoidable market forces such as inflation, fluctuations of the exchange rate and interest rate in the market as well political and government influence in the country (Groz, 1999).
The investor needs to identify and understand the various risks that are involved in holding a specific portfolio of security. With the understanding of portfolio theory, the investor can combine securities with both high and low risk in the returns, subsequently diversifying the risk of his investment. When diversifying among the different portfolios, the investor can use arbitrage as a means of minimizing the risk involved in trading in the securities (Merton 1992).
Arbitrage Argument
The arbitrage argument applies when the deliverable asset is in high supply or can be easily created (Hull 2006). Arbitrage means when the investor substitutes non-performing security with a low return for the security of high return, both with the same market value. This pricing rule enables a speculator to reach break-even albeit in a difficult business environment. The Capital Asset Pricing Model will assist the investor to achieve a break-even when prices of his portfolio are weak due to the basic laws of demand and supply.
Arbitrage also involves purchasing financial securities in a market and almost immediately selling them in another market. This enables the participants in the market to gain from the price difference. This function in the market eliminates or reduces the variation in prices of securities in the different markets (Jensen 1968).
Portfolio Theory
Harry Markowitz developed the Portfolio Theory. He stated that assuming that investors are only interested in securities that have higher rates of return with lower risk, portfolio theory postulates a framework for selecting optimal portfolios. Investors will choose to invest in securities in the upward curve of the efficiency frontier (Markowitz 1952). An investor can increase the leverage of a certain portfolio through the buying of risk-free assets. Increasing risk-free assets allows for a position in the area above the efficient frontier. Consequently, by combining a risk-free asset with risky assets, it is possible to construct portfolios whose risk-return profiles are superior to those on the efficient frontier (Campbell 1995).
Portfolio theory remains an important component of financial theory because the investor can understand the CAPM model and its functions and use diversification while investing even for a short-term period. Modern portfolio theory originated with the work of Markowitz (1952), who recognized that by combining assets that are not perfectly correlated, an investor could reduce his or her investment risk without reducing expected returns. Therefore, it is possible to create a portfolio with the smallest risk for a given return.

Capital Asset Pricing Model (CAPM)
According to William F. Sharps, Capital Asset Pricing Model is an economic model which can be used for financial securities, market derivatives, and assets through adjusting according to risks and expected returns. He argues that investors should demand additional expected returns on their securities (risk premium) if there are additional risks present with those securities. The model clarifies that the expected return which the investors require is equal to the risk-free rate security with a risk premium.
Investors will shy away from investing in securities that do not meet these requirements. The models of Sharpe (1964) and Lintner (1965) formalize this. Expected returns on assets are different because the assets have different covariance with a well-diversified portfolio. The model also includes a reward for covariance risk. That is, to translate the covariance into an expected return, we need the price of covariance risk – how this risk is treated in the marketplace (Sharpe 1964).
The CAPM rests on several simplified assumptions (Sharpe 1964). The model assumes all investors to be risk-averse and to have identical preferences for risks and returns. Investors are assumed to only care about risks and returns, and the variance of the distribution of returns. In addition, the model assumes that all investors have identical expectations about future risks and returns of all securities. Finally, the model assumes that there are no transaction costs and no costs of research or information (Lintner 1965).
William Sharpe developed the formula below for the Capital Asset Pricing Model. He also came up with this empirical formula for the CAPM.
r = RF + beta x (Km – RF)
Where
r – Expected return rate on a security;
Rf – a rate of a “risk-free” investment, i.e. cash;
Km – a rate of the appropriate asset class.
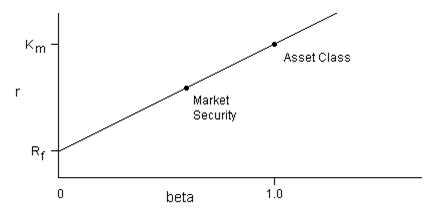
The beta of a project measures the volatility of the security concerning the entire asset class. The equation shows that investors want higher levels of returns to compensate them for the higher risk. One can predict the behavior of certain security as a function of beta. The CAPM demonstrates that if an investor knows a security’s beta, then he or she knows the level of returns that investors expect it to have (Redhead 1997).
Conclusion
Portfolio theory teaches us that investment choices are made based on expected risk and returns. These expectations are often formed based on a historical record of monthly returns, measured for a while. An investment’s risk and return can be combined into one measure of risk-adjusted performance by dividing the excess returns by the standard deviation (Jensen 1968). The resulting measure known as the Sharpe ratio can help the investor to identify the most efficient investment, that is, the one with the highest return per unit of risk.
Despite the caveats of the Capital Asset Pricing Model, it remains one of the most reliable models. For the aggregate supply of all securities in the market to equal the aggregated demand for these securities, their expected returns must compensate investors for systematic risk. These returns tell an investor how much he can expect to be rewarded for bearing systematic risk for given security (Jensen 1968).
This approach has led to the use of risk-adjusted excess return as a measure of performance. An investor can then choose one or more securities with the highest alphas of information ratio in categories. With proper use of portfolio theory and the CAPM, the funds’ manager will benefit from selecting effective portfolios. In addition, they will know the returns, risks, and correlation of future assets as well their exposures and benchmarks.
Reference List
Arditti, F., 1996. Derivatives: a comprehensive resource for options, futures, interest rate swaps, and mortgage securities. USA: Island Press.
Copeland, T. and Weston, J., 1988. Financial Theory and Corporate Policy, West Sussex: Addison-Wesley.
Fame, E.F., 1976. Foundations of Finance, New York: Basic Books.
Groz, M.M., 1999. Forbes Guide to the Markets, New York: John Wiley & Sons.
Harvey, C.R., 1995. ‘Predictable Risk and Returns in Emerging Markets,’ Review of Financial Studies, Oxford University Press for Society for Financial Studies, vol. 8, no. 3, pp. 773–816.
Hull, J.C., 2006. Options, Futures and Other Derivatives (6th edition), New Jersey: Prentice Hall.
Industrial Systems Research, 2008. The Business Finance Market: A Survey, Manchester: Industrial Systems Research Publications.
Jensen, M.C., 1968. ‘The performance of Mutual Funds in the Period 1945–64’, Journal of Finance, vol. 23, no. 2, pp. 389–416.
Lintner, J., 1965, ‘The valuation of risk assets and selection of risky investments in stock portfolios and capital budgets’, Review of Economics and Statistics, vol. 47, pp. 13–37.
Louis, A. and Poncet, P., 2005. Dynamic Asset Allocation with Forwards and Futures. New York: Springer.
Markowitz, H., 1952: An Introduction to Global Financial Markets. Hampshire: Macmillan Press.
Merton, R.C., 1992. Continuous-Time Finance, Oxford: Blackwell Publishers.
Michie, R. 1999. The London Stock Exchange: a history. Oxford: Oxford University Press.
Redhead, K., 1997. Financial Derivatives: An Introduction to Futures, Forwards, Options and Swaps. London: Prentice-Hall.
Sharpe, W.F., 1964. ‘Capital Asset Prices Model: A theory of Market equilibrium under conditions of risk’, Journal of Finance, Vol. 19, no. 3, pp. 425–442.
Williamson, P. and Houthakker, H., 1996, The economics of financial markets. New York: Oxford University Press.