Introduction
Surveying the quality of local water resources in the context of measuring biochemical parameters is of high research and applied importance not only for the laboratory but also for the local community. It is known that stream water has a high potential for agricultural use, but it is also connected by underwater channels and feeds plants independently. Moreover, urban agglomerations use such water for economic purposes to meet community needs for clean and quality water. However, it is a mistake to believe that only modified water — through its color, smell, and taste — should be checked: in fact, environmental monitoring of water resources should be a priority on a regular basis.
The objectives of this laboratory report are to summarize the results obtained during the measurement. Thus, instrumental work was carried out in two directions at once to
- study oxygen consumption, BOD, and
- detect dissolved suspended solids.
Sites Description
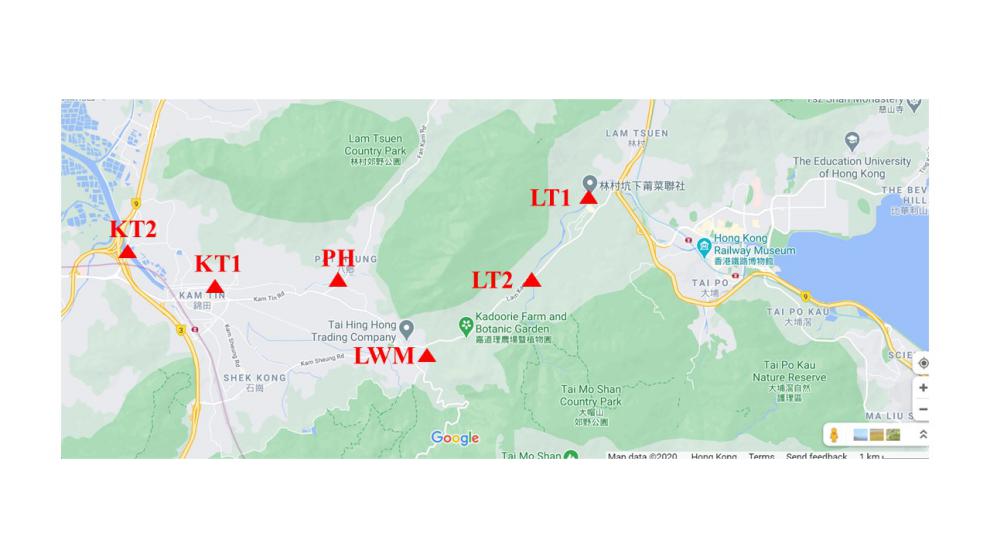
For this laboratory report, a field water sample collection was organized along several river valleys in Hong Kong. Most of the river basins used are of fundamental importance for local urban settlements. For instance, the Lam Tsuen River, from which two samples were taken at a distance of about 700 meters, feeds the Tai Po River and eventually flows into Tolo Harbour. Other sample sources were localized to the west and included natural water channels and the Kam Tin River, as shown in Fig. 1 and Table 4. The choice of specific locations is due to their proximity to urban industrial sites or, conversely, to their distance from agglomerations towards natural zones.
| Site | Location | Source | GPS | On-site Picture |
| 1 | 林村坑下莆菜聯社附近的小桥 (LT1) | Lam Tsuen River | 22°27’31” 114°8’27” | 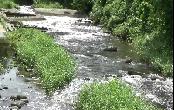 |
| 2 | Tai Om 大庵车站附近的桥 (LT2) | Lam Tsuen River | 22°26’41” 114°7’52” | 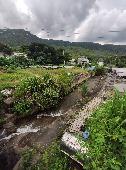 |
| 3 | Ling Wan Monaster 观音山凌云寺入口附近的水渠 (LWM) | Water channel | 22°25’52” 114°6’30” | 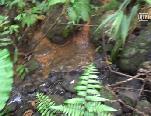 |
| 4 | Pat Heung 八乡附近的一座小桥 (PH) | Water channel | 22°26’35” 114°5’32” | 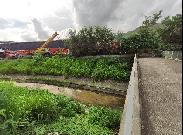 |
| 5 | 大江埔村村公所 附近的铁栅栏进去 (KT1) | Kam Tin River | 22°26’35” 114°4’53” | 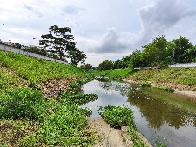 |
| 6 | Chi Ho Road 治河路附近的大桥 (KT2) | Kam Tin River | 22°26’56” 114°2’58” | 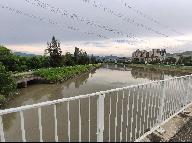 |
On-Site Parameters
Sample collection was carried out directly with the help of manual capture of the water flow and was replaced by the procedure for determining the physical and chemical parameters of water in situ. In particular, the samples under study (6) were analyzed for temperature, pH, electrolytic conductivity, turbidity, and detection of organic impurities. As can be seen, a significant deviation of each of these parameters may signal serious disturbances in the ecological background of the water flow, probably caused by human activity. Thus, a study of electrolytic conductivity could be an indicator of the concentration of dissolved solids in a water sample as a suspension. On the other hand, the turbidity index, NTU, was used for the possible determination of potential water pollution by organic and inorganic suspended solids. Moreover, the parameter of increased interest for measurement was the oxygen consumption index. It is worth recalling that this number indicates the amount of molecular oxygen (in mg/L, ppm, or %) required for the life of aerobic microorganisms that biochemically degrade the finished organic material. Thus, there is a transparent relationship between the two values: BOD and water quality. The higher this value for the water resource, the more organic impurities it contains and the worse the water quality. It is worth clarifying that the parameters to be measured were determined immediately after sampling with two sensors immersed in a bucket of water.
Procedure
BOD5
- Apparatus: For each group: BOD bottles x4 (with glass stoppers and plastic caps); beaker 1L; graduated cylinder 500mL; labels x4. For the class: Distilled water with 100% DO; BOD meter and probe.
- Procedures: Analysis should be carried out within 6 hours of collection. Samples should be cooled at or below 4°C during storage. Back to the laboratory:
- Put the cooled samples into a water bath to bring their temperature close to 20°C.
- When samples are ready, pour the entire sample into a glass beaker and use a glass rod to homogenize the content, including the suspended matter. Avoid induction of air bubble into the samples at all times.
- Carefully transfer the required volume of sample to a 500 mL graduated cylinder. To the 300 mL mark if dilution is not required.
- If dilution is required, use prepared aerated distill water for dilution. Dilute to 300 mL using a predetermined dilution fraction (see Table 1).
- Depending on your sample, prepare 3 dilutions into separate BOD bottles to cover the estimated range required. Remember to label the bottles properly.
- In addition to your sample(s), prepare a dilution water blank. (oxygen uptake of blank should be less than 0.2 mg/L).
- Measure and record the initial DO in both % and mg/L and temperature using a DO meter (refer to the previous section).
- Carefully stopper the bottles using glass stoppers such that no air bubble form below the cap. Apply the plastic cap or parafilm to seal the BOD bottle in order to prevent evaporation and breaking the water seal.
- Incubate bottles of different dilutions and blanks at 20°C.
- Measure the final DO five days later. For test bottle with DO depletion >2.0 mg/L and residual DO >1.0 mg/L calculate BOD5 [mg/L] using equation:
where: DO0d, DO5d= DO [mg/L] measured in day 0 and day 5 respectively;
Vp=volume of sample added to BOD bottle [mL];
300/Vp is also known as dilution factor.
Suspended Solids
Apparatus: For each group: filtration unit; pre-weighted filter paper and holder; graduated cylinder (1L). For the class: Analytical balance (to 0.1 mg); drying oven (103 – 105°C); desiccator.
Procedures:
- Weight the filter paper (alone) and filter paper plus the aluminum filter holder.
- Assemble the filtration unit and apply suction and wash the unit with three successive 20 mL distilled water. Disconnect suction tube and discard washings.
- Measure the volume of sample with the graduated cylinder.
- Apply portion of sample into the filter funnel and begin suction. Complete the filtration of the entire sample.
- Disconnect suction tube.
- Carefully remove filter from apparatus and transfer to the filter holder.
- Homogenize the filtrate and retain 100 mL in a bottle for TN analysis.
- Dry the filter for at least one hour at 103 – 105°C in an oven, cool in a desiccator and weight.
- Calculate suspended solids ( SS; mg/L) using equation:
where:
- A = weight of filter + dried residue [g];
- B = weight of filter [g]; and
- V= sample volume [L]
Results
In order to simplify the organization of the results, it should be clarified beforehand that the general laboratory study was sequentially divided into three sections. Thus, the initial data recording the structural changes in aqueous suspension that had not yet occurred took into account the most important physical and chemical values: temperature, pH, electrical conductivity, BOD, and turbidity of solutions. The numerical values of the recorded water samples are shown in Table 1.
All six water samples were delivered to the chemical laboratories for research measurements in two directions, namely, the detection of oxygen concentrations and the study of suspended particles. The results of the corresponding direct measurements and calculations demonstrating the final result are given in Tables 2 and 3, respectively.
Data Analysis and Discussion
The most obvious parameters intuitively associated with water quality are organoleptic properties, including turbidity. In this study, it was shown that the NTU value for the sixth water sample, KT2, was significantly higher than the others in numerical value, as shown in Table 1. For example, the regulated NTU value for consumed water should not exceed 0.3 — and according to some data, even up to 5 — units (“Understanding turbidity,” 2019; Oram, n.d.). Although sites 1 and 2 are suitable for this indicator, in the case of sites 5 and 6, the water was incredibly turbid, indicating a high content of organic and inorganic impurities that refract light.
Although pH and water temperature determine stable and acceptable values for natural water systems, the concentration of dissolved oxygen, DO, is very different. The determination of BOD in surface waters is used to assess the content of biochemically oxidized organic substances, the living conditions of hydrophones, and as an integral indicator of water pollution. It may be noted that for Locations 4 and 6, these parameters are minimal and, on average, half as low as any other DO level (Table 1). Moreover, the preliminary analysis does not show any correlation between oxygen level and turbidity, pH, or source temperature. There are two reasons why this phenomenon may be observed: it may be due to reduced organic pollution of rivers or, on the other hand, it is a mathematical generalization of the different volumes of water. The treatment in Table 2 shows that the calculated BOD for zones 4 and 6 does not differ much from the others, which is equivalent to the tolerance of these values. However, higher BOD values, as is typical of 1, 3, and 5 sources, may indicate faster depletion of molecular oxygen, and consequently, biological stress of the living system (“Dissolved oxygen,” n.d.). Although, of course, it should be recognized that even these high values fit within the acceptable range, and therefore these waters are difficult to classify as contaminated (“Biological oxygen,” 2019).
Measuring the number of dissolved solids in the water suspension is aimed at detecting additional sources of natural resource pollution. Such particles can be not only organic and inorganic natural molecules of the substance cycle but also heavy metal atoms and pesticides that poison ecosystems (“Clearing up,” 2018). The relationship between water quality and particle concentration is obvious: the higher this parameter is for a particular water resource, the more contaminated it is. Although, according to the EPA, this indicator only partially affects human health and should not be quantified, exceeding 500 ppm may pose a threat to the safety of natural and urban communities (“What is the acceptable,” n.d.). Table 3 shows that the SS level of each of the sources is acceptable, and therefore, the water data can be considered safe. Simultaneously, it should be noted that Sites 3-6 have higher values and therefore require a more thorough environmental impact assessment.
Conclusion
In conclusion, it should be noted that environmental monitoring of the water environment by methods of physical and chemical measurements of the most important parameters is important for both natural and urban systems. In the course of this laboratory work, six water resources located along Hong Kong were measured. The main parameters to be determined, along with ambient temperature, pH, and turbidity, were DO and SS, indicating potential contamination of the systems. It was shown in the work that although BOD and SS values differ for all Sites, they still fall within the regulated allowable range, which means that these waters cannot be called polluted.
References
Biological oxygen demand (BOD) and water. (2019). USGS.
Clearing up turbidity and suspended solids uncertainty. (2018). Envirotec.
Dissolved oxygen and biochemical oxygen demand. (n.d.). EPA. Web.
Oram, B. (n.d.). National secondary drinking water standards. Water Research Center. Web.
Understanding turbidity and why it matters. (2019). Water. Web.
What is the acceptable total dissolved solids (TDS) level in drinking water? (n.d.). The Berkey. Web.