Executive Summary
The aviation industry has experienced severe challenges since the global economic turmoil in 2008; however, the purpose of this report is to evaluate the financial ratios of Turkish Airlines and Oman Air to assess and compare the performances over a period of four years (from 2013 to 2016). To scrutinize the actual financial situation of these two companies, this paper will use real-life data in order to calculate profitability, efficiency, liquidity, and gearing ratio; in addition, this report will concentrate on the financing of the airlines, the trend of financial performance and include a comparative analysis. At the same time, this report will illustrate horizontal common-size analysis (using 2014 as a base) and vertical common-size analysis (using total assets as a base) to predict the financial trends, and measure economic risks of these airlines; finally, it will include the evaluation of the performance of business units of Turkish Airlines.
Introduction
The impact of the global financial downturn, unstable political situation, unfair measures of the government of different countries and many other external factors changed the business environments of Turkish Airlines and Oman Air; therefore, these companies failed to make efficient financial decisions and to implement strategies. For the rising fuel cost, Oman Air is facing continuous losses and withdrawal of governmental subsidy while Turkish Airlines operates with a narrow profit margin and it has been striving to carry on business through alternative financing. This paper will provide recommendations for both companies by analyzing different financial ratios; however, all calculations will be shown in appendix 2 and 3.
Financing of Turkish Airlines
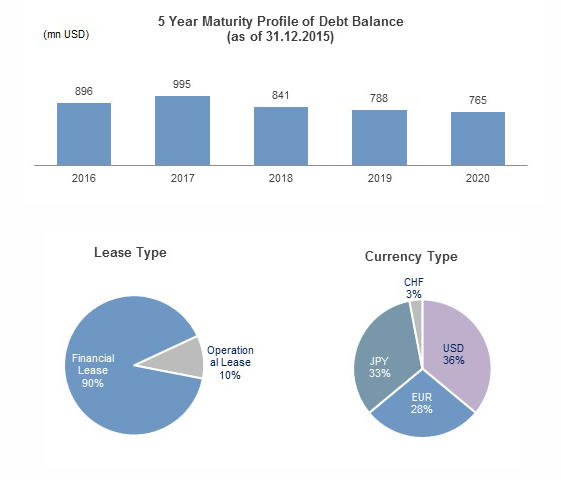
It is the fourth-largest carrier in the world, which was established in 1933; presently, it operates in 119 countries and 298 destinations (Turkish Airline 2016, p.4); according to the annual report 2016 of this company, it has more than 24124 employees. The finance strategy of Turkish Airlines has been organized with the aim to get the highest facilities for credit financing with the lowest cost in different currencies. As a result, the company issued a variety of bonds and Trust Certificate in the international financing market in US dollar, Euro and JYP and so on (Turkish Airlines 2018); figure 1 gives more information in this regard.
Financing of Oman Air
The Government of Oman has decided for no longer subsidizing the Oman Air with public money since it has failed to recover its financial position and make losses. In this context, the company has tried to manage funds from alternative financing resources and joint venture with different airlines such as Deutsche Lufthansa, Turkish Airlines and others; furthermore, it has concentrated on making leasing agreements with aircraft manufacturers like Boeing and Airbus.
Liquidity Ratios
Current Ratio
Table 1: Current ratio of Turkish Airlines and Oman Air. Source: Self-generated.
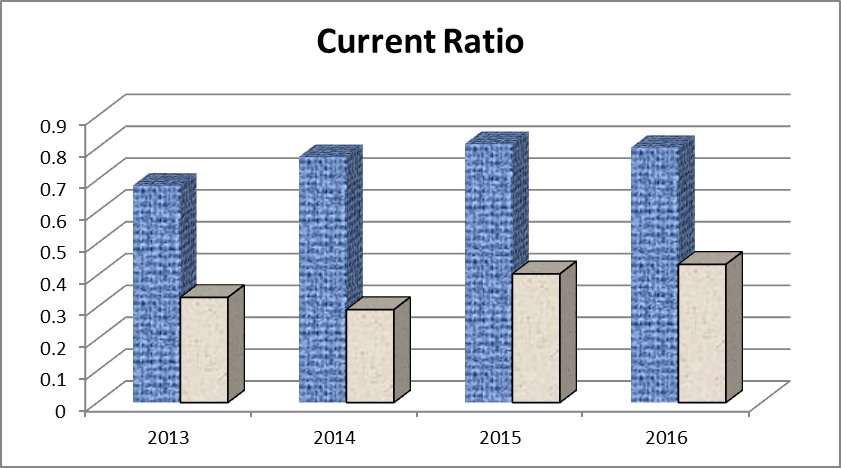
This is an important ratio for these airlines because it shows the capacity Turkish Airlines and Oman Air to pay short-term debts; at the same time, it determines whether the companies are able to use the short-term finance or not. Table 1 demonstrates that the current ratio of Turkish Airlines from 2013 to 2016 was 0.68, 0.77, 0.81, and 0.80 respectively. On the other hand, the current ratio of Oman Air from 2013 to 2016 was 0.33, 0.29, 0.40, and 0.43 accordingly. The result of this ratio indicates that both companies have limited capacity to reimburse the short-term debts, but the financial ability of Oman Air to meet short-term obligations is worse than Turkish Airlines; fig.2 demonstrates the result of current ratio graphically.
Acid Test
Table 2: Acid Test or quick ratio of Turkish Airlines and Oman Air. Source: Self-generated.
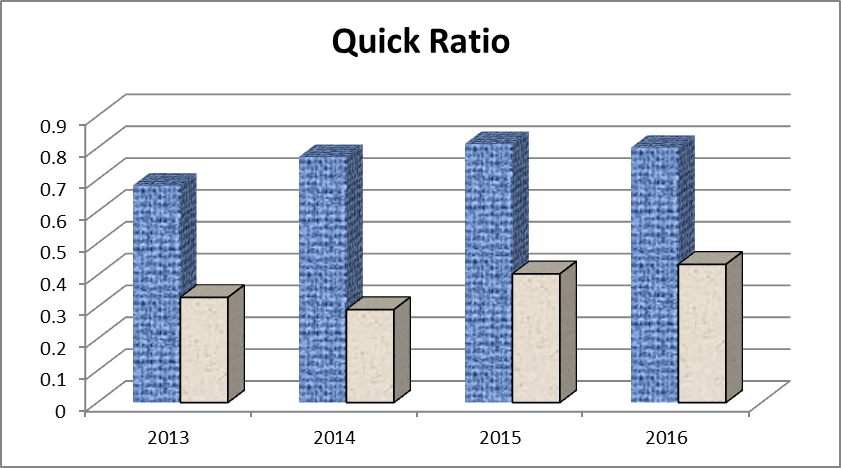
Table 2 shows that quick ratio of Turkish Airlines from 2013 to 2016 was 0.63, 0.72, 0.76, and 0.75 respectively whereas this ratio for Oman Air was 0.26, 0.24, 0.34, and 0.38 accordingly; however, this result indicates that Turkish Airlines has limited capacity to fulfil its short-term monetary burdens because the standard range of this ratio is 1:1. Even though the quick ratio of Oman Air has increased slightly in 2016, the decline in the condition of this company was significant; therefore, Turkish Airlines is in a stronger position; fig.3 demonstrates the result of quick ratio graphically.
Profitability Ratio
Gross Profit Margin
Table 3: Gross profit margin of Turkish Airlines and Oman Air. Source: Self-generated.
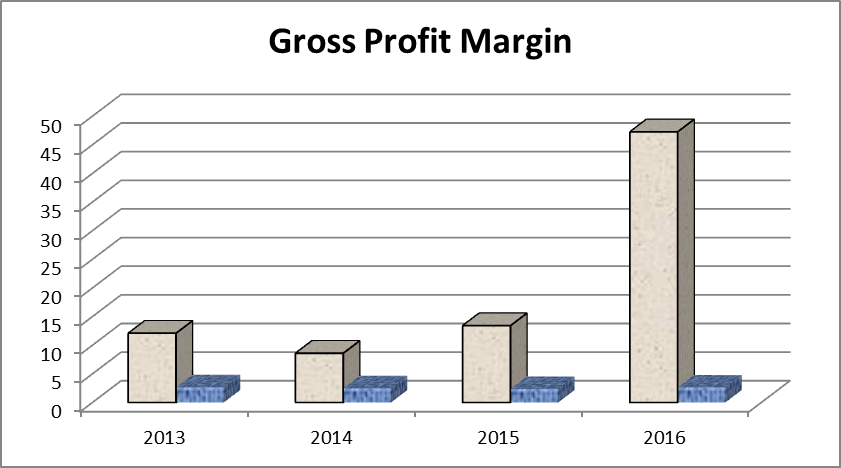
GPM is one of the most important indicators to the investors to decide about their further investment because it concentrates on the firm’s trading activities (Higgins 2015); however, the higher-margin is generally treated as rewarding. Table 3 shows that the operating loss of Oman Air from 2013 to 2016 was RO100.7million, RO96.38million, RO66.5million and RO120.08million respectively; therefore, the result of this ratio was in the negative, which indicates costs of this company being too high. From the result of this ratio, it can be concluded that GPM of both companies has decreased, but the drop in case of Oman Air was significant as it is in the most awful situation; fig.4 demonstrates the result of gross profit ratio graphically.
Net Profit Margin
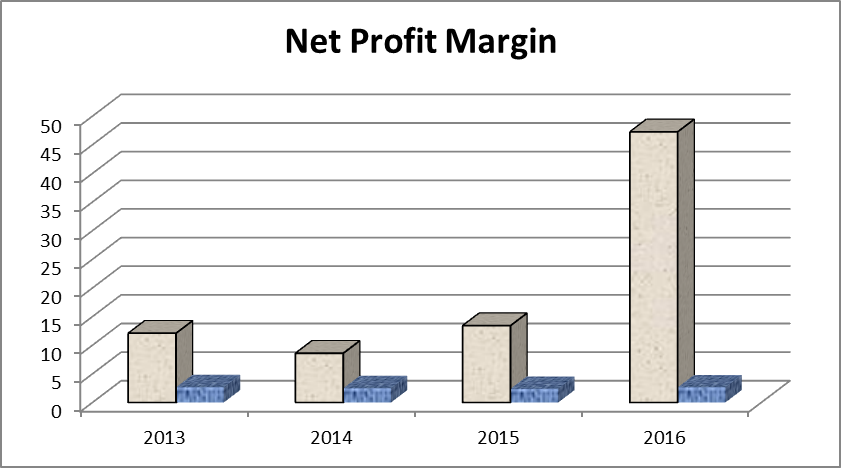
Table 4: Net profit margin of Turkish Airlines and Oman Air. Source: Self-generated.
NPM is a vital indication of profitability that permits stakeholders to assess a number of things, for instance, higher NPM indicates the business run cost-effectively and able to change its turnover into profits (Higgins 2015); moreover, it directly reveals the actual situation of a firm’s financial health. Table 4 shows that NPM of Turkish Airlines from 2013 to 2016 was 3.63%, 7.63%, 10.16% and -0.79% respectively; however, this ratio has dropped drastically in 2016, which indicates that it should redesign its strategies to restore its sustainable market position. On the other hand, the calculation of net profit margin of Oman Air demonstrates that it has failed to increase the NPM from 2013 and every year, it showed negative result; therefore, it indicates the very poor performance of Oman Air in the competitive market. Fig.5 demonstrates the result of the net profit ratio graphically.
Return on Shareholder’s Funds
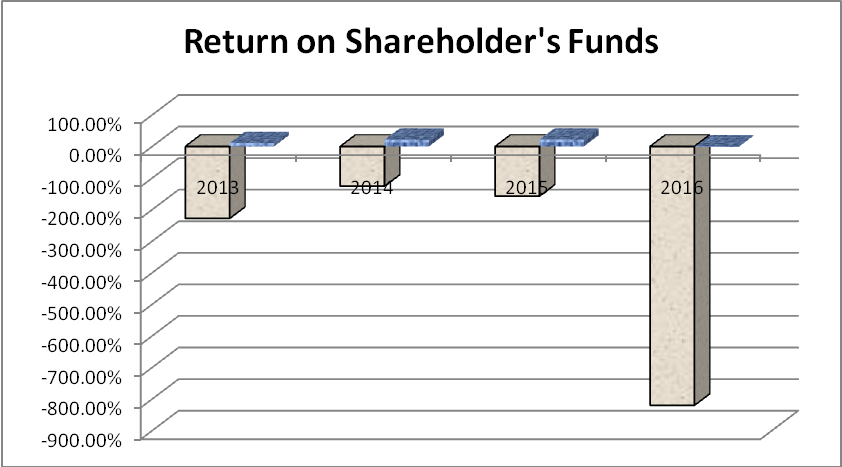
Table 5: Return on shareholder’s funds of Turkish Airlines and Oman Air. Source: Self-generated.
It is essential to note that ROTE demonstrates the investment efficiency of the company by measuring the return of shareholders’ equity in a specific time limit. Table 5 shows return on shareholder’s funds of Turkish Airlines had decreased from 22.08% in 2015 to -1.51% in 2016, but it had boosted significantly from 11.34% in 2013 to 23.43% in 2014; therefore, it can be said that ROTE of Turkish Airlines is terrible for the investors to make further investment. On the other hand, ROTE of Oman Air was very poor to attract the investors and other stakeholders; furthermore, this company is unable to make additional profit from the investment in different sectors due to incurring extreme financial risks; so, Turkish Airlines is in a better condition; fig.6 demonstrates the result of ROTE graphically.
Return on Capital Employed
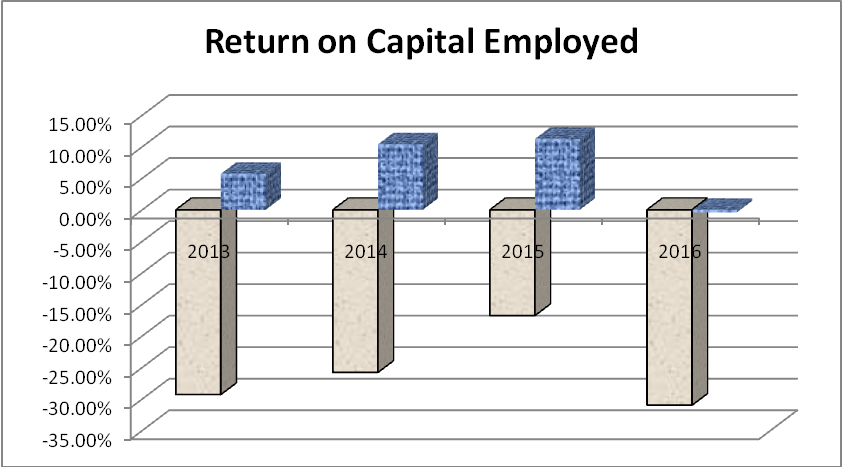
Table 6: Return on capital employed by Turkish Airlines and Oman Air. Source: Self-generated.
High ROCE is one of the most important indicators to assess whether the firm is profitable or not; however, it becomes hard for the aviation industry to achieve a greater percentage of the ratio due to adverse impact of the global financial crisis; in addition, Turkish coup d’état attempt in 2016 made the situation most awful to gain higher percentage. It is noticeable from the table above that Turkish Airlines had comparatively strong ROCE through this ratio of this company has drastically reduced from 11.25% in 2015 to -0.42% in 2016. On the other hand, table 6 shows that ROCE of Oman Air from 2013 to 2016 was -29.28%, -25.78%, -16.76% and -30.98% respectively, which demonstrates that Turkish Airlines was a more profitable company in 2016 in comparison with Oman Air; fig.7 demonstrates the result of ROCE graphically.
Efficiency
Debtor Turnover or Accounts Receivable Turnover
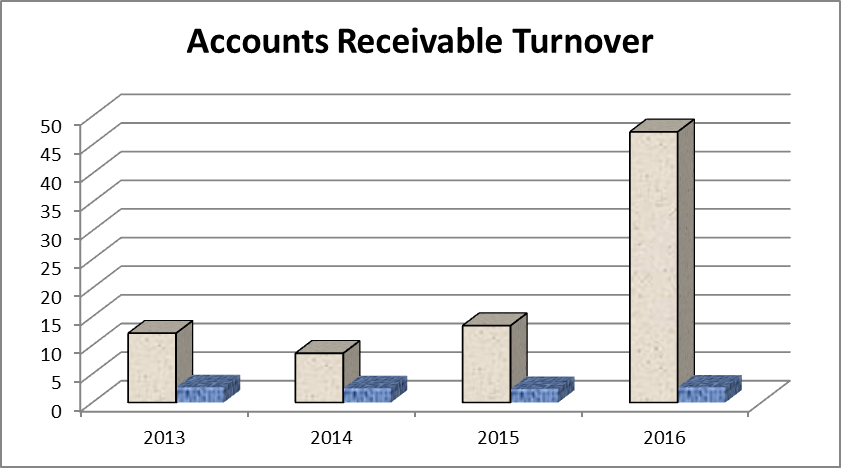
Table 7: Debtor Turnover of Turkish Airlines and Oman Air. Source: (Oman Air 2013, p.41; Oman Air 2015, p.28).
From the calculation and evaluation of the debtor turnover of both companies, it can be said that higher ART demonstrates lower efficiency level of Turkish Airlines and Oman Air (table 7); as a result, these companies need to redesign its credit policies to avoid further burden; fig. 8 shows the result of this ratio graphically.
Accounts Receivable Collection Period
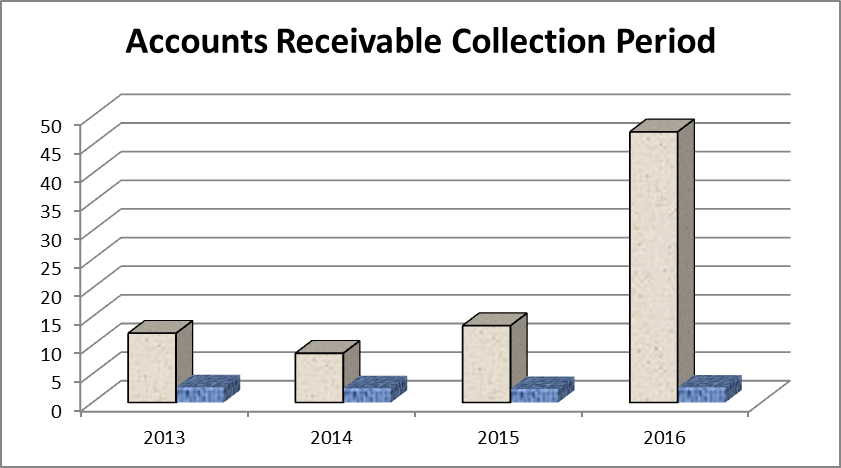
Table 8: Accounts receivable collection period of Turkish Airlines and Oman Air. Source: Self-generated.
ARCP represents a number of times it needs to gather the entire accounts receivable; however, Turkish Airlines had required the maximum time in 2015 in comparison to 2013; in contrast, ARCP of Oman Air has increased by 69.35 in 2016; thus, both airlines failed to collect accounts quickly; table 8 shows calculation and fig. 9 demonstrates graph of ARCP.
Creditor Turnover or Accounts Payable Turnover
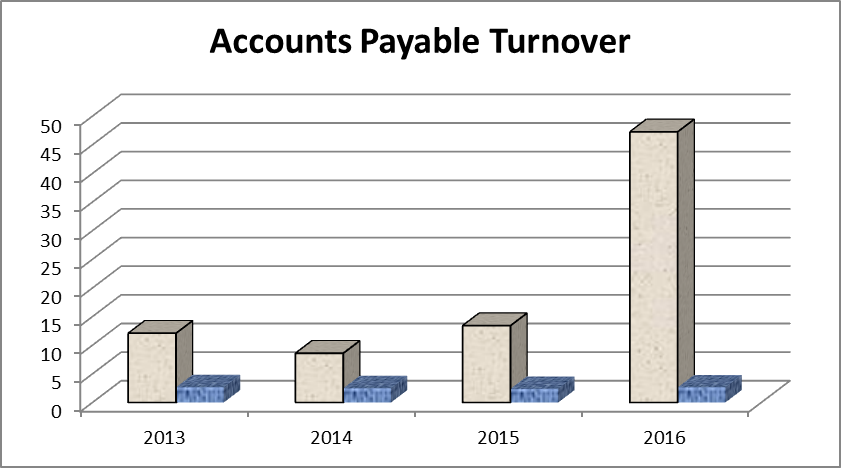
Table 9: Creditor turnover of Turkish Airlines and Oman Air. Source: (Oman Air 2013, p.41; Oman Air 2015, p.28).
It is notable from the calculation of table 9 that creditor turnover of Turkish Airlines is higher than Oman Air, which indicates Turkish Airlines could hold the finance for a long-time to spend for other sectors; thus, this company was in a better position than Oman Air; however, fig.10 shows this ratio graphically.
Stock or Inventory Turnover
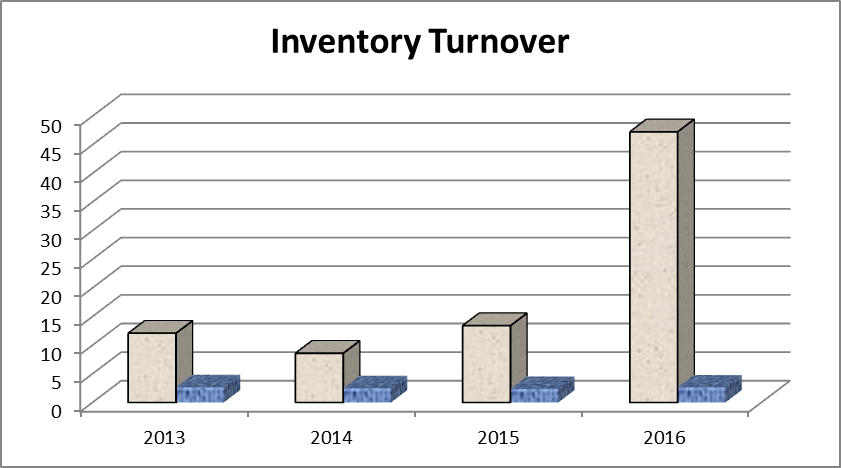
Table 10: Inventory turnover of Turkish Airlines and Oman Air. Source: (Turkish Airlines 2015, p.101; Turkish Airlines 2016, p.61).
The inventory turnover ratio of Turkish Airlines indicates that it was able to effectively handle the inventories in some extent; however, IR ratio has declined in 2016, which means this company needs to focus on further improvement of sales revenue (Table 10). Here, it is important to mention that Oman Air has capable of slightly developing this figure in 2016; however, fig.11 indicates the inventory management system of Turkish Airlines is better than Oman Air.
Asset Turnover
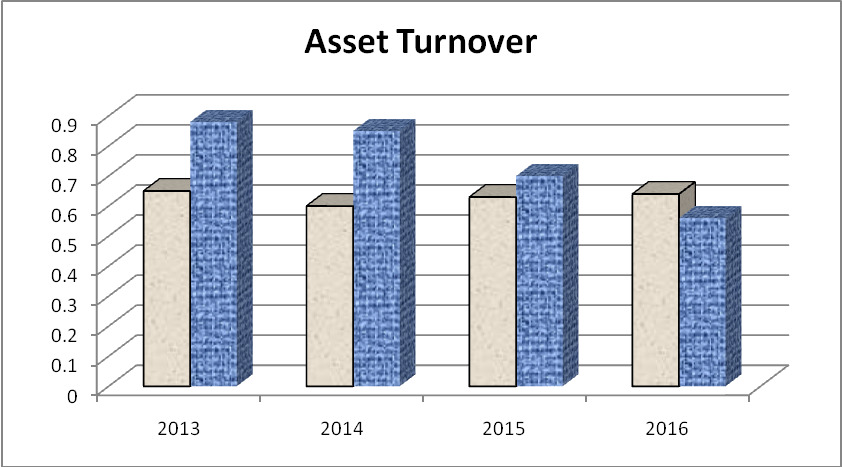
Table 11: Asset turnover of Turkish Airlines and Oman Air. Source: (Turkish Airlines 2014, p.5; Oman Air 2013, p.41; Oman Air 2016, p.52).
Generally, lower asset turnover represents weak financial condition of a company, but for the aviation industry, this result could vary around 1:0; here, table11 shows that this ratio of Oman Air from 2013 to 2016 was 0.65, 0.60, 0.63, and 0.64 respectively. In contrast, asset turnover of Turkish Airlines was 0.88 in 2013; however, fig.12 indicates Turkish Airlines is more efficient company than Oman Air.
Gearing Ratio
Capital Employed or Debt to Equity Ratio
Table 12: Capital employed by Turkish Airlines and Oman Air. Source: Self-generated.
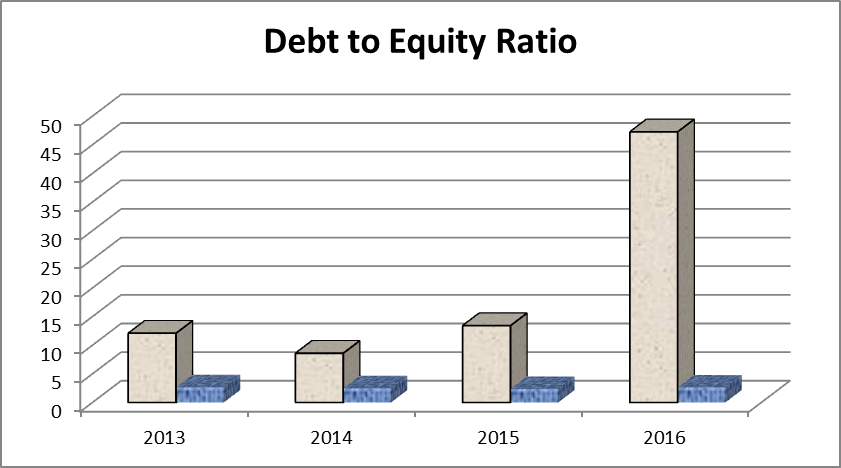
The main objective to calculate this ratio is to assess the long-term solvency and measure financial leverages of these airlines; however, the estimation of the debt to equity of Turkish Airlines demonstrates that it has used less debt as well as more equity to finance its growth (Myre 2015). Table 12 shows that capital employed of Oman Air from 2013 to 2016 was 12.1%, 8.58 %, 13.40% and -47.25% respectively; however, the negative result in 2016 indicates that Oman Air had negative equity of RO15835 thousand; therefore, it can be concluded that it has withdrawn more loan to buy assets through the actual price was less than the credit amount. However, fig.13 shows a debt to equity ratio for these two companies.
Interest Cover
Table 13: Interest cover of Turkish Airlines and Oman Air. Source: Self-generated
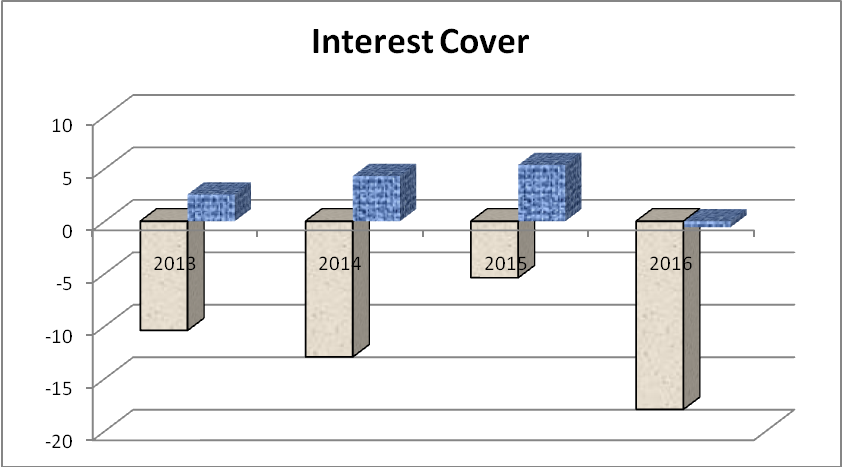
Table 13 shows that interest cover of Oman Air from 2013 to 2016 was -10.4%, 8.58 %, 13.40% and -47.25% respectively; however, it was unable to meet its interest payments; in contrast, Turkish Airlines was able to meet its interest payments; however, fig.14 represents the calculation of this ratio graphically.
Comparative and Trend Analysis Using Common-Size Statement
Horizontal Common Size Analysis (Using 2014 as a Base)
From the illustration and evaluation of the horizontal common sized profit and loss account, the percentage of sales had plummeted from -5.0% in 2015 to -6.9% in 2016, which was a negative indication for this airlines; therefore, the ratio of gross profit has dropped from -3.0% in 2015 to -46.0% in 2016. On the other hand, total operating expenses has decreased by 11.5% in 2015, but the management of Turkish Airlines has failed to perform up to the mark for which aggregate costs has increased by 18.2% in 2016; furthermore, COGS has also amplified by 2.8% in this period (Table 14). As a result, the percentage of profit before taxes has augmented by 34.5% in 2015; here, it is significant to note that the ratio of net income has decreased from 28.9% in 2015 to -107.1% in 2016, which illustrates that the performance of Turkish Airlines has fallen drastically due to sudden change of external or internal business environment.
Table 14: Common sized income statement sheet -horizontal analysis. Source: (Turkish Airlines 2016, p.8).
In accordance with the outcome of common sized income statement sheet (horizontal analysis) of Oman Air, the percentage of sales had plummeted from 14.5% in 2015 to 1.0% in 2016, which was a pessimistic sign for this company; on the other hand, the ratio of COGS has increased from 5.8% in 2015 to 10.9% in 2016 (table 15). As a result, the percentage of operating loss had risen from -31.1% in 2015 to 80.7% in 2016; however, it is important to mention that total operating expenses of Oman Air had successfully lessened by 111.4% within a year; however, the ratio of net loss has increased by 71.6%.
Table 15: Common sized income statement sheet -horizontal analysis. Source: (Oman Air 2014, p.31).
Vertical Common Size Analysis (Using Total Assets as a Base)
According to the result of common sized balance sheet (vertical analysis with assets) for Turkish Airlines, the percentage of cash has increased by 2.4% with a year and the ratio of total non-current assets has amplified from 69.7% in 2015 to 72.9% in 2016. On the other hand, the percentage of short-term borrowings and current long-term liabilities has amplified significantly from 6.3% in 2015 to 13.1% in 2016; in addition, table 16 demonstrates that the ratio of total non-current liabilities has enlarged by 2.1% within a fiscal year.
Table 16: Common sized balance sheet – vertical analysis with assets. Source: (Turkish Airlines 2016, p.8).
From the details of common sized balance sheet (vertical analysis with assets) for Oman Air, the percentage of important non-current assets such as aircraft, property, plant and equipment has reduced from 82.0% in 2015 to 72.4% in 2016; in contrast, trade and other receivables has increased from 9.1% in 2015 to 15% in 2016 (table 17). It is significant to note that the percentage of total non-current liabilities has decreased slightly, but the ratio of total current liabilities has enlarged from 34.8% in 2015 to 45.3% in 2016; therefore, Oman Air is in awful economic environment to achieve annual growth.
Table 17: Common sized balance sheet – vertical analysis with assets. Source: (Oman Air 2016, p.28).
The evaluation of performance of Turkish Airlines
To evaluate the performance, this report uses the ratio analysis for the last four years and comparative common sized balance sheet and income statements analysis for the year 2015 and 2016; however, table 18 and table 19 give more information-
Table 18: Evaluation of performance of Turkish Airlines using financial measures. Source: Self-generated.
Table 19: Evaluation of performance of Turkish Airlines using non-financial measures. Source: Self-generated.
Recommendations
- From the analysis of the current ratio and acid test ratio, it has identified that Turkish Airlines and Oman Air were not able to utilize short-term finance or pay the short-term debts since current liabilities were not covered by means of their current assets; in this circumstance, these companies should introduce an effective cash management system;
- Though Turkish Airlines was able to achieve a better net profit margin than Oman Air, but it failed to reduce total operating expenses; in this context, it should concentrate more on the cost reduction mechanism in order to minimize financial risks in the future.
- This report only concentrates on the ratio analysis and comparative vertical balance sheet and horizontal income statements of both companies, but this paper has not scrutinized the external and internal factors those influenced financial performance these airlines; therefore, the management of these airlines need to invest more to research on market to identify main challenges. Proper identification of the barriers will help these airlines to make financial decisions to overcome from such vulnerable position;
- The auditors of Oman Air should recognize and evaluate the risks of material mismanagement of the balance sheet and income statements; in addition, it should ensure the appropriateness of accounting policies, and should disclose financial information correctly in order to avoid financial risks and establish control over the financial management system;
- At the same time, asset turnover ratio, and debt to equity ratio illustrate that the financial position of these airlines was not in satisfactory level; therefore, the management of these airlines should diversify funding sources, change price of services, ensure proper use of existing resources, reduce operating and other costs, and monitor performance of the human resources and so on.
Conclusion
From the calculation and evaluation of the ratio analysis, it can be concluded that Turkish Airlines and Oman Air made losses for the adverse impact of global financial crisis of 2008; moreover, the geopolitical and financing challenges made it difficult for these industry players to minimize financial risks and make profits. This report compares the financial performance of Turkish Airlines and Oman Air using some important ratios such as current ratio, net profit margin, asset receivable turnover, debt to equity ratio and so on; however, the result of these ratios demonstrates that the financial health of Oman Air was very poor. Though the financial performance of Turkish Airlines is comparatively better than Oman Air, but important indicators and trend analysis reveals that percentage of net profit margin has dropped radically in 2016; therefore, it failed to perform up to the mark.
Appendix 1: Figures
Gearing Ratio
Appendix 2: Table of calculation for Turkish Airlines
Source: Self-generated.
Appendix 3: Table of calculation for Oman Air
Source: Self-generated.
Reference List
Higgins, R 2015, Analysis for financial management, 11th edn, McGraw-Hill Education, New York, NY.
Myre, M 2015, An analysis of airline’s financial performance and its influencing factors, Bachelor’s Thesis, Aarhus University, Web.
Oman Air 2013, Oman Air’ annual report for 2013, Web.
Oman Air 2014, Oman Air’ annual report for 2014, Web.
Oman Air 2015, Oman Air’ annual report for 2015, Web.
Oman Air 2016, Oman Air’ annual report for 2016, Web.
Turkish Airlines 2014, Financial statements of Turkish Airlines, Web.
Turkish Airlines 2015, Turkish Airlines’ annual report for 2015, Web.
Turkish Airlines 2016, Turkish Airlines’ annual report for 2016, Web.
Turkish Airlines 2018, Financing, Web.