Introduction
The purpose of this paper is to examine, evaluate, and underline the financial and market position of Turkish Airlines, which is a major service sector company in the relevant industry. This research has highlighted the financial conditions of the company by using the most recent data available from the annual report of Turkish Airlines, textbooks, and academic journals in order to come up with the future trends, apposite benchmark, cross-sectional industrial analysis, horizontal and vertical analysis, and SWOT analysis of the business. To support the project report, this paper has also presented an industry analysis, activity analysis, scrutiny of the liquidity position, solvency, and debt management analysis, and profitability analysis for Turkish Airlines, which would offer readers an in-depth perception of the business, and assist the relevant stakeholders in making the investment decisions.
Background of Turkish Airlines
The Ministry of National Defense established Turkish Airlines in 1933 and it is the national flag carrier of Turkey; the Privatization Administration owned 49.12% share and publicly traded more than 50.8% share; at present, it is the fourth-largest carrier in the world (Turkish Airline, 2016). This company provides services in 119 countries with 298 destinations all over the world; in 2016, it had 334 aircraft and it intends to increase this number by 164 within the next 6 years (Turkish Airline, 2016). According to the annual report 2016 of Turkish Airlines, this company has been passing a challenging period because the fuel price increased by 20%, and boosted overall competition in the global industry; thus, its total revenues decreased by 6.9% in 2016 and it has experienced a significant loss, for instance, net profit and EBIT decreased by 107% and 116% respectively. However, figure 1 gives more information on this aspect.
The total number of the passenger was 39.045 thousand in 2012 and this figure increased by 23714 thousand within the last four years; however, figure 2 gives more information in this regard.
Table 1 provides more information about this airline-
Table 1: Profile of Turkish Airlines. (Turkish Airlines, 2016).
In order to get a better overview of the company, it is necessary to evaluate the return on assets (ROA) and return on equity (ROE) of the firm, so that a clear glimpse of its present performance can be assessed. It is essential to note that ROA demonstrates the percentage of income a business generates with respect to the corporate reserves and is usually characterized as the net income divided by the total-assets; as a result, net- income is obtained from the financial statements of the business and is calculated from the profit following the taxes and duties. The corporate assets must consist of funds and cash equivalent things, like resources, machineries, stocks, receivables, properties, as well as the actual worth for the intellectual properties (like copyrights, patents, and others); moreover, ‘goodwill’ is included in the list, since the additional wealth rewarded to the business on top of its real book-value should also be taken into account. Since assets are likely to fluctuate in due course, most businesses use an average of the total corporate possessions; as a result, the return on total assets for one-quarter must be calculated from the net income for the period, divided by the average-assets during that period; consequently, even though ‘return on assets’ is a ratio, it is typically represented as a percentage. Table 2 provides calculations for ROA-
Table 2: ROA of Turkish Airlines.
It is arguable that an elevated percentage of ‘return on assets’ represents that the company is profitable, and is getting stronger with time – but for capital-intensive companies, it is truly tough to attain a higher percentage of the ratio. It is noticeable from the table above that Turkish Airlines had a comparatively strong ROA in 2012, 2015, and 2014, although it had dropped a bit in 2013 (Morningstar 2017). However, in 2016, for some unknown reasons, the company had failed to perform up to the mark, and as a result, there was a huge unexpected fall in the ratio. Such an unforeseen drop can be seen as potentially dangerous because the profit after tax has declined significantly during the period, indicating that the company’s capacity to monetize its assets has declined all of a sudden.
The ratio of return on equity is an indication of the productivity of the business, which determines how much money the corporation has engendered with the equity of the shareholders; as a result, return on equity is not just an evaluation of the money-spinning capacity of the firm but is also the quantification of its efficiency level. An escalating ROE indicates that the firm is expanding its aptitude to engender income without having to exhaust all the capital resources; in addition, this also suggests that the firm’s administration is organizing the capital from the shareholders brilliantly; as a result, an elevated ROE is a good signal for the business, whilst a decreasing ROE is typically a setback. Table 3 shows the calculation of ROE-
Table 3: ROE of Turkish Airlines (Turkish Airlines 2014, p. 6 and Turkish Airlines 2016, p. 7).
Trend Analysis and Relevant Charts
It is notable from the above calculations that the return on equity was quite lucrative in 2012, 2014, and 2015 for Turkish Airlines, although it had dropped by half in 2013. However, in 2016, just like the abrupt and unexpected fall in the percentage of the return on assets, the percentage of the return on equity had also dropped to a great extent for some unanticipated reasons. This type of surprising plunge in the two most imperative ratios is not just alarming for the internal trading environment of the firm but is also an issue of fear for the investors of the company. However, table 4 shows operating cash flows-
Table 4: Operating cash flows (Morningstar 2017).
Net-profit from operations is a measurement of earnings, which does not include the expenses or tax-benefits of debt funding; it is suggested that this calculation merely considers the earnings before interest, and is a vital evaluation in the scrutiny of a company, as it allows an apparent sight of the functional efficiency (an observation not obscured by the business’s ascendancy). It can be comprehended from the table above that the net profit from operations of Turkish Airlines has fluctuated to a great extent throughout the last five years. For this Turkish market player, the net profit from operations was 657 in 2012, but it dropped to 357 in 2013 before rising to 845 in 2014 again (Morningstar 2017). Subsequently, the company performed wonderfully in 2015, for which its net profit from operations rose to 1,069, but then all of a sudden, it plunged to 77 in 2016, which indicates abrupt poor corporate performance.
Retained Earnings (RE)
Retained earning is chiefly the income that a business has generated, minus the dividends rewarded to the shareholders; it is necessary to argue that when the retained earnings are high, this would indicate that the business is economically strong; on the other hand, firms that have made fewer profits and more losses suffer from a negative balance (or accumulated deficit). Table 5 shows the calculation of retained earnings –
Table 5: Retained earnings (Turkish Airlines 2014, p. 6 and Turkish Airlines 2016, p. 7).
It can be seen from the table above that the retained earnings of the company have improved significantly in 2015. This is a very positive indication because the retained earnings of Turkish Airlines have been increasing gradually throughout the last five years. To be precise, the retained earnings were 903 in 2011, 1357 in 2012, 1714 in 2013, 2559 in 2014, and 3628 in 2015.
Debt Ratio
Businesses that have an elevated debt ratio are reasonably weak because this indicates that they possess a large amount of debt in comparison to their assets; in addition, such a situation suggests that the firm has been troubled by huge burdens, whilst the finances invested on interests are huge, putting a negative impact over the cash flow of the corporation. Table 6 shows the calculation of debt ratio-
Table 6: Debt ratio (Turkish Airlines 2014, p. 6 and Turkish Airlines 2016, p. 8).
It can be seen from the above calculations that the debt ratio has sharply risen in 2016, which can be detrimental towards the reputation of the business. In such situations, the investors usually become reluctant to keep their trust on the business, which can be a stressful scenario for the future growth of the firm.
Earnings per Share (EPS)
It is essential to note that the earnings per share of the company have reduced significantly in 2016, which means that now the shareholders will be discouraged to buy the company’s shares because EPS shows the profitability of a corporation. As a result, the company must identify the root cause behind the drop in the earnings per share and employ its highest effort in improving this in order to gain back the confidence of the shareholders in the upcoming years. Table 7 shows the calculation of EPS of Turkish Airlines-
Table 7: EPS of Turkish Airlines (Turkish Airlines 2016, p.7).
Market Capitalization
Market capitalization is an indication of the market value of a firm’s outstanding shares; it is notable from the table above that the market values of the Turkish Airlines were 7,512 TRY in 2012, 8,887 TRY in 2013, 13,289 TRY in 2014, 10,198 TRY in 2015, and 6,914 TRY in 2016. This means that the market values of the firm’s outstanding shares were the highest in 2014 and 2015 respectively, but were lower in 2012 and 2013. However, it became the lowest in 2015, which means the market values of the company are plummeting – this can cause a real panic amongst the stakeholders of Turkish Airlines.
SWOT Analysis of Turkish Airlines
Strengths
- Brand image: Long experience and most valued brand awareness of Turkish Airlines is the main competitive advantages of this company since it provides high-quality flying experience; in addition, as the National Flag Carrier of Turkey, it has the capacity to hold its leading position in the domestic market (Myre 2015);
- Loyalty: The customer satisfaction rate of this company is too high; therefore, it has a large loyal customer base both in domestic and international destinations, for instance,
- Flight network: According to the annual report 2016 of Turkish Airlines, it successfully operates almost 119 countries and 298 destinations; furthermore, it has a large fleet size;
- Strategy: Outstanding promotional and marketing strategies play a significant role to increase market share in the European market (Sahin 2015); as a result, it becomes one of the largest companies in the aviation industry;
- Training: It has more than 24,124 employees who are skilled, high-qualified, trained, and experienced person; however, Turkish Airlines had already taken many initiatives to increase team spirit to get better performance from them;
Weaknesses
Operating costs: According to the financial report of this company, it is one of the main challenges to control operating expenses while it adversely affects the overall financial performance; moreover, it pays a comparatively high payment to their staff and board members; here, table 8 demonstrates data for three years-
Table 8: Total operating expenses of Turkish Airlines (Turkish Airlines (2016, p.4).
- Pricing strategies: Turkish Airlines seek price more than other major competitors for which are of market share low cost domestic and international companies is increasing (Myre 2015);
- Route: As it uses Ataturk Airport for most of the flights, passengers of the opposite side may prefer service of other companies;
- Other operating weaknesses include a low focus on the issues related to corporate social responsibility, restricted cold beverages, increase customer hassle rate due to poor online service, unusual financial risks for merger and acquisition, dependence on technology, and so on.
Opportunities
- Market leader: International traffic is rising faster (Santos, and Creighton 2014); thus, it has the opportunity to advance reputation as a global air carrier and to be the market leader in the aviation industry;
- Affiliates and Subsidiaries: It has two directly owned and nine jointly owned subsidiaries, which assist to widen the service of the Turkish aircraft industry;
- Open the third airport at Istanbul: It has the opportunity to turn it into a significant flight hub;
- Demand: As demand is increasing, it has scope to start the journey to new destinations in Europe and Asia; however, the high population of this country is also an important issue for this company;
- Unique offers: Turkish Airlines has the capacity to provide quick and quality service with high satisfaction of the passengers and other clients (Santos, and Creighton 2014);
- Other factors: it has scope to generate more revenues due to the development of the national tourism sector; however, other potential factors include an adaptation of modern governance principles, no visa requirement in the different geographical zone, sound economic condition for further business expansion, and so on;
Threats
- Competitors: The market share of international low-cost airlines is rapidly increasing; therefore, these companies enter destinations of Turkey due to a liberal business environment and capture a significant part of the domestic market share.
- Recession: At the time of the global financial crisis, the tourism revenues of Turkish Airlines have decreased and operating costs have increased, which directly affected the performance of the company; as a result, it needs to observe the financial condition of the countries where it is operating to design strategy.
- Other: Many other external factors may create a hassle for this company, such as pricing structure and promotional strategy of the competitors, the Swine Flu virus, and risk of terror attacks, the chance to lose domestic market share, the volatility of fuel price, natural crisis, boost ticket costs, and so on.
Comparative Cross-sectional and Aviation Industry Analysis
The aviation industry has been suffering from insufficient profitability for the last several decades, but rather than reducing the capacity, the industry players are continuously investing for further capacity expansion and such a difficult scenario has identified by plotting ROCE and WACC of publicly listed 69 aviation companies who jointly own 70% of global aviation market (Wojahn 2012, p. 3). This has been illustrated in figure 3:
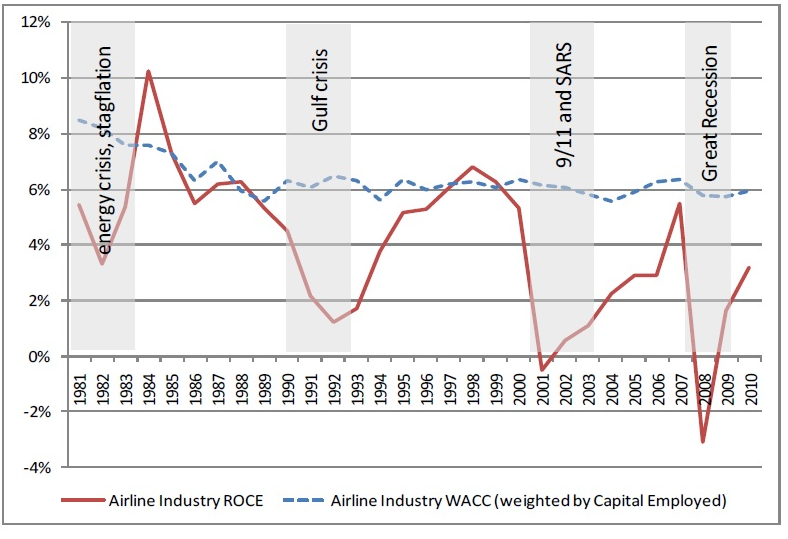
The above figure demonstrates that irreconcilable difficulties of the aviation industry for thirty years (1981 to 2010) that the industry generated expected profit in 1994 and next five years the industry was capable to generate profit at the level of ‘cost of capital’ and the rest years except 2000 aviation companies were unsuccessful to generating cost of capital. The most conflicting nature of the aviation industry that the companies continuously increase their capacity although the existing capacities are unutilized, for instance during the recession of 2009 the industry increased its capacity globally up to 1%; thus it would be questioned why the investors allocate for the expansion of such industry or why the aviation operators utilize big resource for insufficient return from this market.
The major reason for investment for continuous expansion without sufficient return is that the ownership, operation, and control of the publicly listed companies are different from each other’s while the managers make investment decisions for the greater interest of the shareholders of concerned companies. Another reason of this dilemma is that unutilized overcapacity of the aviation industry derives comparatively less barrier of entry, but very high obstruction for exit due to the irreconcilability huge fixed cost, if an unprofitable aviation company wants to cut capacity due to deteriorating economic condition, it would adversely impact on the remaining operation. There is less mobility among the aviation industry, even if an aviation company turned into bankrupt, the capacity would not be forced to reducing and the bankrupt companies continue their operation just like other operators in the industry (Wojahn, 2012, p. 2).
Due to such deregulation of the industry and the aggressive interactions among the customers and firms has identified the requirement of some adjustment of the business model within the industry where the full-service carriers (FSC) are under serious threats new orientation of the players (Vidović, Štimac, and Vince 2013, p. 87); this has been illustrated in figure 4:

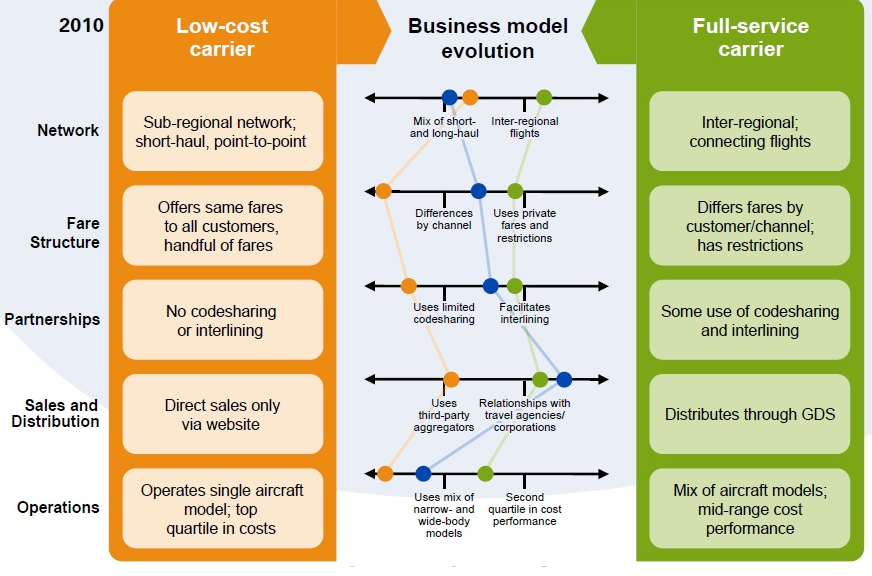
Low-cost carrier (LCC) has revolutionized and liberalized the aviation industry during the seventies in the European market and now globalize with Ultra Low-cost carrier (ULCC) for a significantly lower price that generated further shock for the Full Service Network Carrier (FSNC) (Vidović, Štimac, and Vince 2013, p. 69). Due to half of the price charging from passengers than the FSNC, lower operating cost and different strategies than traditional airlines, the LCC are exploring their operation routes, and segments like chartering, long-haul, and even cargo sector where merger, acquisition, alliance provided them additional scope to explore.
Horizontal Analysis Tables of the Financial Statements
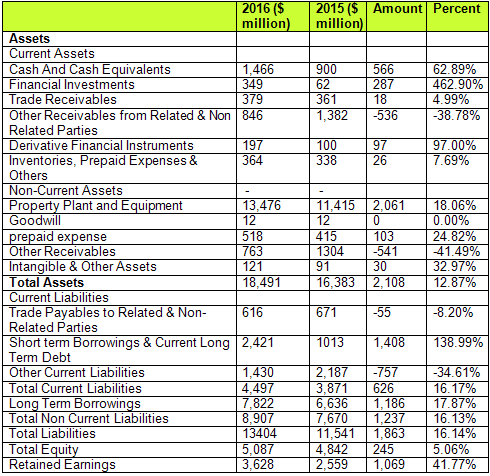
Horizontal -Comparative Balance Sheet
The horizontal comparative balance sheet has been provided in table 9:
Horizontal -Comparative Income Statement
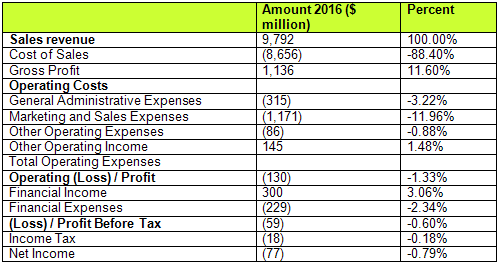
The horizontal comparative income statement has been provided in table 10:
Table 10: Horizontal comparative income statement (Turkish Airlines 2016).
Vertical Analysis Tables of the Financial Statements
The balance sheet as been provided in table 11:
Table 11: Balance sheet (Turkish Airlines 2016, p.8).
Vertical Analysis Comparative Income Statement
Table 12 contains the vertical comparative income statement:
Trend, Cross Sectional and Financial Ratio Analysis
Liquidity Analysis
Current Ratio
Table 13: Current ratio.
It should be noted that this ratio shows a firm’s capacity to reimburse the short and long-term debts of a business; however, from the above calculations (in table 13), it can be deduced that the liquidity position of Deutsche Lufthansa AG was the strongest in 2016 in comparison with Turkish Airlines and Pegasus Airlines (Lufthansa 2017). Even though the current ratio of Turkish Airlines has dropped slightly last year, the drop in case of Pegasus Airlines was significant.
Working Capital
Table 14: Working capital (Lufthansa 2017, p. 12).
Working capital determines the competence as well as the short-term fiscal strength of the businesses – in case of Turkish Airlines, the working capital has increased from 725 in 2015 to 896 in 2016; however, rising working capital is a bad indication as this could mean that the company is not investing its surplus cash. The working capital of Pegasus Airlines has declined from 842 in 2015, to 421 in 2016, which means that this company’s performance and efficiency has increased (as shown in table 14); on the other hand, the position of Deutsche Lufthansa AG has improved in 2016 as well.
Quick Ratio
Table 15: Quick ratio.
Quick ratio shows the firm’s ability to fulfill its short-term monetary burdens; if this ratio is more than one, the company can adequately pay the short-term liabilities, whereas an elevated ratio would indicate strong fiscal security of the firm – in case of top two competitors of the airlines industry, the quick ratio has plunged considerably (table 15). However, in this instance, the position of Turkish Airlines is better than Pegasus Airlines, whereas with a slight rise in the ratio in 2016, Deutsche Lufthansa AG is in a stronger position.
Activity Analysis
Inventory Turnover Ratio
Table 16: Inventory turnover ratio.
The inventory-turnover ratio indicates whether a firm is able to effectively handle the inventories, and a larger ratio means that the sales of the firm was strong; it can be noticed from the table above that Turkish Airlines has been able to slightly improve this ratio in 2016 in comparison to 2015 (table 16). However, the position of both Pegasus Airlines and Deutsche Lufthansa AG is quite poor in this instance, as for these company, the ratio has declined from 2015 to 2016.
Solvency and Debt Management Analysis
Debt-to-Equity Ratio
Table 17: Debt-to-equity ratio.
If debt-to-equity ratio is high, this indicates that the firm remained forceful in funding its expansion with debt; however, such activities are usually related to extreme level of risk, which could cause unstable income due to extra interest-expense – in case of all three competitors of the airlines industry, this ratio has increased in 2016 in comparison to 2015 (table 17). However, the rise in case of Pegasus Airlines was the highest, whereas for Turkish Airlines and Deutsche Lufthansa AG, the increase was milder (Pegasus Airlines 2017, p. 6).
Long-term Debt-to-equity Ratio
Table 18: Long-term debt-to-equity ratio.
When it comes to long-term debt-to-equity, a higher ratio shall point towards a higher ‘leverage’ – usually, firms with elevated long-term debt-to-equity ratios are considered more hazardous; as a result, it can be argued from the table above that in 2016, the position of Deutsche Lufthansa AG was much better than that of the other two competitors. The long-term debt-to-equity ratio for Pegasus Airlines augmented severely in 2016, but Turkish Airlines is comparatively in a better position (table 18).
Times-interest Earned (or Coverage) Ratio
Table 19: Interest coverage ratios.
This ratio shows the firm’s capability to pay its debts, and elevated ratios are more secure because poorer ones could mean credit risks; moreover, the investors are also keen to assist firms with stronger ratios; therefore, it can be argued from the calculations that Deutsche Lufthansa is in the best condition when it comes to the time-interests earned (table 19). In addition, the position of Turkish Airlines has enhanced in 2016 as well, but Pegasus Airlines is rather in a volatile situation (Pegasus Airlines 2017, p. 7).
Total Debt-to-total Assets
Table 20: Total debt-to-total asset.
When it comes to total debt to total assets, a larger ratio would mean more financial risk; as a result, the firms must persistently try to keep this ratio lower each year in order make sure that the leverage is in control and the creditors are contented with the corporate performance. For some unforeseen reasons, most companies in the airlines industry have confronted a rise in this ratio; therefore, both Turkish Airlines and Pegasus Airlines have faced an augmentation as well (table 20).
Profitability Analysis
Gross Profit Margin
Table 21: Gross profit margin.
GPM in an important indication of profitability that allows investors to determine a number of things; this shows the economic achievement from a good or service, and a higher margin is usually seen as rewarding; as a result, it can be stated from the table above that the position of Deutsche Lufthansa is the best in case of the GPM. However, both Turkish Airlines and Pegasus Airlines have faced a fall in this percentage in 2016, whilst Turkish Airlines is in the worst condition (table 21).
Net Profit Margin
Table 22: Net profit margin.
If NPM is higher, the business is more cost-effective, and has greater control on the expenses; therefore, shareholders keenly observe the NPM since it says whether the firm can convert its turnover into profits; here, both Pegasus Airlines and Deutsche Lufthansa AG is in a good situation, although Turkish Airlines has failed to boost the NPM in 2016 (table 22).
Total Asset Turnover
Table 23: Total asset turnover.
Higher total asset turnover means stronger corporate performance; as a result, it can be concluded that all of the competitors considered in the calculations above have faced a fall in this indicator, which means they have failed to perform up to the mark (table 23). However, this fall may be related to external adverse conditions of the airlines industry as well, and so Turkish Airlines must apply innovative strategies to overcome the situation.
Recommendations
The horizontal analysis tables of the financial statements represents that Turkish Airlines had failed to perform up to the mark and experienced unexpected loss in 2016; in this circumstance, the board of directors and other members need to conduct more research to identify major external and internal problems to minimize financial risks.
Comparative balance sheet and income statements show that this company able to control operating costs in some extent but sales revenue decreased by $730 million though the total number of passengers increased in 2016; therefore, the management of this company should review its long-term strategies in order to generate more revenue from diversify business operation.
As current and quick ratios are below industry average, this report recommends the management of Turkish Airlines to concentrate more on the improvement of current assets; however, the comparative cross-sectional analysis shows the performance of this company is better than the performance of Pegasus Airlines. The investors and management should focus on the following issues-
- It should cut unnecessary expenses to improve financial outcomes;
- Increase efficiency level by coordinating tasks of the affiliates and subsidiaries;
- It should follow growth strategy to gain competitive advantage over competitors;
Conclusion
From the result of calculation and ratio analysis, it can be concluded that the percentage of the return on equity and assets had dropped dramatically in 2016, which is a significant matter of fear for the investors of Turkish Airlines. Horizontal and vertical comparative balance sheet and income statements show that financial condition of Turkish Airlines was not in stable position in 2016, but other indicators and trend analysis demonstrates that it was a highly profitable company in 2015; however, it has capacity to pay the short-term liabilities and it has low credit risks.
Reference List
Lufthansa, 2017, Financial statements of Deutsche Lufthansa AG, Web.
Morningstar, 2017, Growth, profitability and financial ratios for Turkish Airlines. Web.
Myre, M 2015, An analysis of airline’s financial performance and its influencing factors, Web.
Pegasus Airlines, 2017, Financial statements of Pegasus Airlines.
Sahin, D 2015, SWOT analysis of Turkish Airlines.
Santos, D & Creighton, T 2014, Strengths, weaknesses, threats, opportunities SWOT analysis of Turkish Airlines.
Turkish Airlines, 2014, Financial statements of Turkish Airlines, Web.
Turkish Airlines, 2016, Turkish Airlines’ annual report for 2016, Web.
Vidović, A, Štimac, I & Vince, D 2013, ‘Development of business models of low-cost airlines’, International Journal for Traffic and Transport Engineering, vol. 3, no.1, pp.69-81.
Wojahn, O 2012, Key policy issue explaining over-capacity in the airline industry, Web.