Introduction
Statistics has been applied in major attributes of human life Thus it has been deemed of paramount significance for students especially in major areas that impact on human existence to have a strong statistical and analytic background. The essay thus is a close statistical examination of education based on four different areas. The essay seeks to establish the relationship between gender and education, parental education and education of respondents. On the same note the research paper discusses differences that might exist as well as establishes which parent has the strongest effect on the educational level of the respondent in that order. Additionally the characteristics of the sample are provided (Smith, 1997).
Similarly, the analysis of the data seeks to establish if there is a linear relationship between age and education. Additionally, the question on whether or not it is possible to predict education level on the basis of age is of interest. Lastly, the association or link between marital status and education is to be found out; this is to answer the question, Do singles or married persons tend to be more highly educated?.
Education
It has come to the notice of researchers interested in education that both genders is impacted by a group of factors that may directly or indirectly either in isolation or combination impact on how these individuals attain education. Conclusions arrived after studies done are mixed. Gender imbalance is still seen in education which takes the form of subject preference as well as performance. Other factors such as social-economic status, race as well as minority status augment gender and such as parents’ level of education in contributing to differences in education level between males and female especially in developing countries (Smith, 1993).
For this reason, proposal have been forwarded to relevant authorities to come up with strategies aimed at helping individuals from poor background to come out of illiteracy. It is worth noting that some of the initiatives put in place have yielded fruits especially in America. Currently women have landed jobs in fields that were initially dominated by men such as medicine, engineering and even head of different states. This has completely changed the notion that the society had in the roles that women should play in their marriage life (Schuster, 2009). They are also able to cater for their family as well as fully covered by law as men are making them to have equal share in the family and in the national matters.
Sample characteristics
When analyzing the demographic characteristics of the sample n=1419 age, highest degree, highest year of school, sex/gender, marital status of the respondent were analyzed. Similarly, highest year of school completed for both parents-mother and father of the respondent were computed. In that order, there were 2, 8, 4 0, 0, 226 and 442 missing data (Table 1). Out of 1419 respondent 43.8% representing 622 individuals were male while 56.2% which is 797 were female (Fig. 4).
Concerning marital status, those married were 44.5% (631), widowed 9.9% (140), divorced 16.2% (230), separated 4.0% (57), and those are never married constituted 25.4% (361) Table 2. Regarding the highest education level of the respondent 17.1% (243) had less than high school, 51.1% (725) had high school, 7.1% (101) junior college, 16.6% (236) bachelor holders, 7.5% (106) were graduate, 0.1% did not know, and 0.5% stated not applicable. Majority of the respondents are less than 54 years. For that matter, Fig. 2 clearly depicts that age distribution is skewed to the left. Thus it is no doubt that most of the respondent are between age 18 and 54 years old.
Table 1 Marital status of the respondents.
Table 2 Computation for missing data
Education and Gender
To establish the relationship between education and gender, a correlation analysis is carried out as it is capable of exploring relationship between two numerical variables. Having in mind that one of the variable, education degrees is nominal, then Spearman’s Rho will be used. It will thus help establish if the relationship is linear, additionally it will provide the strength as well as direction of the association. From the correlation analysis, the association between the two variable is negative and very weak, ρ=-0.062. However, the relationship is statistically significant ρ=-0.062, p=0.021<0.05.
The results thus suggest that higher or lower level of education is influenced by gender of the respondent. However, the weak negative relationship seems to suggest that there are other variables other than gender that influence the degree of education. The later can be explained by what Flores & Ojeda, 2006 found out, that perceived barriers to attaining education might be playing a bigger role above gender, level of generation as well as the level of parents’ education level. The finding just suggests that there is a relationship but to give more insight on the same, there is need to carryout cross-tabulation analysis.
From the analysis it is apparent that a greater percentage of female respondent have less than high school, attained high school, junior college and bachelor education level as compared to men. The percentages standing at 57.6% vs 42.4%, 58.1% vs 41.9%, 58.4% vs 44.5% in that order. However majority of the men respondent are graduate, 62.3% as compared to their female counter part, 37.7%. a general over view shows that a greater proportion of female have an equivalent or less than junior college as compared to male. Similarly a majority of male have attained bachelors and above level of education compared to women (Fig 3).
To confirm the finding of correlation, there is a significant difference in between the two variables, V=0.107, X2(4) =16.132, p=0.003. However the association is very weak, V= 0.107 although in this case a positive one. The finding thus is in line with that of Dalen, 2003 that through affirmative action majority of women found their way to learning institution but due to other reason, a good number of men usually two-thirds continue to attain bachelors’ level of education compared to a third of female.
Based on the findings here in it is evident that the number of female aspiring to further their education is growing. Within a short period provided the efforts being put in place to encourage them to pursue education, I believe the case ill change to what it is currently in the United States of America. Generally, in U.S.A, the number of female that have completed secondary as well as post high school education have tremendously increased reversing the trend in which male were always in the fore front. It is worth noting that the rates of dropping out of school for male and female in America stood at 10.0% and 8.0% respectively.
Statistics show that the number of women attaining higher education level have improved as 62.0%, 58.0%, 60.0% and 49.0% obtained associate degrees, bachelors degree, masters degree and doctorate in that order. A lot of campaign was staged all over the world to ensure that women start appreciating themselves. Pictures were used showing them cycling, driving automobiles and doing men dominated jobs. Positive response started being reported as most of the women changed their life styles from their mode of dressing as most of them get to education sectors.
The revolution in the education of women in the twentieth century developed to higher heights. Especially after the Second World War, the government in various countries encouraged their women to participate in the education sector by use of media and supporting women organizations that helped the women to access education easily. This in turn increases the number of the female who were working in formal and informal sectors thus being able to support their family. It is seen that in 1951, 31% of the women in United State were working. This figure has been increasing around the globe making their marital status not to be dominated by male ideas as they can also make decisions
It is worth mentioning that the existing differences between male and female in terms of education level can be attributed to the findings of Flores & Ojeda, 2008. These researchers established that other factors such as social economic factors, generation level, parents’ level of education to mention but a few influence the highest degree of education individuals attain. The analysis clearly indicates from a sociological point of view that educational system did not provide both sexes with opportunities to move upwards hence a kind of sex discrimination that have over the past hundreds of years negatively affected individuals in social setting.
According to Fields, 2009 a step was taken further to ensure that women education is recognized in some states. This is seen in the attempt of US government modifying common law to give women power in their legal documents. The women were made to have control in inheritance and were offered more privileges that were come about due to education. Education seemed to lead their marital status to another direction where in some countries women were given they were made to win a joint share in giving children custody after divorce. The education also changed the issue of the women being homemakers as they migrated to different places in search of formal jobs.
However, the analysis shows that all is not lost as the efforts taken by the relevant stakeholders such as government in encouraging girl-child education through various ways is attributed to the trend that is almost reverse. There are more females graduating from various level of education as compared to men. It is important to note that the finding herein is contrary to what Schuster, 2009 found. They explored the link between education attainment and as well as various factors deemed to influence the former and they found out that gender as well as mental health of the respondent played no part in influencing the individual education attainment.
Nonetheless, they found out that the economic and social status usually coined on the status of employment had a strong link to educational outcome of respondents. For that matter, based on comparison with the findings of other researchers, the relationship between education level and education is mixed and warrants more research.
Table 3 Chi-Square Tests.
a 0 cells (.0%) have expected count less than 5. The minimum expected count is 44.38.
Table 4 Cross-Tabulation; Gender and highest education degree.
Table 5 Correlation between education degree and gender/sex of the respondent.
* Correlation is significant at the 0.05 level (2-tailed).
Relationship between parental education and the education of the respondent
As mentioned previously, other factors directly or indirectly influence once education level attainment. It has been suggested in various literatures that there is a relationship between parents’ education and the education of the respondent. The paper seeks to establish the relationship through an analysis of the two variables. Regression a method of data analysis aimed at exploring the relationships between one variable which is dependent and one or more independent variable that are metric is used to explore the relationship between parent education and education of the respondent. Ultimately, the analysis will depict if a relationship exist, the strength of the association, the structure as well as form of the relationship as well as making the researcher able to predict values of dependent variables.
From the linear regression analysis, the summery model indicate that R2=0.129. This shows that 12.9% of the variation in the score of parents education influence on their children education level attainment can be explained by the linear regression model obtained herein. ANOVA outcome clearly depicts that indeed there exists a relationship between parents’ education and education of the respondent (F=67.944(2), p0.000<0.05) Table 8. It is interesting to also not that the correlation analysis yielded the same results, that the relationship is significant. The equation of the relationship between parent education and education of the respondent is represented below (Respondent education= a + b1X1 + b2X2 + b3X3 + … + bkXk)
Respondent highest degree=0.245+0.86*highest year school completed, mother+0.42*highest year school completed father. Having in mind that standardized regression coefficients are of significance in trying to assess the relative importance of the predictors, for this case, Beta=0.146 (highest year school completed, father) is the most important predictor.
Being agreed by majority of the public that the support of parents to their children as well as school is of significance, there is no doubt that the level of parent education either in whole or part contributes to such support. It is worth noting that the findings herein are similar to the conclusion of Chevalier, 2004 in the article “Parental Education and Child’s Education: A natural Experiment”. He established just like in past studies that parents’ education has a significant difference on their children attainment of education. It is worth remembering that the findings establish that the fathers’ education is the most important predictor of respondents’ education level.
This finding corresponds with that of Schuster, 2009). It was established that the education level of mothers were insignificant to educational attainment of children adopted. On the same note, the study is contrary to the general belief that mothers’ level of education as well as years of schooling has a greater impact on the child’s education as compared to fathers’ years in school translating to their achievement. Fathers according to the findings of the research are the most influential with regards to respondent educational level, Beta value stood at 0.146. A possible explanation of this might be the authoritative nature of males as well as being a role model to their children. For this reason, the children will always try to emulate what the father did and is doing (Schuster, 2009).
It has been the general view of the majority that those parents who are less educated are at higher risk of facing liquidity constrains which will ultimately prevent their children from attaining higher level of education. among the activities parents need to get involved in with the aim of fostering their children education include establishing daily family routine, expressing higher and realistic expectation of their children attainment, closely monitoring activities of their children when they are out of school, encouraging their children to read, write as well as discuss issue in a familial setting (Chen, 2005).
Interestingly, previous studies have shown that the significant effect of parents education to education of their children only holds when the involved parents are biological or natural. There is thus need for research to establish the underlying factors behind this issue.
Table 6 ANOVA(b) (Parents’ education and respondent education).
- Predictors: (Constant), HIGHEST YEAR SCHOOL COMPLETED, FATHER, HIGHEST YEAR SCHOOL COMPLETED, and MOTHER
- Dependent Variable: Respondent’s highest degree
Relationship between age and education
Studies carried out previously have attributed to learners age to be another factor that can in lieu impact on education level attainment or number of years spent in schools. To test the existence of the relationship, a regression analysis is carried out. Similarly, a scatter plot is developed to graphically show the relationship between age and education. Regression analysis yield R squared of 0.026. This shows that 2.6% of the association can be explained by the model developed. The mean age of respondent is 46.55 while highest year of school completed averages 13.23. Additionally, it is evident that the relationship between age and education of the respondent is significant (F=38.6, Df=1 p 0.000<0.05). The Beta value of -0.163 shows that the highest year of school completed is mostly predicted by the age of the respondent.
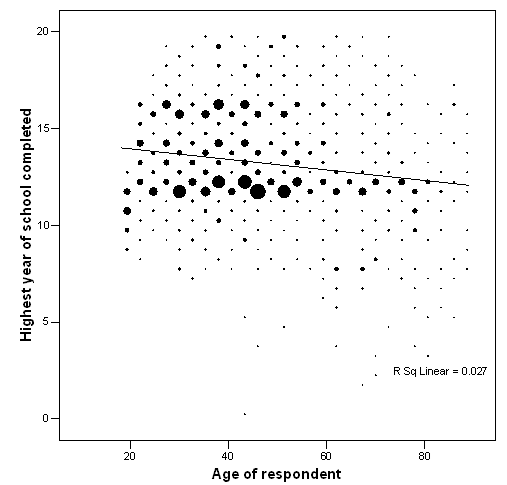
From the scatter plot it is apparent that there is a positive relationship between highest years of school completed and the age of respondents. As individuals get older, less time is spend in education. It has been noted that whenever individuals are actively engaged in education while at an early age, they will be in a better position to spent shorter time in school. According to Smith, 1997 he established that there was a negative relationship between the two variables, age and years spent in learning.
This is contrary to the finding of the analysis herein. Additionally, a correlation analysis show same results, that level of education based on the highest degree of education attained by the respondent is positively correlated with the age of the respondent. Similarly, with regards to how strong is the relationship between the two variables, highest degree of respondent education and their age, the Cramer’s value V of 0.285 shows that it is indeed moderately strong.
It has been shown that when individual tend to grow older, some of them are forced to further their studies in order to retain their job status and to have a guaranteed promotion. On the other hand, young people especially from a family that both parents are well educated also aim to attain higher level of education. Consequently, having in mind that the duration that it takes one to earn a degree is longer, it is thus apparent that most of the individuals who have a degree and are willing or compelled to attain masters’ degree are older members of the society (Schuster, 2009).
The differences in the finding of the analysis herein is a testimony that indeed their might be other compounding factors that play a role in determining such a relationship. For this reason, it has been suggested that there is need to introduce control variables that will help make clear the existing relationship.
Relationship of marital status on education
Another factor that has been deemed to influence individual educational level is their marital status. To find out the relationship between the two variables, a correlation analysis is carried out since the data comes from a normally distributed population. By carrying out correlation analysis, it will be possible to not only establish the existing relationship between the two variables but also the strength between them. This will be made possible by employing Spearman’s Rho. The choice is guided by the fact that one of the variables is numerical. Another condition where this statistic is used is where one or both variables under investigation are ordinal (Fields, 2009).
The case processing summery shows that the valid cases were 1411, which is 99.4% while 8 cases were missing 0.6%. Spearman correlation analysis clearly depicts that there is a no relationship between marital status and level education of the respondents. From table 6, ρ=-0.021, p=0.442>0.05, thus there is no significant differences (Table 6). However, the negative sign seems to depict that the relationship if it could exist could be negative and very weak. To establish which group of individual are more educated than as compared to others for instance married and unmarried individuals, a cross tabulation is carried out to provide more insight (Jerry, 1996).
A close examination of the findings of cross tabulation in Table 7 clearly depicts that there are differences in terms of percentages of the respondent with respect to the different level of education. It is apparent that respondent that were married shown a greater percentage in all level of education. Those who never got married during the time of interview then followed in terms of education levels (Fig. 4). Majority of widowed individual had attained less than high school education and high school. When considering higher level of education, most of the respondent who were never married and divorced came second to those who were married in attaining graduate level. The same is evident in bachelors’ level of education. Generally, it is apparent that marital status of the respondent seems to have an influence on education level attained (Jerry, 1996).
There various explanation brought forth to explain such findings. For instance, married individuals top in each academic level. A chi square analysis to find out the relationship between marital status and level of education reveled that there was a positive but a weak relationship (V=0.106, X2(16)=64.014, P=0.000).
The findings are similar to those by Chen, 2005 in which he established that particularly married couples and for that matter women see lack of support from their spouses as well as the responsibility such as caring for the family seems to hinder their advancement in education. However, it contradicts a portion of this finding as majority of married individuals are in all levels of education. It is expected that those who have no yet got married should be the ones toping the lists in attaining advanced educational level; this is not the case in the findings.
It is worth noting that those individuals who were widowed, divorced or separated generally had lower levels of attaining advanced level of education. According to Chen, 2005 these individuals have psychological problems of having lost their partners and are taking the responsibility of taking care of the children when they previously had. These two factors seem to play a major role in hindering their quest of attaining higher degree of education. In conclusion, there is a relationship between marital status and education level attainment.
Table 7 Correlations analysis of marital status and education level.
Conclusion
From the analysis of the various variables that impact on education, the findings are mixed as some coincide with previous findings while some are quite the opposite. A chi square analysis to find out the relationship between marital status and level of education reveled that there was a positive but a weak relationship (V=0.106, X2(16)=64.014, P=0.000). The relationship between age and education of the respondent is significant (F=38.6, Df=1 p 0.000<0.05).
The Beta value of -0.163 shows that the highest year of school completed is mostly predicted by the age of the respondent. From the linear regression analysis of parents’ education and respondent education level, the summery model indicate that R2=0.129. This shows that 12.9% of the variation in the score of parents education influence on their children education level attainment can be explained by the linear regression model obtained.
References
Chen, E. (2005). “The effect of gender, parental status and marital status on community college student’ educational goals and income expectations”. Web.
Fields, A. (2009). Discovering Statistics Using SPSS. New York: Sage Publications Ltd.
Jerry, J. (1996). “Gender inequality and higher education”. The Annual Review of Sociology, 22(1): 1-65
Ojeda, L & Flores, L. (2008). “The influence of gender, generation level, parents’ education level, and perceived barriers on the educational aspirations of Me”. Web.
Schuster, M. (2009). The Effects of Adult Women Education. New York: Wiley.
Smith, T. (1993). “The relationship of age top education across time”. Social Science Research, 22(1): 300-311.
Smith, T. (1997). “Examining the relationship between educational attainment, Age/cohort and dependent variables”. Web.
Appendices
Table 8 Respondent’s highest degree * MARITAL STATUS Cross-tabulation.
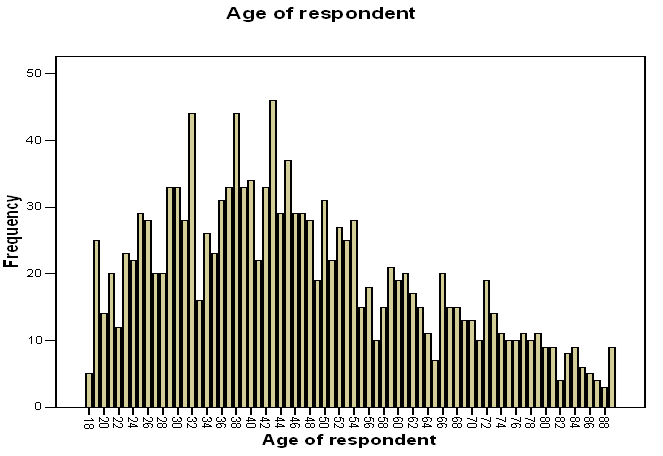
Table 9 Correlation analysis (Parents’ education and respondent education).
Table 10 Regression coefficient.
a Dependent Variable: Respondent’s highest degree
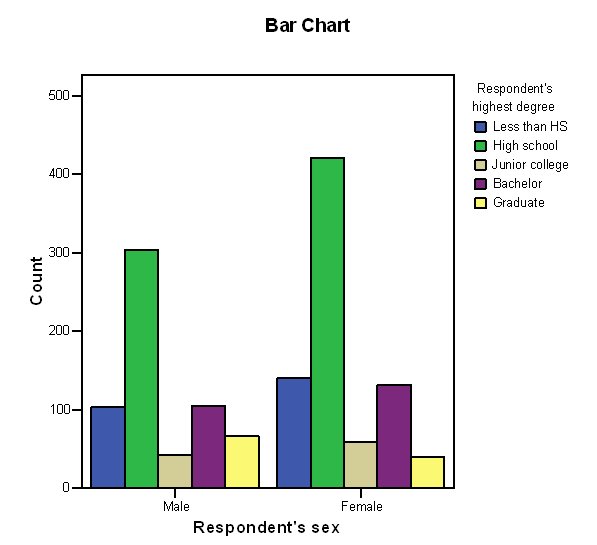
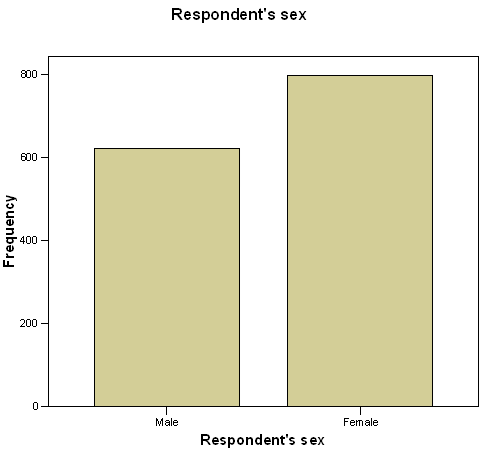
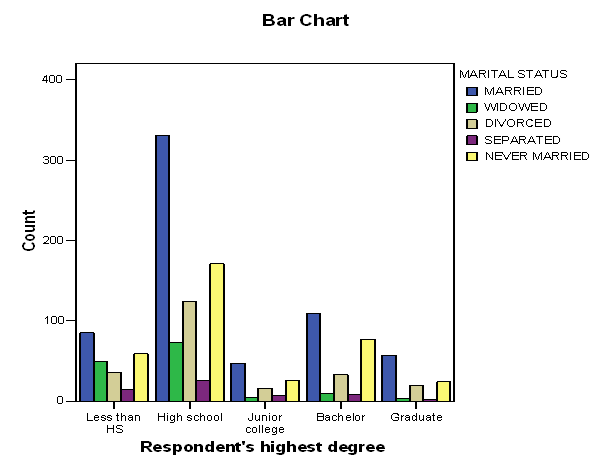
Table 11 Chi-Square Tests for Highest education degree and age of the respondent.
a 273 cells (75.8%) have expected count less than 5. The minimum expected count is.22.