Introduction
Capital budgeting is an integral part of corporate finance. Businesses are in perpetual strife to increase shareholder value by increasing revenue or profits. This endeavor is achieved by venturing into new investments and starting projects. Most of the time, companies will have multiple ideas at the same time on where to invest. However, a decision has to be made about which project is the most attractive in terms of maximizing shareholder value. Enter the time value of money concept; in this concept, an amount of money is more valuable today than tomorrow. For this reason, the future cash flows of the investment must be converted to the present value in a process called the discounted cash flow method (Schmidt, 2016). The tools employed in determining which investment is the most attractive is called capital budgeting techniques.
ABC Corporation is a healthcare company that specializes in the provision of health services such as owning hospitals, urgent care centers, ambulatory surgical centers, and outpatient clinics. In a bid to increase shareholder value, the company has three proposed investment projects and can only choose one. The first proposal is the purchase of new major equipment projected to reduce the cost of sales by 5 percent over an 8-year period. The second project involves expansion into three additional states that are projected to increase revenues and cost of sales by 10 percent over five years. The third project is a marketing/advertising campaign that is estimated to cost 2 million dollars every year over six years. This paper aims to apply capital budgeting techniques and appraise the three projects to determine the best one for ABC to invest in. The capital budgeting tools that will be employed include NPV, profitability index, payback period, and internal rate of return.
Literature Review
Capital budgeting is a process undertaken by businesses to evaluate the potential of their investments. An example of a project is purchasing a new plant; typically, the project that will require capital budgeting is an outside venture that necessitates feasibility study before approval or rejection. Capital budgeting typically requires that a company project the future cash flows of the proposed investment to investigate whether it will generate enough potential return; this process is also called investment appraisal. Businesses must pursue those projects that have the most potential to enhance shareholder value. However, companies have limited resources while also having multiple options of investment opportunities. They, therefore, use capital budgeting techniques to determine the best projects; typically, this will be the one(s) with the best returns.
Discounted Cashflow Analysis
This method looks at the initial cash flow required to fund an investment, cash inflows such as revenue from the project, and future outflows such as maintenance and other costs. The present value of the undertaking is the value obtained after these future cash flows have been discounted to the current time (Ross, 2018). Discounting is necessary because the money is analyzed not just in intrinsic value but also with regard to time; naturally, money will have more value now than the same amount at a future date because of inflation and other factors.
The net present value (NPV) is the resulting value after a DCF analysis. Every project decision has an opportunity cost which is the foregone opportunity after one is selected. The cashflows/revenues of an investment should be enough to cover the initial and ongoing costs and also exceed the opportunity costs(Ross, 2018). The present value is typically discounted using the risk-free rate such as the one provided by the US Treasury. Future cash flows will be discounted with this rate and exceed the initial cost; otherwise, it would not be worthwhile to invest in the project.
Cost of Capital
Companies usually borrow capital to finance their projects; the projects therefore need to generate enough revenues to cover the cost of capital. Publicly traded corporations could use credit options such as bonds or bank credit facilities, or stock options. The cost capital typically is the weighted average of equity and debt. The objective is to compute the hurdle rate, which is the minimum amount the project should earn from its cashflows to meet its capital expenses (Ross, 2018). A rate of return that is below this hurdle rate will not be chosen as it does not create value for the company. In contrast, a rate of return bigger than the hurdle rate creates value for the company and can be chosen. The DCF approach can be used to choose the more profitable project; typically, the investment with the higher NPV would be chosen, although other factors would be considered, too, such as risk.
Internal Rate of Return
The Internal rate of return, abbreviated as IRR, is a financial analysis metric used to estimate the potential of an investment. The IRR is a DCF metric that equates the NPV of all cash flows to zero. IRR is calculated using the same formula as the NPV (Ross, 2018). The IRR is not the dollar value of the investment but a discount rate that equates the NPV to zero. In general terms, a project is more desirable if its IRR is higher. Since IRR is uniform for various kinds of investments, it can be used as a comparison tool on a standardized basis. Assuming all other factors are constant, the IRR of a project is directly proportional to the attractiveness of the project (Ross, 2018). IRR is calculated first by setting the NPV to zero to solve the discount rate. The initial investment being an outflow will be negative. The subsequent cashflows could be negative or positive, depending on the project’s estimates. The process of calculating the IRR is then calculated iteratively via trial and error.
Payback Period
The payback period is an intuitive term used to refer to the time a project takes to recover its investment cost. In other words, it is the time an investment takes to break even. Naturally, since time is a factor in the value of money, the desirability of a project is inversely proportional to the payback period. The payback period is a valuable tool in capital budgeting but is also used in other sectors such as in real estate to obtain the return on resource-efficient investments. Capital budgeting is an indispensable part of corporate finance that involves the valuation of various projects to determine the most desirable ones (Ross, 2018). One way of selecting this outstanding investment is using the payback period. The payback period is calculated by dividing the cost of the investment by the annual cash inflow.
The problem with the payback period computation is that, unlike other capital budgeting methods, it does not account for the time value of money; this is the idea that money loses value with time. Other capital budgeting techniques such as NPV, IRR, and DCF consider the time value of money. One merit of the payback period technique is its simplicity; others use it as an additional tool in the holistic capital budgeting realm. The payback period also does not consider the period after the payback period, which is the project’s profitability period. For these reasons, the payback period is less preferred against the NPV technique.
The Profitability Index
The profitability index is also referred to as the profit investment ratio or value investment ratio. It represents a metric that compares the costs of a project against the benefits of the said project. It is computed by dividing the present value of future cash flows by the project’s initial cost. A higher PI represents a more attractive investment (Ross, 2018). The PI is used to rank various projects since it allows the quantification of the values of the various projects. A value of 1 for PI is the lowest acceptable value as a lower value would indicate that the PV if the investment is lower than the initial investment. The more the PI, the more attractive a project becomes. Noteworthy, the PI metric does not take into account the size of the project. For this reason, projects that have large cash inflows may have lower PI since the profit margins are relatively lower.
Analysis and Discussion
Project A
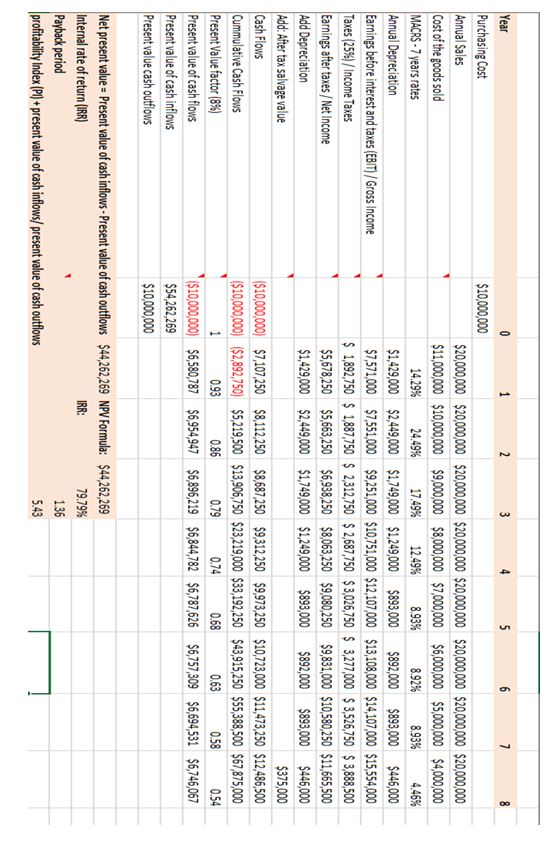
The first project involves the purchase of new equipment that will cost an initial investment of 10 million USD. The investment is expected to reduce the cost of sales by 55 over the next 8 years. The equipment is projected to be sold at the end of the 8th year at 500000 USD salvage value. Because the equipment is safe in relative terms, it has a required rate of return of 8% and will be depreciated with a 7-year MACRS schedule. There are projected annual sales of 20 million USD for year 1 that are expected to remain constant for the 8-year period. The cost of sales has been 60 percent before this project; the marginal rate of corporate tax is presumed to be 25 percent.
From appendix 1, the investment’s cash flows are $7,107,250, $8,112,250, $8,687,250, $9,312,250, $9,973,250, $10,723,000, $11,473,250, $12,486,500 for year 1-8 respectively. On the other hand, the cumulative cashflows for year 1-8 are ($2,892,750) $5,219,500 , $13,906,750, $23,219,000 , $33,192,250 , $43,915,250 , $55,388,500 , and $67,875,000 respectively. For the years 1-8, the present value factors for the 8 years are 1, 0.93, 0.86, 0.79, 0.74, 0.68, 0.63, 0.58, 0.54 respectively. To obtain the present value cashflows, the cashflows are multiplied by the respective present value factors to obtain the following values for year 1-8 respectively: $6,580,787, $6,954,947, $6,896,219, $6,844,782, $6,787,626, $6,757,309, $6,694,531, and $6,746,067.
Microsoft excel NPV formula is used to compute the net present value for the entire project, which comes to $44,262,269. The excel formulae for IRR is also used to obtain a value of 79.79% (Microsoft excel time, n.d.). The values of the payback period and profitability index were 1.36 and 5.43, respectively. $44,262,269 million is the investment’s present value of future cash flows. Compared to the project’s initial investment of 10 million USD, the project is highly successful. The IRR of the investment is 79.79%; this is termed as the rate at which an undertaking’s present value of all cash flows equal zero. The higher the IRR, the more viable a project is. In this case, the investment has a high NPV meaning it is very desirable. On the other hand, the project’s profitability index is 5.43.
The profitability index of an undertaking is the ratio of the current value of future cash flows against the initial cost. The minimum acceptable PI is 1, and the more, the better; in this case, the project’s PI is 5.43, which is an extremely attractive figure but would still need to be compared with that of the other projects. The payback period for this particular investment is 1.36 years; in contrast, the project’s life is 8 years. Since the project is recovering its value in just 1.36 years, it can be termed as attractive.
Project B
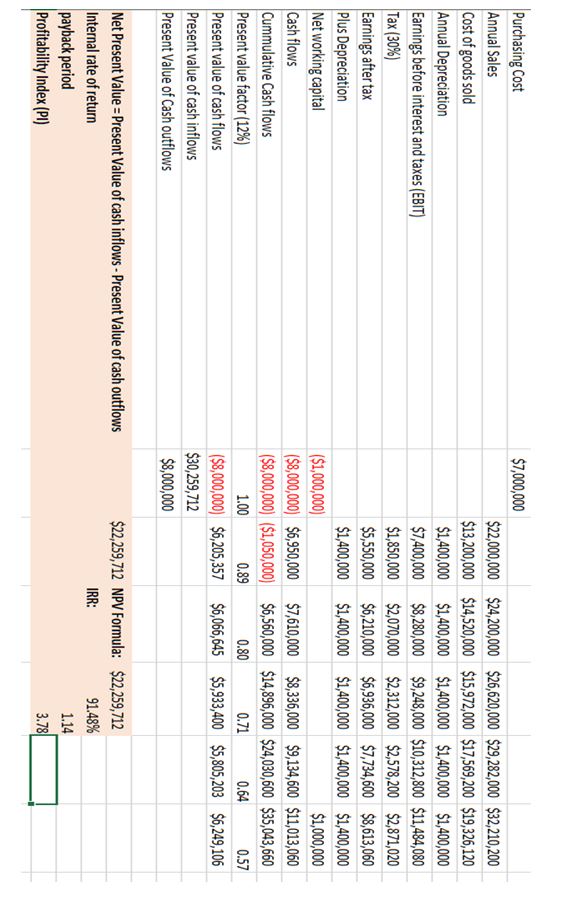
ABC Corporation also proposes expansion into three more states in an effort to increase shareholder value. The proposal is projected to increase revenues/sales and cost of sales by 10% annually over five years. The previous year’s annual sales were 20 million USD. The investment’s startup costs are estimated at 7 million USD and a required initial net working capital of $ 1 million, while the working capital is expected to be recouped at the end of the fifth year. The presumed rate of marginal corporate tax is 25 percent. Since the project can be categorized as risky, its required rate of return is 12%.
For the year 1-5, the project had cashflows of $6,950,000, $7,610,000, $8,336,000, $9,134,600, and $11,013,060, respectively. The project’s cumulative cashflows were also projected at ($1,050,000), $6,560,000, $14,896,000, $24,030,600 and $35,043,660 respectively. On the other hand, the net present value factors were 0.89, 0.80, 0.71, 0.64, and 0.57 respectively. Using Microsoft Excel, the present cashflow values were obtained by multiplying the annual cashflows with the present value factor yielding the following present value $6,205,357, $6,066,645, $5,933,400, $5,805,203, and $6,249,106 for the five years respectively. The total value of cash inflows is $30,259,712 while the total value of outflows is $8,000,000; this leaves a net present value of $22,259,712 for the project. Compared with the initial cost of $7 million, the project is desirable.
The IRR for the project is also obtained from excel formulae to yield 91.48%. The internal rate of return has been defined as the discount rate at which the NPV of cash flows equals zero. Typically, the higher the IRR, the more attractive a project is. This project had an extremely attractive IRR at 91.485, which makes it attractive and would only be disqualified if the other comparison projects have better indicators. On the other hand, the project’s profitability index (PI) was 3.78. PI is a ratio of a project’s NPV against the initial investment. A value of 1 is the minimum allowable PI value to accept a proposed project, and the more, the better. Since this project’s PI is comfortably greater than 1, the project is desirable by this metric and will only be disqualified if the other projects post better results.
The project’s payback period was 1.14 years. Payback period is a metric used to check the time it will take for the project to break even. The metric has the advantage of simplicity but does not take into account the time value of money (Schmidt, 2016). In this investment, the life period of the project is five years, but the project is able to break even at only 1.14 years which leaves the bulk of the years as profit years.
Project C
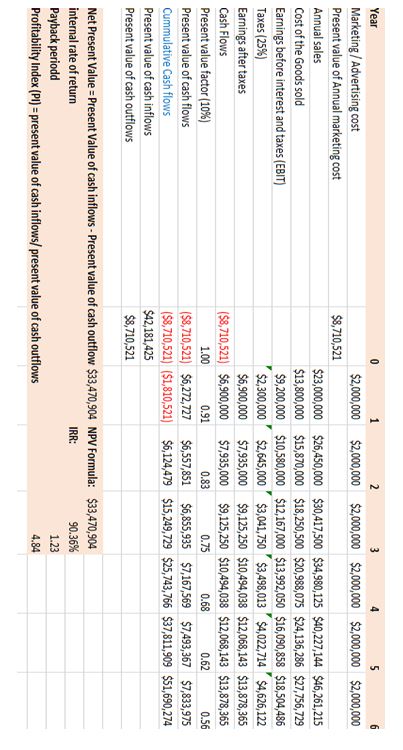
In an effort to maximize shareholder value through revenue and profitability, ABC Corporation has proposed a third project that involves investing in a marketing campaign supposed to last six years. The project is expected to consume 2 million dollars every 2 years. It is projected that the project will increase revenues/sales and cost of sales by fifteen percent annually. The previous year’s annual sales were $20 million, while the presumed rate of marginal corporate tax is 25%. The project can also be categorized as moderate risk, and its required rate of return is fixed at 10%.
From appendix 3, the project had the following cashflows present values of cashflows: $6,272,727, $6,557,851, $6,855,935, $7,167,569, $7,493,367 and $7,833,975. The project’s cumulative cashflows are ($1,810,521), $6,124,479, $15,249,729, $25,743,766, $37,811,909, and $51,690,274. The present value factor for the respective years are 0.91, 0.83, 0.75 0.68, 0.62, and 0.56. Multiplying the present value factors with the cashflows yields the present value of cashflows as: ($1,810,521), $6,124,479, $15,249,729, $25,743,766, $37,811,909 and $51,690,274 totaling to $42,181,425. Because the cost is also distributed over the period, the present value of the project’s cost is $8,710,521; this subtracted from the total of total discounted cashflows yields the net present value of $33,470,904.
The Net present value is used to consider the current value of future cash flows of a project. Because of the time value of money, a discounting rate is applied to future cash flows. From the NPV values of the project, the NPV is way above the initial cost of the investment, which indicates that it is a desirable project. This means that the project could only be disqualified if the other projects have better NPV values.
The project also yielded an IRR of 90.36%; the IRR is a capital budgeting criterion computed by equating the present value of future cash flows to zero. The IRR is calculated using a trial and error method, and the bigger the value, the more attractive the project is. An IRR is a discounted cash flow rate where typical percentage values could be in the teens. However, this project had an IRR rate of 90.36% percent, indicating the project is highly attractive in isolation and would only be disqualified when comparing with other projects.
The profitability index for the project was 4.84; the PI index is a ratio of the current value of projected cash flows against the initial project cost. A value of 1 is the minimum allowable value to accept a project; however, the bigger the value, the more attractive the project is. In the case of this marketing campaign investment, the PI is 4.84, which indicates an attractive project that is attractive in isolation. The project’s payback period is 1.23 years; payback period is a capital budgeting tool that is used to determine when the project is going to break even. The earlier a project breaks even, the more attractive it is since it leaves more years to obtain profits. This project has a lifespan of 6 years but has broken even at 1.23 years which indicates an attractive investment that would only be disqualified when comparing it with other projects.
ABC Corporation intends to increase shareholder value by investing in a new project. However, there are three projects to choose from, namely: the purchase of major equipment at an initial cost of $10 million, expansion to new states at $7 million startup cost or invest in a marketing campaign supposed to last six years and to spend 2 million dollars every two years. Financial analysis s supposed to be carried out using capital budgeting tools, namely: NPV, IRR, PI, and payback period.
Project A had a net present value of $44,262,268.65, while project C had an NPV of $22,259,712.14. The third project had an NPV of $33,470,903.72. NPV is a capital budgeting criterion that considers the time value of money by discounting a project’s future cash flows with a discounting rate to establish the present value. In this case, three projects’ present values are being compared; at face value, project A wins the NPV comparison since it has the largest NPV value. This is, however, misleading since the three projects have different lifespans.
The next metric to take into consideration is the internal rate of return (IRR). As discussed during the literature review, the IRR is a discounting rate at which the net current value of a project is zero. From the ABC Corporation case, projects A, B, and C had IRR values of 79.79%, 91.48%, and 90.365, respectively. The discount rates from the three projects are 8%, 12%, and 10%, respectively. In all three projects, the IRR is comfortably above the discount rate for the respective project meaning the three projects can be accepted, but the one with the highest IRR relative to its discounted rate is project C.
Another metric that uses the discounted cash flow method is the profitability index (PI). From the literature review section, PI is a metric used to compare the net present value of cash flows against the initial investment. The three projects A, B, and C had PIs of 5.43, 3.78, and 4.84. From the three, A has the largest PI, but it is also the project with the longest lifespan meaning more cashflows. Therefore, this method is still not conclusive in selecting which project to invest in.
Since the most satisfactory project with the best returns cannot be established from NPV and IRR metrics only, the next parameter to be analyzed is the payback period. Payback period is a capital budgeting period that utilizes non-discounted cash flow. The three projects A, B, and C, had payback periods of 1.36, 1.14, and 1.23 years. Project B seems to have the shortest recovery period, albeit just marginally. The three projects seem to have short payback periods and would all qualify, but B is the winner since it has the shortest payback period, which could also be because it has the shortest lifespan among the three. Still, it is not conclusive that B is the most favorable among the 3.
Recommendation: Equivalent Annuity Cashflow
Because the three projects have different lifespans and all have attractive capital budgeting metrics, it becomes necessary to standardize the technique so that they can be analyzed on an apples-to-apples basis. After computing the equivalent annuity cash flow, the NPVs for the three projects become:
Because the three projects have different lifespans, the NPV figure at face value is misleading. For this reason, it is important to standardize this figure using the equivalent annuity cash flow, which shows that project A still had the best figure. Therefore, it is recommended that the ABC Corporation invests in the purchase of new equipment. The rationale for this recommendation is because from the capital budgeting techniques, specifically the equivalent annuity cash flow, it has the best returns. In non-quantitative qualities, it is considered the least risky.
Conclusion
This paper focused on capital budgeting techniques. ABC Healthcare Corporation is an organization that offers healthcare services such as owning hospitals, urgent care centers, ambulatory surgical centers, and outpatient clinics. The company intends to invest in a new project in order to maximize shareholder value through increased revenue/sales. There are three projects to invest in; the first project involves the purchase of new equipment whose life is eight years, while the second is an expansion endeavor into three states. The third project is a marketing campaign that is supposed to last six years.
Capital budgeting techniques involve comparing which project is the most desirable. The net present value criterion is a discounted cash flow mechanism used to convert future cash flows into a current value. This conversion is done because of the time value of money, where an amount of money is more valuable today than it will be tomorrow. In this regard, it was revealed that all three projects had positive NPVs and were desirable.
The second technique applied is the internal rate of return (IRR). This technique involves computing the discount rate that gives a discount rate of zero. If the IRR of a project exceeds the project’s discount rate, then the project is deemed desirable. In this example, the three projects had IRR rates well above their respective discounting rates, and they were all desirable in isolation.
Since the discounted cash flow techniques all showed that the projects were desirable in isolation, another method has to be employed to standardize the comparison. This is because the projects had different lifespans and different levels of risk. The NPV value is broken down into an annualized equivalent that considers the required rates and the project time periods. After considering the EACs of the three projects, project A emerged as the winner. Therefore, it was recommended that ABC Corporation invests in project A because it provided the best returns from equivalent annuity cash flow and is the least risky in non-quantitative terms.
The first project was selected based on quantitative methods of capital budgeting. However, the project involves purchasing new equipment for the company, which is a desirable venture since new machinery will likely be at the top of its category technology-wise and in functioning. This would positively impact the company’s overall efficiency that would enable workers to work faster, thereby increasing productivity. The investment could also impact employees positively; as an example, employees prefer working for organizations that give them exposure to the latest technology; this could also positively impact talent retention. Moreover, happy employees improve the quality of the work delivered, meaning satisfied clientele.
References
Microsoft excel time value function tutorial—Lump sums (n.d.). TVMcalcs. Web.
Ross, S. A. (2018). Corporate finance: Core principles & applications (Fifth edition). McGraw-Hill Education.
Schmidt, C. E. (2016). A journey through time: From the present value to the future value and back or: Retirement planning: A comprehensible application of the time value of money concept. American Journal of Business Education, 9(3), 137–143.
Appendix 1
Appendix 2
Appendix 3