Introduction
Indicators of performance and financial ratios can reveal a significant amount of information about a company’s current position in the market. Analyzing the relevant markers of productivity, profit indexes, and loss numbers makes it possible to establish how well the firm is performing under the present circumstances (Scott, 2019). Of special concern are the metrics that illustrate the company’s current performance and provide an insight into its financial standing. In the case of the Alibaba (Baba) corporation, the primary indexes suggest that this enterprise is maintaining a highly beneficial position; however, signs of decreasing growth have become evident over the last five years. The present report offers an examination of Alibaba’s major financial ratios and performance indicators, assessing the firm’s cash flow, liquidity, solvency, and profitability ratios.
Cash Flow Analysis
To create a comprehensive evaluation of Alibaba’s performance, the company’s cash flow should be considered. Enterprises are always managing various amounts of incoming and outgoing cash, and the overall trend of gaining or losing funds over a period of time can provide a crucial insight into the company’s performance. One of the indicators in this area is the net cash flow, an index that reveals whether the corporation is securing more financial resources or if particular sums are being lost (Deo, 2016). As net cash flow does not consider debts, it can successfully demonstrate whether a surplus of funds has been achieved or if finances had to be forfeited. A graph of Alibaba’s net cash flow from 2012 to 2021 is given in Figure 1.
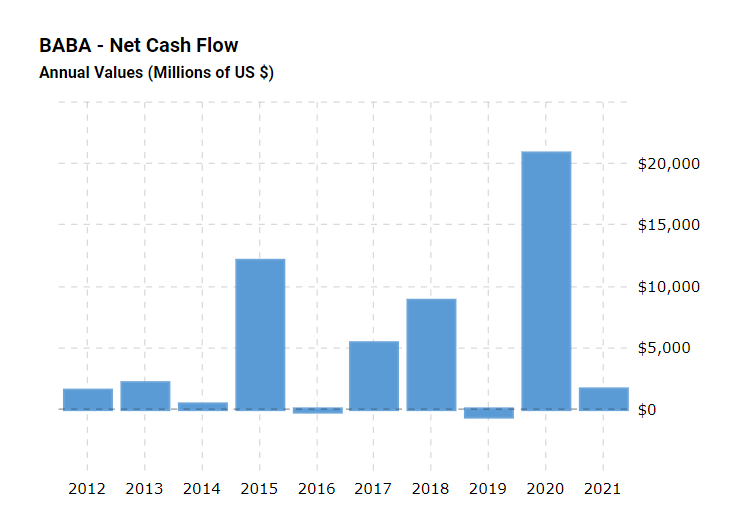
For Alibaba, the current net cash flow appears to be positive, as the company has generated over 1.6 million dollars in 2021. However, there is a significant reduction of gained monetary resources in comparison with 2020, when over 20 million dollars were attained by the end of the fiscal year (Mactotrends, n.d.). Moreover, the overall net cash flow has been changing drastically since 2016, with the Alibaba experiencing substantial losses in 2016 and 2019 when the enterprise forfeited 213 million and 630 million dollars, respectively (Mactotrends, n.d.). Therefore, it is evident that Alibaba’s net cash flow is exceptionally unsteady, greatly fluctuating and demonstrating the organization is not always able to properly cover its debts without encountering negative net cash flow.
Liquidity Ratios: Current Debts and Liabilities
To evaluate a company’s financial position, it is crucial to estimate its capability to handle ongoing debts and liabilities. Liquidity ratios are the indexes used to analyze such capabilities, revealing whether the firm’s available funds are sufficient for paying short-term obligations (Scott, 2019). The liquidity ratios for the Alibaba corporation in the period between 2017 and 2022 are given in Table 1. The first metric vital for consideration is the current ratio, a financial coefficient that estimates how well the enterprise can repay its current liabilities using all the accessible assets (Deo, 2016). While a good current ratio should be above 1, the higher this metric, the easier it is for the company to settle its ongoing liabilities (Scott, 2019). From 2017 to 2022, Alibaba’s current ratio fluctuated between 2.6 and 1.7, with the lowest coefficient being 1.3 (Mactotrends, n.d.). These trends suggest that Alibaba possesses enough liquefiable assets to fully repay its obligations, with a significant portion of the funds remaining for extra purposes.
Table 1. Values for liquidity ratios from 2016 to 2021
From this perspective, the Alibaba corporation’s position can be considered secure. Nevertheless, it is critical to note that, in the year 2016, Alibaba’s current ratio was 2.6, which is more than double the amount needed to successfully cover all necessary payments (Mactotrends, n.d.). As this measure dipped significantly over the years, slowly decreasing to reach 1.7, it could be suggested that the company’s performance is currently diminished, with its capability to pay the ongoing debts steadily declining.
Another vital coefficient to address during the analysis is the quick ratio. This metric provides information on the enterprise’s liquid assets that can be used to finance the obligations without having to refer to all the possessed funds (Scott, 2019). In other words, this metric considers only cash and other finances that do not require conversion (Franklin et al., 2018). Although Alibaba’s quick ratio plummeted from 2.3 to 1.4 since 2016, its capacity to pay the relevant liabilities remains quite high, meaning that the business is financially stable. Therefore, even after the drop in performance, Alibaba can cover its obligations without having to liquify all of its assets.
Finally, the operating cash ratio can be useful for determining the enterprise’s potential to repay debts by only using the cash generated within a certain period. This coefficient is critical for ascertaining the business performance and financial well-being, as it is generally preferable for the company to rely on attained cash for debt coverage (Scott, 2019). Alibaba’s operating cash flow ratio has been decreasing since 2016, steadily diminishing from a sufficient 1.1 to a quite low 0.6 (Mactotrends, n.d.). These numbers suggest that the company has not been gaining enough cash for its operating activities in the past five years and cannot currently cover its obligations using only the finances attained. In this regard, it is possible that the majority of the cash flow is derived from extra resources rather than operating activities, which demonstrates the firm’s poor performance in this area.
Solvency Ratios and Debt Ratio: Ensuring Future Financial Health
In addition to managing the possibility to cover short-term payments, corporations should focus on the coverage of long-term debts and liabilities. The executives must ensure that sufficient monetary resources are generated for the long-standing obligations to be repaid. To calculate the company’s ability in this field, solvency ratios are typically used, determining how much the organization depends on shareholder equities and leverages provided by loan companies (Scott, 2019). Considering that an enterprise that heavily relies on credit entities is less likely to achieve higher independence and growth, these measures allow for a proper examination of the current long-term debt involvements. Solvency ratios, namely equity and debt to equity ratios for Alibaba, are presented in Table 2.
Table 2. Values for the solvency ratios from 2016 to 2021
The first solvency ratio, equity, demonstrates to what extent the shareholder equity funds Alibaba. The current equity ratio for the organization is 1.7, which is considerably higher than 0.5 and suggests that the organization is primarily covered by shareholder equity rather than by long-standing debts. This distribution of funds is beneficial, as it proposes a higher degree of freedom from investors and credit companies (Franklin et al., 2018). Nevertheless, this index has slightly decreased since 2016, meaning that additional attention in this area is needed.
To ascertain how heavily Alibaba relies on long-term loans, the debt to equity ratio can be used. This value reveals to what extent the organization’s activities are financed by debt (Scott, 2019). In Alibaba’s case, its debt-to-equity ratio is 0.1, having declined from 0.2 since 2016. This value is tremendously decreased and illustrates that the organization does not require any leverage from credit companies, having accumulated only a small amount of financial obligations (Franklin et al., 2018). Thus, Alibaba is not at significant risk of becoming overwhelmed by long-standing debt, suggesting that it is performing excellently by relying mostly on shareholders’ equity.
Determining Revenue to Expenses Excess: Profitability Ratios
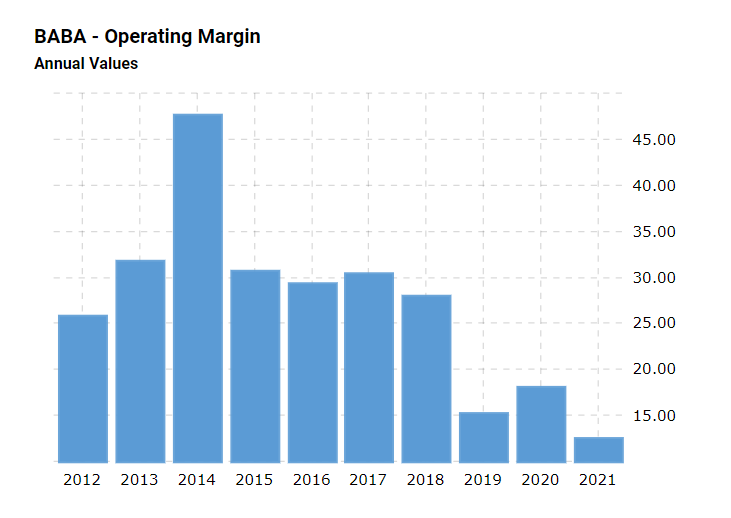
To successfully operate a business, attaining an appropriate amount of revenue is crucial. Profitability ratios are typically utilized to define a company’s productivity in this area (Franklin et al., 2018). An index that clarifies how much profit has been received from the operating activities is the operating margin, which determines if enough revenue is generated to cover the expenses (Seo & Soh, 2019). The operating margin for Alibaba is demonstrated in Figure 2. In 2021, this index was 12%; however, it had decreased tremendously since 2016, when it was almost 30% (Mactotrends, n.d.). This index demonstrates that Alibaba has been primarily funded by revenue until 2021, when the value dropped below 15%, which is the desired measure for the operating margin. Therefore, the company should consider improving its performance in this area.
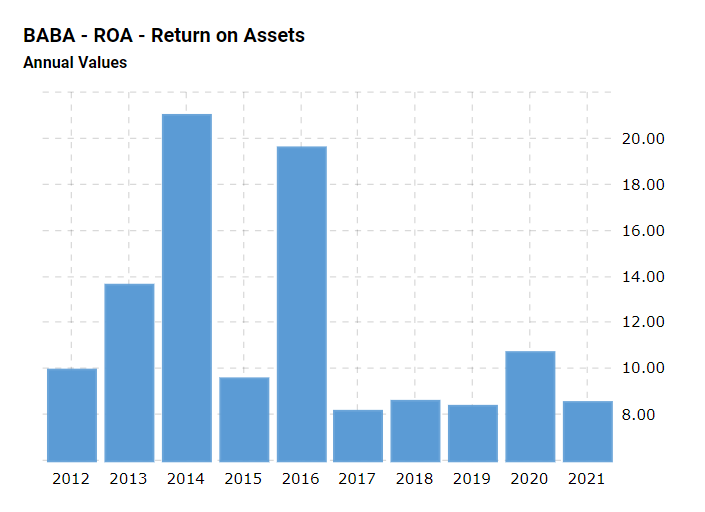
Finally, return on assets (ROA) is a profitability index to be analyzed to establish the company’s performance. ROA refers to the percentage of revenue that was gained for each dollar of previously invested funds (Seo & Soh, 2019). As such, a firm’s financial standing will be more advantageous when it receives more finances for each dollar of the resources that were spent on investments. In 2021, Alibaba’s ROA was 8.4%, which is an excellent value. However, as evident from Figure 3, Alibaba’s ROA has decreased substantially since 2016, dropping from an extremely high 20% (Mactotrends, n.d.). From this perspective, although Alibaba still remains profitable, it was more sustainable before 2016.
Conclusion
To conclude, an analysis of major financial and performance metrics was presented in this report, demonstrating how the Alibaba corporation’s productivity and financial standing have decreased over the last five years. The evaluation of the relevant markers of business affluence, namely net cash flow, liquidity ratios, solvency ratios, and profitability ratios, has revealed that the company remains highly profitable in the current year. Not only does the company sustain positive cash flow, but it also has the capabilities to cover both short-term and long-term debts easily. Nevertheless, compared to previous indexes, these values are significantly lowered and suggest that Alibaba is experiencing a decrease in performance, generating less revenue and more heavily relying on debts and other sources of income. Altogether, although the enterprise’s present productivity is positive, it might encounter efficiency complications in the future.
References
Deo, P. (2016). Evaluating a cash flow statement. International Journal of Business, Accounting, & Finance, 10(1), 22–42.
Franklin, M., Graybeal, P., & Cooper, D. (2018). Principles of accounting, volume 1: Financial accounting. OpenStax.
Macrotrends. (n.d.). Alibaba financial ratios for analysis 2010-2021. Web.
Scott, P. (2019). Accounting for business. Oxford University Press.
Seo, K. & Soh, J. (2019). Asset-light business model: An examination of investment-cash flow sensitivities and return on invested capital. International Journal of Hospitality Management, 78, 169–178.