Introduction
Apple Inc. is an American technology company in Cupertino, California that designs and develops consumer electronics, software, and online services. In 1976, Steve Jobs and Steve Wozniak founded Apple in California (Kabir, 2021). It successfully ranks among the most expensive and most prominent corporations globally, but this is not the main thing. The company is recognized as an icon of the style of the appearance of technology and the manufacturer of the most coveted gadgets. Currently, the company specializes in the production of smartphones, computers, laptops, and software. Thanks to the production of high-quality products, the company has become widely known worldwide and one of the wealthiest companies.
Apple Inc.’s Market Exposure
Apple is trying to release new models of its phones almost every year. The popularity of the iPhone in the world is only growing, and some consider it necessary to have a novelty in use. Apple sets a certain rhythm in the world of technology. They are constantly trying to improve and give users something new to beat the competition. Every year it becomes much more challenging to do this. The main pursuers in the market are Samsung. The South Korean corporation is one of the main competitors of the American company, and in specific years the sales of phones of this brand were significantly higher than those of the iPhone (Cain, 2020). Samsung manages to become the perfect phone in terms of price and quality, running on the Android operating system. Moreover, the flagship models are endowed with powerful functionality, and the device’s build quality does not cause complaints.
Although Apple does not produce budget gadgets, people still prefer its products to other companies. For example, Google equips all companies, except Apple, with operating systems. Apple has its operating system and does not cooperate with third-party companies. According to statistics, for the second quarter of 2021, Apple holds 57% of the global market, while Samsung occupies 17%, and Xiaomi only 6% (Mishra, 2021). These statistics accurately demonstrate that Apple is the market leader and significantly surpasses its competitors in statistical indicators.
As for demand and supply, price elasticity of demand (PED) shows that where stores are limited, prices are higher. However, with price elasticity, the significance of measurement reflects demand impact where small changes in prices are implemented (Begg, & Ward, 2020). Price demand elasticity closely relates to a brand’s reputation. In the case of Apple, its products are inelastic since price changes have limited influence on how consumers relate to the products. Brand loyalty for iPhones and other Apple-related products has seen consumers line up outside stores every time the corporation releases a new brand to the market. Brand loyalty understanding has been a critical aspect the company uses in setting its product’s prices. Based on the low competition level from Samsung and Xiaomi, Apple product prices rarely rely on their demand. With demand, elasticity comes price sensitivity, but when it comes to iPhones, consumers are not affected by the cost of the products.
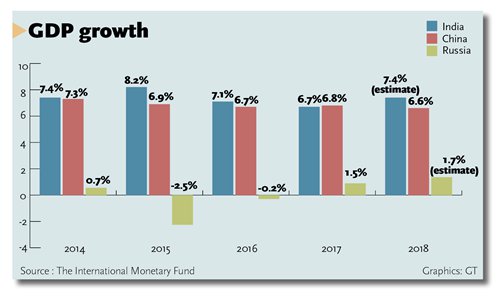
However, the company’s supply and demand are sometimes subject to GDP in the country’s it operates in. In 2018, the slow growth in China’s GDP, in the past 25 years made Apple Inc.’s economic environment to be impacted, as shown in Figure 1. Coupled with the tension between the U.S. and China, the climate resulted in mounting uncertainty that weighed on Apple’s financial market. The effect of the slow GDP growth reached the consumer with traffic to Apple’s retail stores and its channel partners declining. Further, the same year saw Apple’s iPhone encounter a greater contraction in Apple’s global market data.
Being a significant player in the technology industry, Apple has been subject to several competition investigations. In 2020, the company faced two probes from the European Commission about whether it had broken competition rules. In one encounter, Apple’s iPhones and iPads were being investigated over apps installation issues from Apple’s App Store, which was one of the related restrictions the company faced from third-party developers (Kellion, 2020). The second competition rule of the investigation was associated with Apple Pay use where users could not use iPhones’ tap-and-go facility (Kellion, 2020). The other competition issue associated with Apple was anti-trust in nature, where the organization was found guilty, in several countries, of exploiting a dominant position in the smartphone market (Antitrust, 2021). The firm was accused of placing undue demands on retailers and carriers since carriers inevitably had to sell iPhones based on their popularity.
Vulnerability and Costs
Through the successful creation of high demand for its products, Apple has control over prices. Product innovation has been the fundamental differentiation approach the company has, and that has been critical in determining how it ensures brand loyalty, innovative advertising, and new product launch hype. Thus, Apple focuses on consumers willing to pay more and maintains a premium price at its unit volume cost.
Based on Apple’s cost structure, the company can undertake minimum advertised pricing and, through its policies, can prohibit dealers and resellers from promoting its products below a specified minimum price. The company has maintained its high-priced product’s popularity by only providing retailers, like Best Buy and Wal-Mart, with marginal wholesale discounts. Since the savings percentage is small on Apple products, consumers end up paying prices close to what the firm suggests as retail prices (Moorman, 2018). The cost structure strategy by Apple has seen the company prevent retailers from engaging in direct competition with it, and further, no reseller enjoys an advantage over the other.
Type 1 vulnerability is the degree to which fixed costs magnitude affects an organization’s strength. Represented by the SRATC curve, the power of the organization is impacted by the fixed costs’ scale. An organization can overcome type 1 vulnerability through labor return increases. However, by investing in labor, a firm engages in a short-run quasi-fixed cost, and in the long run, it amortizes, eventually becoming a valuable asset to the business (Begg, & Ward, 2020). Type 2 vulnerability, on the other hand, is the degree to which the same organization is subject to macroeconomic shocks. The vulnerability is determined using the external costs faced by the business (Dornbusch et al., 2018). Given the understanding of the cost structure utilized by Apple and the success associated with it, there are no signs the firm is vulnerable to cost. With this knowledge, there is nothing for it to do to minimize cost vulnerability.
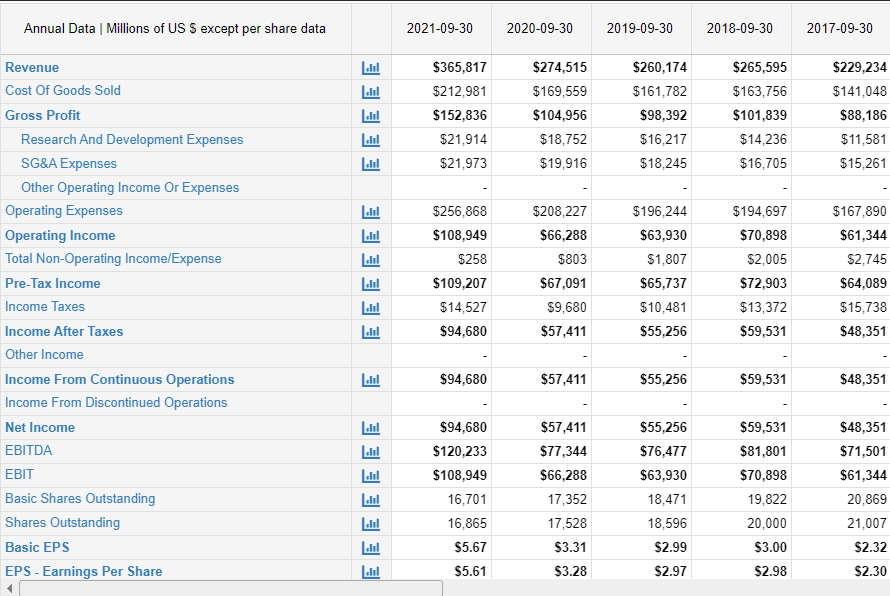
As evident in the consolidated operations statement in the appendix, Apple’s vulnerability, if any exists, is at a minimal level. Looking at the past five years, September 30, 2017, to September 30, 2021, Apple’s revenue has been on the rise steadily from $229,234 in 2017 to $365,817 in 2021 (Macrotrends, 2021). To maintain a steady rise in revenue, even despite the effects of COVID-19, means the firm has a stable and ever-growing market for its products. Likewise, the cost of goods sold in the last five years cement Apple’s position in the technological industry. On September 30, 2017, the organization sold $141,048 and by September 30, 2021, it managed to sell $212,981 (Macrotrends, 2021). For an organization vulnerable to either type1 or type 2, the firm would be struggling from the pandemic and its macro exposure shocks would have a lower net sale value than that of September 30, 2020. As seen in the appendix, Apple’s financial position has been improving in every region and this proves the innovations and technology coupled with marketing strategies have given Apple a market position that cannot be rivaled.
Further, using return on capital employed (ROCE), Table 1 below shows that compared to its previous returns on capital, Apple can be said to be showing promise since its ROCE is trending to the right and upwards. From the figures, one can tell Apple’s ROCE has been growing, and at 50.38%, it is evident the firm is reaping full benefits associated with previous investments (Simply Wall St., 2021).
Furthermore, as seen in Table 2 below, Apple Inc. is not vulnerable to either type 1 or type 2 vulnerability. The company’s annual EBITDA has been on the rise from 2016 to 2021 and despite the challenge caused by COVID-19, the firm can withstand any challenges. Based on its cost structure and market share, the company has been able to establish a dominant presence in the market and through the development of unique products, it maintains its ability to reach out to a majority of consumers. The firm’s ability to maintain a strong market presence can be evident in the annual EBITDA. From the quarterly EBITDA, the impact of the pandemic is evident since looking at the last two quarters of 2020, the firm’s EBITDA was half in number compared to the following two quarters. Nonetheless, as shown in the annual EBITDA, Apple Inc. cannot be considered a vulnerable organization based on its cost structure.
Table 1: Apple’s Annual ROCE. (Simply Wall St., 2021)
Table 1: Apple’s annual and quarterly EBITDA. Source (Statista, 2021)
Macroeconomic Exposure
The rally for Apple Inc.’s technology has been associated with a push for high market value, and the matter has become high compared to the GDP of several countries in the world. By August 2018, Apple became the first organization globally to record $1trillion in market capitalization, and in less than two years, on March 15, 2021, the firm surpassed the $2.08 trillion market cap (CNBC, 2020). Currently, Apple supports over 2.7 million jobs throughout the U.S. by U.S. manufacturers and suppliers spending, direct employment, and developer jobs (Rosenstock, & Rachel, 2021).
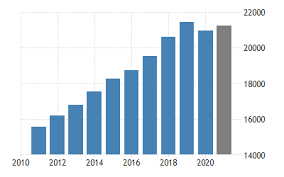
The firm contributes $430 billion to the U.S. economy through data center investments, direct American supplier spending, and U.S. capital expenditures, among other domestic expenses (Rosenstock, & Rachel, 2021). In 2019, the global GDP was more than 87.7 trillion, and based on Apple’s market cap, the firm’s worth was 2.36 percent of the GDP. Locally, the company’s contribution to the U.S. GDP represents 9.7 percent, and only seven nations globally have higher GDP figures than Apple (Kolakoswki, 2021). Apple’s net worth is barely affected by either the U.S. or global GDP since, in its capacity, the firm is more extensive than or comparable to value terms of nearly all countries in the world. From figure 2, the GDP per capita for the U.S. does not influence how Apple operates since its capacity, as established, the firm contributes nearly 10% to the GDP of the nation.
In 2019, Apple Inc. made plans to cut down on some of its flagship iPhones prices. That was the second time, in the company’s history; it had been forced to peg its retail value over existing prices in other countries’ currencies outside the U.S. (Nellis, 2019). Rather than raising the U.S. dollar, the firm moved to stem weak sales of its iPhones. In China, for example, the dollar’s value was on the rise with 10% in 2018, making Apple’s smartphones, which compete at the high end of the market, cost higher than competitors (Nellis, 2019). The other time Apple had been made to cut its prices was in 2007 and 2019 to stem weak sales of its iPhones.
When interest rates are close to zero, they can influence an organization’s business in several ways. In the case of Apple, the company, by 2020, held close to $200 billion in cash and equivalents on its balance sheets by the fiscal year ending 2020 (Martins, 2021). Currently, the sum earns the firm a minimal interest, based on the low yields. Towards the beginning of the 2021 fiscal year, the firm projected that should the interest rates stay at near zero for the year, its average net interest income of $70 million would lower (Martins, 2021). Compared to the past three quarters, $380 million, the following three quarters would probably remain low for an unpredicted time (Martins, 2021). On the liability side, the low-interest rates would result in lower borrowing costs for the company, which would translate to cheaper cash access should the organization require money.
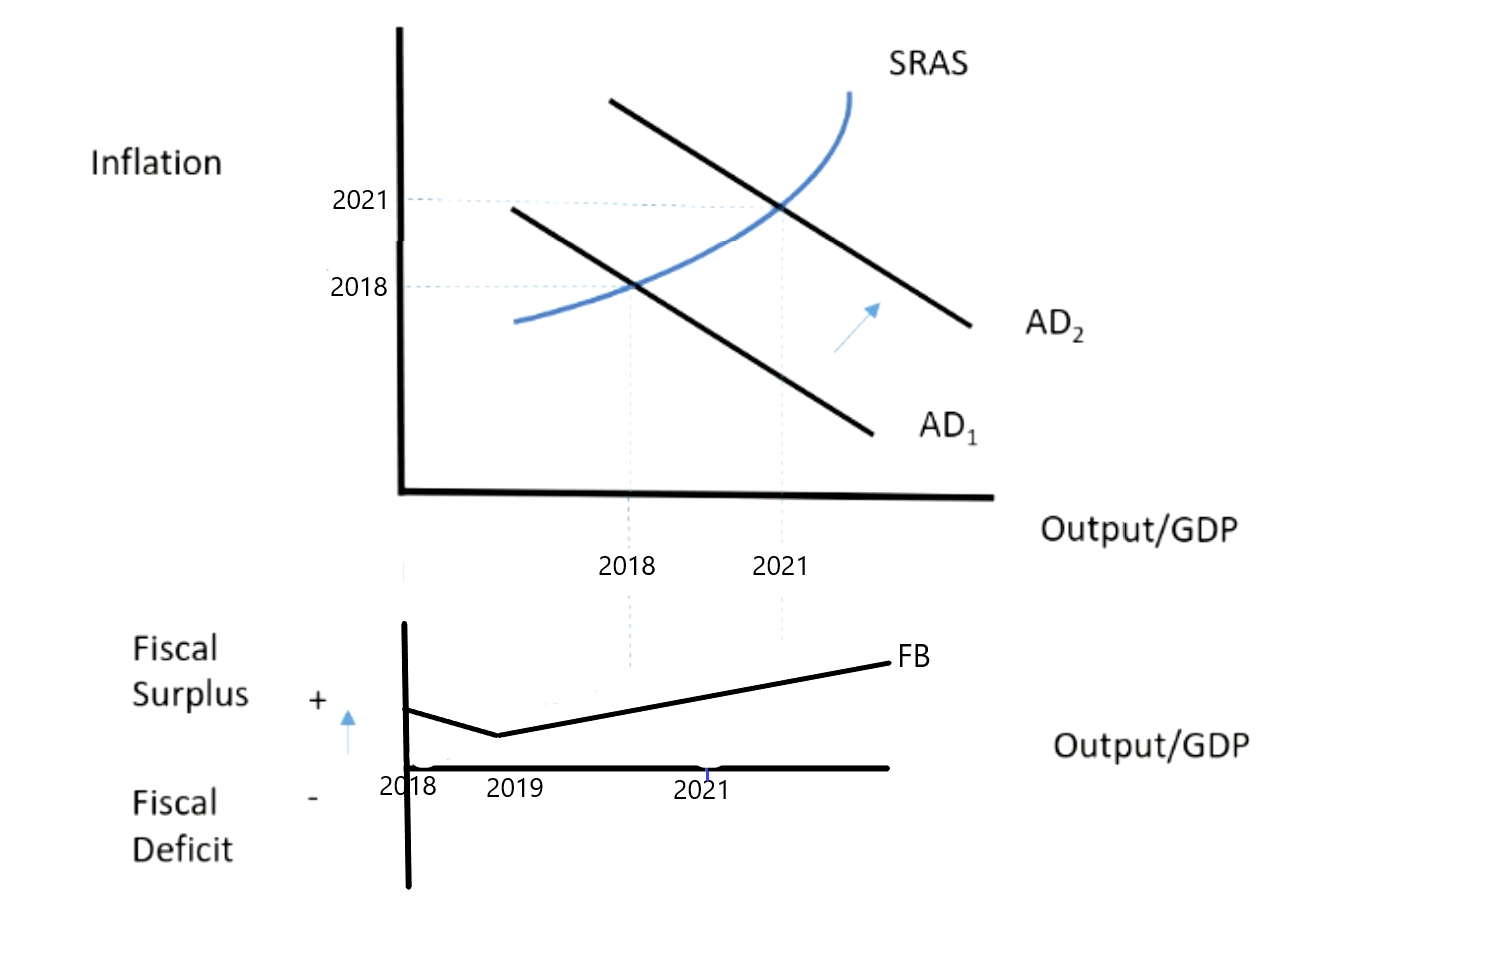
Based on the relationship between inflation and output, or GDP, Apple Inc. has not been affected by inflation in the countries it operates in. The lack of effect, as evident in SRAS, shows the company has been able to control its supplies and demands between 2018 and 2021. In Figure 3, while inflation has had no effect on Apple Inc.’s supplies in three years, existence of interest rates, currency exchange, and, labor costs have impacted the firm. While demand and supply were not impacted, the shifts in interest rates, labor costs, and currency exchange impacted Apple’s income with 2019 being the lowest in the past five years. However, through cost efficiency resources, the firm has been able to regain its income capacity and as seen in the company’s financial statements, the revenue have been on the rise since 2019.
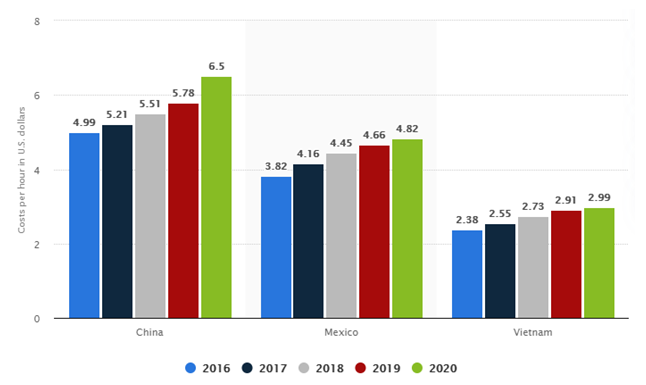
From the economic point of view, the macro events that impact Apple constitute currency exchange, labor cost, and interest rates. Fifty-nine percent of Apple’s total sales are generated outside the U.S., and the firm hedges part of its forecasted foreign currencies exposure related to inventory purchases and revenue (Apple Inc., 2020). Interest rates changes impact Apple’s income to a significant degree. For example, in September 2019, an interest rate increase of 100 in all maturities resulted in a decline of 3.1 billion and 2.8 billion in fair market value on September 26 and 28, respectively (Apple Inc., 2020). The manufacturing units for Apple are based overseas due to resources cost efficiency. Nonetheless, labor costs have been on the rise overseas, affecting how Apple forecasts the expenses of manufacturing labor, as seen in Figure 4.
Non-economic Macro Exposure
When COVID-19 was first reported, the pandemic forced Apple to shut down all its corporate offices, retail stores, and contact centers for at least two weeks. With the pandemic shifting to other regions of the world, COVID-19 forced Apple to close retail stores as well. The quarantines, government-imposed bans, and decline in working hours associated with the pandemic impacted the company’s sales. From March 14, when COVID-19 was global, Apple closed its retail stores only to start reopening them on April 18. For several weeks in February 2020, most of Apple’s suppliers overseas had to be shut down, which negatively impacted Apple’s production. For the first half of 2020, supplier issues affected how Apple shipped its products due to low labor return rates and mandatory quarantines (Clover, 2020). With the pandemic, the firm was forced to implement travel restrictions for its workforce and with this, it became impossible for initial preparation processes the firm uses in flagging the manufacturing of new products.
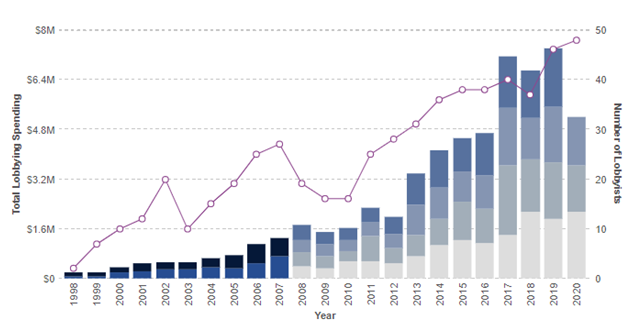
Political lobbying is the external political environment and political bids that influence and impact the operations of the company. As seen in Figure 4 below, the annual political lobbying budget has been increasing, with 2019 being the highest (Campbell, 2020). The number of lobbyists at Apple has been on the rise, while in 2019, the firm employed 46 lobbyists whose mandate is the creation of legislation that favors the long-term operation of the firm.
Protection
Apple is an all-time great marketer, compared to a majority of its competitors in the market. Even this being the case, the firm understands that it too can stumble, and creating consistent marketing excellence has been fundamental in the firm’s successful marketing strategies. Likewise, while it can become an organization’s strength, the management element can also become its vulnerability point or weakness. Apple’s reliable control at the top is an aspiration for most marketers; nonetheless, copying the company’s marketing strategy is not enough. Apple utilizes the approach to safeguard itself from potential macro exposure shocks that create an experience ecosystem, foster an evangelistic community, and organize marketing and sales by a consumer, not by product and pricing control. The other strategies are using consumer-based metrics, unpacking simplicity, and starting with the question of why.
The focus of Apple on its consumers is legendary to every customer. The firm yields experience in every touchpoint. In the ten years leading to 2018, Apple has aggressively expanded in regions where its experience is a portion of everyday life. By encouraging app builders, the organization ensures mediated universe behaviors are constantly developed that strictly enforce standards of operation. Product function innovation from computing, either consumer wrist or pocket, to pay for each purchase, and control every home electronic, Apple has integrated its products into a singular accessible ecosystem (Moorman, 2018). Focusing on innovation away from the core through creating infrastructure has enabled Apple to establish a seamless and secure fashion, like the IOS platform, which sets Apple apart from its rivals. The distinction between Apple and other tech giants like Samsung, Huawei, and Xiaomi makes it secure from macro exposure.
The other strategy that safeguards Apple from macro exposures is its ability to organize marketing and sales by consumers instead of a product. The firm targets four major B2B consumers: government, education, enterprises, and SMEs. For the latter two, Apple rearranges its sales teams according to the served industry. The approach distinguishes the firm from its rivals by focusing on what the industry requires. Apple has an opportunity to ensure it understands what the consumer can offer (Moorman, 2018). The other strategy employed by the organization is price control. Apple’s marketer’s price leveraging tool offers little discounting that helps the organization convey its products the same as a luxury retailer. The strategy extends to Apple’s dealers, resellers, and retailers, where the firm utilizes ‘minimum advertised price (MAP) to maintain relative comparable prices to minimal wholesale and own store discounts (Moorman, 2018). Through the strategy, Apple has been able to safeguard consumers from consumer discounting by retailers. Focusing on consumer loyalty through offered products instead of acquiring new clients using price ensures Apple provides an outstanding experience to consumers.
Sales personnel in other technology companies work tirelessly to cross-sell, up-sell, and any sell leaves them frustrated and confused. However, using Net Promoter Score (NPS), Apple can measure consumers’ willingness to recommend its products to other consumers. NPS is a significant success indicator for the company since it allows it to comprehend consumer loyalty. Through NPS, Apple can manage close to all the 500 retail locales alongside its staff, information that is gathered and shared with team stores daily (Moorman, 2018). To Apple, unpacking simplicity is an approach to master minimalism art, where the fundamentals are realized in user interfaces, product aesthetics, support functions, and advertising. The strategy, unpacking simplicity, has facilitated the company an opportunity to make easy-to-use products that are fast to comprehend and quick to adopt by non-experts. Apple not only focuses on simple products but also intuitive products. That translates to the creation of products with tremendous attention to each detail and the experience encountered when unboxing the products. The experience gives consumers an enjoyable feel, which makes it possible to share product information with others through consumer loyalty.
The last strategy, starting with the why, ensured Apple comprehended that its products were meant to inspire first and meet consumer needs, which it has centered in its marketing efforts. The strategic approach allows the tech firm to start each innovation with the question of why in mind, which enables it to connect with its consumers effectively. With the understanding, unlike its rivals, Apple trains its employees to speak to its consumers on the aspirations and benefits of the products rather than talking in jargon (Moorman, 2018). The strategy has played an essential role in the establishment and maintenance of supportive experience and consumer-centeredness.
Reference List
Antitrust. (2021). Antitrust overview.
Apple Inc. (2020). Form 10-K: Annual report.
Apple Inc. (2021). Apple reports fourth quarter results.
Begg, D., & Ward, D. (2020). EBOOK: Economics for business, 6e (6th Edition). McGraw Hill UK. Web.
Cain, G. (2020). Samsung vs. Apple: Inside the brutal war for smartphone dominance.
Campbell, M. (2020) “Apple spent $7.4M on lobbying efforts in 2019, well below outlays from Amazon and Facebook” Apple Insider.
Clover, J. (2020). COVID-19 coronavirus: Impact on Apple’s iPhone, Mac and WWDC.
CNBC. (2020). “Apple becomes first U.S. company to reach a $2 trillion market cap.” Web.
Dornbusch, R., Fischer, S., & Startz, R. (2018). Macroeconomics. McGraw-Hill Education.
Ellsworth, M. (2019). Price elasticity: What it is and why it matters.
Hoxie, J. (2018) “Commentary: Apple avoided $40 billion in taxes. Now it wants a gold star?” Fortune.
Kabir, R. (2021). First Apple-1 computer, hand-built by Steve Jobs & Steve Wozniak, fetches $400,000 at US auction.
Kellion, L. (2020). Apple faces two EU anti-competition probes.
Kolakowski, M. (2021). At $2.8 trillion, Apple is bigger than these things.
Macrotrends. (2021). Apple Financial Statements 2005-2021 | AAPL.
Martins, D. (2021). The Federal Reserve’s monetary policy: What Apple investors should know? Web.
Mishra, V. (2021). Monthly pulse: Xiaomi becomes #1 smartphone brand globally for first time ever. Web.
Moorman, C. (2018). Why Apple is still a great marketer and what you can learn.
Nellis, S. (2019). Apple lowers some iPhone prices outside U.S. to offset strong dollar.
Rosenstock, J, & Rachel, W. T. (2021). Apple commits $430 billion in US investments over five years.
Simply Wall St. (2021). Under the bonnet, Apple’s (NASDAQ: AAPL) returns look impressive.
Statista. (2021). Lobbying expenses of Apple in the United States from 2009 to 2020.
Statista. (2021). Manufacturing labor costs per hour for China, Vietnam, Mexico from 2016 to 2020.
Tibken, S. (2017). “Apple vs. FBI one year later: Still stuck in limbo.” CNET.
Appendix