Population and Sampling Techniques
Business research equips organizations with sound evidence supporting their decisions or enabling managers to develop forecasts. The exploration of employees’ attitudes towards projects, events, decisions is also an important part of big companies’ functioning since people’s perspectives have a considerable effect on organizations’ performance (Chakrabarti & Guha 2016). When it comes to payments and working conditions, people’s opinions are specifically relevant as these attitudes may affect the turnover rate. In order to examine employees’ response to the introduction of a holiday pay scheme, it is important to pay specific attention to such concepts as population and sampling techniques. This paper includes a brief discussion of the relevance of these aspects with the focus on Kingship Plc.
Population Relevance
One of the first steps to undertake is to choose the target population. Kingfisher is a British retailer employing 74,000 people and operating in ten countries across Europe (Annual report and accounts 2015/16 2016). According to sampling theory, generalizations cannot be made beyond the population (Bell, Bryman & Harley 2018). Therefore, it is necessary to consider whether the new pay plan will be universal or utilized in some countries, which is also an option. For the introduction of the payment plan that will be applied to all employees, it is necessary to conduct a survey in all countries. In that way, it will be possible to generalize findings to the population of Kingship.
The use of the quantitative research method can be beneficial for identifying people’s views on the pay scheme as it will enable top management to forecast the way the new policy will be accepted. In companies employing a limited number of people, it can be comparatively easy to identify employees’ attitudes, and all people can be involved. However, with such a considerable population (74,000 people), it is too costly and time-consuming to involve all people in the research (Sekaran & Bougie 2016). For the purpose of the suggested survey, it is important to choose a representative sample (Hair et al., 2015). This sample will include people with the characteristics typical of the entire population that can be rather heterogeneous as Kingship operates in many European countries.
Covering all groups that can be found in the population of the organization will also ensure the validity of the data. The most apparent demographic characteristics should be noted, which will help in interpreting data and exploring employees’ attitudes. Such features as gender and age are most common, although it is possible to include country, years of work at the organization, job, and social status (marriage and children) (Bell, Bryman & Harley 2018). These attributes can have an impact on people’s views on holidays and holiday pay plans. As mentioned above, people pay much attention to work-life balance, and their personal life influences these perspectives. For instance, married people with children may need a holiday, and they would like to have a paid holiday. At the same time, single people or those without children may need fewer days, and the pay plan preferences can differ from those of married people views. The working conditions of different employees vary due to the peculiarities of their jobs, which also influences people’s attitudes towards work and holidays.
Sampling Techniques
In order to obtain valid data, an effective sampling technique should be utilized. Several sampling techniques are available for business researchers implementing quantitative studies. Probability sampling is the most appropriate technique for the case in question. This procedure minimizes bias by ensuring the random selection of participants (Bell, Bryman & Harley 2018). In simple terms, every employee will have equal chances to take part in the survey, so all views have equal chances to be analyzed. This approach also ensures the collection of generalizable data that will help in identifying the exact attitudes of employees.
Researchers may choose the random sampling method that covers all the population of the company (Sekaran & Bougie 2016). Nevertheless, the company employs a different number of people in different countries, which can make the findings rather distorted. The use of such results can lead to making ineffective decisions and even certain losses for the organization. Therefore, it is necessary to implement the surveys in each country. At that, researchers have to ensure that the proportionate number of participants from each geographic area will take part in the survey.
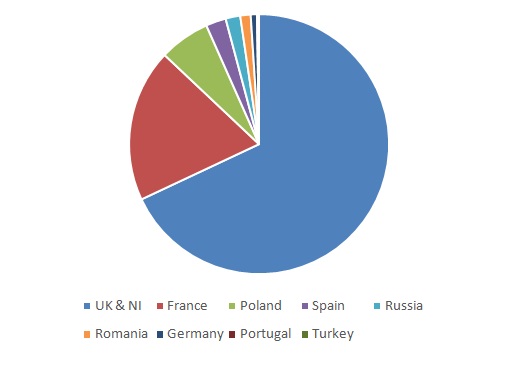
This approach implies the identification of the overall number of employees working in each country and choosing an appropriate proportion of people to be included in the survey. For instance, the largest part of the sample will be UK employees as this Kingship’s division has the vast majority of employees (see Figure 1) (Annual report and accounts 2015/16 2016). Although the divisions in Turkey, Germany, and Romania employ a comparatively small population, it can be necessary to implement the survey in these countries as well. This comprehensiveness will ensure the validity of the findings and conclusions based on them. Still, this approach has a number of limitations, so it cannot be used in the current situation. It is insufficient to include geographic features as people’s attitudes are formed by various factors.
As mentioned above, the population of Kingship employees is rather heterogeneous, so eliciting attitudes with the use of simple random sampling can have limited validity and fail to reach the purpose of the research. Even if the research is held with the use of proportionate data from the company’s divisions, the results may be invalid. The population of each division is also heterogeneous, so it is essential to pay attention to these peculiarities. Complex probability sampling provides more informative data that can help in making the right decision (Sekaran & Bougie 2016). Several types of complex probability sampling exist, but they all imply a division of the population in accordance with certain characteristics.
Stratified random sampling can be the most appropriate technique to be used due to its efficiency and affordability. As mentioned above, such features as gender, age, job, and social status have an effect on the way people see the holiday. Therefore, the sample should be stratified in accordance with the identified groups (Bell, Bryman & Harley 2018). For example, 39% of the overall workforce is constituted by females (Annual report and accounts 2015/16 2016). Hence, 39% of the participants taking part in the survey should be females. Likewise, it is necessary to identify the proportion of people of different ages (young adults, adults, middle-aged), jobs, and social status, which will help in exploring these groups’ attitudes.
Conclusion
On balance, it is necessary to state that the conduction of business research is a complex process requiring the investment of time and other resources. Researchers should pay specific attention to such concepts as population and sampling technique as they have a considerable impact on findings validity. Since people’s attitude towards quite a sensitive aspect is in focus, it can be necessary to collect stratified data. Researchers should consider such demographic features as gender, age, social status, and job. These characteristics have an impact on the way employees view holiday and holiday pay as people have to balance their professional and personal lives according to many circumstances. It is also advisable to conduct surveys in all divisions to evaluate people’s views across countries and the applicability of the new policy in the entire organization. Therefore, the stratified sampling technique can be regarded as the most appropriate option for the exploration of Kingship employees’ attitudes towards a new holiday pay policy.
Primary and Secondary Data
Business research, as studies in any other sphere, implies the use of data that can be primary and secondary. Both types of information can be employed to address various research questions. These types of data can be combined to enhance the validity of findings (Bell, Bryman & Harley 2018). Primary and secondary data have their peculiarities, which have to be considered when implementing a study. It is critical to pay attention to such areas as the purpose of the research, available resources, timeframe, availability of information, and its generalisability. Clearly, in some cases, only a particular type of information can be utilized, which will be discussed in this section.
Primary Data
First, it is necessary to consider the peculiarities of primary and secondary data prior to identifying their benefits and limitations. Primary data is obtained by the researcher using such tools as surveys, observations, interviews, and content analysis (Bell, Bryman & Harley 2018). An investigator implements the projects by collecting data and analyzing the obtained information. This type of information seems a preferable source of evidence for any study as the researcher can be sure about its validity since the methodology is known. It is important to stress that the relevance, reliability, and validity of primary data are a complete responsibility of the investigator.
However, in order to receive primary data, it is necessary to invest a substantial amount of time and other resources. Clearly, when the data are not available from other resources, the alternative to the acquisition of primary data does not exist. For example, if the attitude of employees towards a new policy or project is under study, primary data should be collected. However, when managers are interested in particular trends or the overall population’s preferences, it is possible to find the corresponding information in statistical reports or peer-reviewed articles (Hair et al., 2015). The use of this information can become a sound ground for making some decisions and will not be time-consuming or too expensive. Hair et al. (2015) also note that the collection of primary data is often preceded by the review of secondary data. This method enables researchers to formulate research questions and hypotheses, identify the most relevant aspects to explore, and choose the most appropriate methodology.
Primary data collection is always used to provide annual reports. In addition to the financial information, companies include some demographic peculiarities of their employees, as well as an overview of certain operations and trends existing in the markets they operate in. This approach to data collection is also utilized at Kingship that develops its annual reports each year. For example, the 2015/2016 report contains information about employees’ gender, which is an important set of information unveiling the organizations’ equity and sustainability policies (Annual report and accounts 2015/16 2016). This information can hardly be found in up-to-date secondary resources, and the collection of this kind of data does not require a significant investment of time and money.
Secondary Data
As far as secondary data is concerned, it is, by and large, the information received from other sources and researches. For instance, when implementing business research, a manager can use the statistics and reports available from governmental resources or findings published in peer-reviewed articles. The use of this information is specifically justified when external aspects are researched. For instance, business researchers can employ secondary data regarding consumers’ preferences, the performance of organizations, the analysis of countries’ economies, and similar topics. Sekaran and Bougie (2016) claim that it is critical, however, to make sure that certain criteria are met. When utilizing secondary data, researchers should consider the information timeline and make sure that the data is up-to-date. The accuracy of secondary data is another feature to focus on since it has a significant effect on its validity. It is important to identify the purpose of the study and the conflict of interests, if any. Relevance is also a central aspect to consider since some data can hardly be applicable to different studies.
At this point, it is necessary to identify the disadvantages of secondary data use. For example, the reliability, validity, and relevance of this type of information can be insufficient for the purpose of specific studies (Hair et al., 2015). Secondary data can be characterized by a high degree of generalization, so they can mislead researchers and result in wrong conclusions and decisions. For example, although people employed in the construction industry prefer definite leadership styles, people involved in retail can have other views.
As mentioned above, the use of a combination of both types of data can be beneficial for some studies. Bell, Bryman, and Harley (2018) illustrate the benefit of this approach by mentioning the researchers who collected primary data to address research questions and employed secondary data to validate their findings. Thus, the identification of employees’ attitudes towards a new holiday pay plan or healthcare insurance options can be supported by reviewing the data obtained in other organizations or industries.
Kingship also resorts to this method when addressing different questions. For instance, the company implemented a study to identify the peculiarities of the markets it operates in. The company’s researchers surveyed 15.000 people in eight European countries (Our markets 2019). Simultaneously, they used secondary data to validate their findings and learn about some aspects of the issue. The managers utilized the reports of an international institution, AMA Builders Merchants, and business research company, Mintel Europe (Our markets 2019). This method enabled the company to obtain insights into the way markets develop without the need to conduct a study that would require substantial financial investment and will be rather time-consuming. The data is relevant as the focus is on specific markets. The reliability and validity of the information are ensured by the reputation of these international organizations that specialize in data collection and analysis.
Conclusion
To sum up, it is necessary to state that business research involves the collection of primary and secondary data. The former is characterized by a high degree of relevance, validity, and reliability (see Table 1). Primary data is collected to identify internal trends and features as this information is often unavailable from other sources. Secondary data is associated with a high level of generalisability, while its relevance, reliability, and validity need specific attention. The latter can be collected within a short time span and with minimal financial investment, which makes the use of secondary data viable for business research. A combination of the two types of information is also common as secondary data can validate and amplify primary data.
Table 1. Summary.
Statistics
Organizations use various data to estimate their overall performance and shape their management strategies if necessary. Retail profit can be an informative feature to consider when evaluating the performance of a retailer. Kingship provides the corresponding information in its annual reports each year (see Table 2). It is clear that the company has shown steady growth since 2012 (Company reports 2019). This year is still unfinished, so the retail profit for this year can change. Therefore, this number was excluded from this retail profit analysis.
Table 2. Retail profit between 2012-2018.
As for the statistical analysis of the primary data provided above, it is possible to identify the mean, mode, and standard deviation. It is necessary to note that the more figures are available, the more precise these statistical features will be. The mean is a simple average of a range of numbers (Sekaran & Bougie 2016). It is produced by subtracting the sum total of all figures by the number of these figures. For the primary data mentioned above, the mean is 777 (see Table 3). The mode is the number that is most frequently used in the row of figures. In the data set under study, there are no equal numbers, so the mode is not available.
Table 3. Statistics.
The standard deviation shows the amount of dispersion in a set of numbers. This measure highlights the degree to which the numbers are dissimilar (Bell, Bryman & Harley 2018). In simple terms, the standard deviation is the square root of variance. In order to calculate variance, it is necessary to undertake two major steps. The researcher should obtain a squared difference by subtracting the mean from each number in the row and squaring it. The result of this manipulation should be averaged to get the variance. The figures under analysis are not significantly dispersed, so the standard deviation is not high (59,11).
In conclusion, it is possible to note that primary data can be manipulated in different ways to reveal certain trends. Various instruments to calculate various measures are available, including statistical software, such as SPSS or Microsoft Excel. These tools are essential when big data is analyzed, but with a small set of numbers, calculations can be manual. Statistical analysis is critical for business research as it helps to evaluate organizational performance and develop forecasts.
Management Information Systems
The modern business world is characterized by innovation, changes that take place at a high pace, and big data use. Managers have to operate various sets of information in order to make decisions on a daily basis. As mentioned above, business analysis is a vital component of management as it results in evidence-based decisions. Managers collect and process different types of information and create strategies, marketing projects, supply chain solutions, and so on. The abundance of data and scarcity of time make the use of technology essential. Management information systems (MIS) have been widely employed in organizations in numerous industries, including construction, e-commerce, and retail (Sekaran & Bougie 2016). The contemporary business environment is highly competitive, and the facilitation of the decision-making process with the help of MIS is critical. This section includes a brief analysis of the benefits of the use of MIS with a focus on the retail industry and Kingship operations.
Definition and Types of MIS
First, it is necessary to define the term and identify the peculiarities of MIS. Management information systems are instruments utilized to assist in the decision-making process by addressing operations, processes, and information technology (Sekaran & Bougie 2016). MIS does not only collect data (which is not their primary goal, but they have this function as well) but provides reports based on the obtained data. Importantly, the reports and data can be accessed by all employees or some individuals, which makes the use of information systems beneficial for the organization, especially when it comes to data security and confidentiality issues. The development of cloud computing has enabled multinationals to operate valuable data and make it accessible irrespective of geographic locations or time zones, which is essential for making various decisions.
The development of information systems and their effective use is often guided by the systems theory. This theoretical paradigm implies the analysis of organizations and their elements as systems that interact and affect each other (Giachetti 2016). One of the central principles of this framework is organizations’ performance that depends on external and internal factors that constantly interact. The use of information systems is consistent with this view as these instruments enable managers to analyze internal and external forces and the way they affect the company. For instance, such organizations as Kingship can collect the data regarding the most popular products among customers and identify the exact features and associated business operations that created this popularity.
Primary Stakeholders and Benefits
This term refers to a set of MIS that are associated with different operations and processes. For instance, management information systems include executive information, marketing information, business intelligence, customer relationship management, transaction processing, knowledge management, financial accounting, human resource management, and supply chain management. It is noteworthy that all the types of MIS are valuable for organizations, while some of them can be pivotal in certain industries. For instance, human resources management and financial accounting systems are vital for almost all businesses, including small and medium-sized companies (Hair et al., 2015). These systems help in the creation of reports that unveil the primary business results. The former also ensures the provision of properly formatted documents to different institutions helping employees to comply with the existing standards. Executive information and knowledge management systems are specifically beneficial for big companies and multinationals. These companies have to operate a substantial bulk of data and make decisions that influence the performance of divisions in different countries and the entire organization. Supply chain management and customer relationship management can be specifically relevant for organizations operating in the e-commerce and retail industries.
As mentioned above, existing types of MIS serve diverse groups and purposes. For example, executive information systems help in making decisions at the highest organizational level (Sekaran & Bougie 2016). Executives use high-level information that can be drilled down, which is instrumental in making strategic decisions. The primary stakeholders that utilize these systems are top managers. These people often have exclusive access to this kind of information, which contributes to data security enhancement. For instance, such companies as Kingship can make strategic decisions regarding the development of new markets based on the reports generated by an executive information system. Marketing information systems use the data associated with marketing campaigns that help in evaluating their effectiveness (Annual report and accounts 2015/16 2016). Marketing professionals are primary users of these systems, and they employ the data and reports to assess the strong and weak points of past and current marketing projects, as well as to develop new ones. Business intelligence systems are also instrumental in making diverse decisions regarding numerous business operations. Executives and managers at different levels can use the data and generating reports.
Customer relationship management systems enable companies to store and process information concerning sales, customers’ personal and contact information, and associated data. Professionals involved in marketing, sales, and customer service are primary stakeholders. They analyze the information and develop strategies and projects accordingly, as well as provide their reports to high-level managers. Kingship also makes use of customer relationship management systems to improve the quality of provided products and services and increase sales (Annual report and accounts 2015/16 2016). This system assists in developing marketing strategies, creating new products and services, and attracting new customers. Employees use the system to develop effective relationships with customers and cater to their needs. Marketing research is often based on the analysis of data collected and processed by customer relationship management systems. Transaction processing and supply chain management systems are also vital for retailers as these instruments ensure proper product flow and efficient delivery channels.
Financial accounting systems and human resource management systems are commonly used by many companies irrespective of their size and the industries they are involved in. The systems are used by managers of the corresponding departments, while executives also have access if necessary. The financial accounting system helps in managing finances and designing reports to different institutions and authorities. Human resources management systems serve to ensure the availability of the necessary professionals in all departments and divisions. In addition, the systems are instrumental in identifying the gaps in employees’ knowledge and skills and developing effective training programs that would enhance people’s performance (Annual report and accounts 2015/16 2016). An illustration of the data these systems can provide is the contribution of the employees of each division to the company’s profit. Motivational and retention programs can be supplied with sound evidence with the help of such systems.
Conclusion
To conclude, the use of management information systems is beneficial for organizations operating in diverse industries and business environments. Systems theory is the theoretical framework that is often regarded as central to analyzing companies’ performance and the effectiveness of information systems. Large companies and multinationals also utilize these tools that are instrumental in making decisions regarding strategic management, customer relationship management, sales, accounting, knowledge management, and human resources management. People employed at different organizational levels benefit from the use of these systems, enhancing their performance. It is necessary to add that the development of technology enables companies to ensure data security by introducing different access levels and enabling employees to access data irrespective of time or their geographic position. The use of the systems ensures making quick, evidence-based, and effective decisions that make companies competitive in the modern business environment.
Reference List
Annual report and accounts 2015/16 2016, Web.
Bell, E, Bryman, A & Harley, B 2018, Business research methods, Oxford University Press, London.
Chakrabarti, S & Guha, S 2016, ‘Differentials in information technology professional category and turnover propensity: a study’, Global Business Review, vol. 17, no. 3, pp. 90-106.
Company reports 2019, Web.
Giachetti, R 2016, Design of enterprise systems: theory, architecture, and methods, CRC Press, Boca Raton, FL.
Hair, JF, Celsi, MW, Money, AH, Samouel, P & Page, MJ 2015, Essentials of business research methods, M.E. Sharpe, London.
Our markets 2019.
Sekaran, U & Bougie, R 2016, Research methods for business: a skill building approach, John Wiley & Sons, Chichester.