Executive Summary
The report provides an analysis of the data assets management of LuLu hypermarkets system. The main advantages and disadvantages of the system are identified. Despite the fact that the implemented scheme provides ample opportunities for manipulating atomized data and changing their format and presentation method as necessary, it is relational, with dependent datamarts, which slows down access to data, requiring more time to complete queries due to the different organization of atomic and summary data. In addition, due to the different information needs of the departments, the quality of the final data for analysis can significantly deteriorate. It is proposed to modify the existing system on a spiral basis, using the InfoVisor solution, which will ensure complete coordination of data with the characteristics of business processes.
Introduction
Enterprise architecture is a tool for a systematic description of the functioning of the order and the principles of development of the organization. Initially, this tool was used in complex IT projects to clarify business requirements and design information systems and technical infrastructure. However, since the beginning of the 2000s, enterprise architecture has been increasingly used to support organizational transformations, allowing managers to link various development initiatives, translate the strategy into actions, and ensure the coherence of various elements of the enterprise (Anderson, 2015).
This report provides an integrated assessment of the architecture of the Lulu Group International hypermarkets as a management object that provides a common view in the business and interconnection of parts into a single whole. The main problems and risks associated with the principles of building the architecture of the enterprise are identified and recommendations for improving the architecture and raising the quality of its functionality are proposed.
Data Assets Identification
Many business leaders understand that it is necessary to achieve compliance of data management and analysis systems with the requirements of modern business, but it is not always clear how to do this. This is explained by the fact that most often enterprises either spend an insufficient amount of money on optimizing business processes, since there is no certainty about how to act correctly, or, conversely, invest heavily in insufficiently thought out projects that do not bring corresponding returns. Therefore, it is necessary to look for new methods and ways of modifying business processes, achieving their compliance with the IT infrastructure, which can be achieved by the correct construction and improvement of enterprise architecture.
Typically, enterprise architecture takes the form of an integrated set of models that describe the structure and functions of an enterprise. Separate models in the enterprise architecture are organized logically, which provides an ever-growing level of detail of the enterprise. This leads to the fact that the architecture of the enterprise must be continuously improved and refined, following the changes in the macro- and microenvironment of the enterprise.
When developing a project of enterprise architecture and its implementation in the activities of the organization, it is important to be able to assess the level of the result. The maturity level of the enterprise architecture shows the level at which the enterprise is at a given time. Assessing the maturity of enterprise architecture demonstrates the maturity of the enterprise itself and displays the results that it needs to focus on in order to achieve the desired improvements in its activities.
Ineffective control over the presentation of data, semantics, and models leads to serious risks for business applications. When applications are developed independently, they can use incorrect business terms and many models for common data concepts, which often reduces the value of consolidated data arrays.
An enterprise should understand its current level of maturity and use this as a basis for increasing the maturity of enterprise architecture practice. Achieving higher levels of maturity is not an end in itself. Rather, a higher maturity of enterprise architecture will allow for the realization of many of the advantages of enterprise architecture. In addition, an understanding of the current level of maturity of an enterprise architecture allows organizations to recognize how this level of maturity restrains what can be achieved and to determine expectations accordingly.
Implementing best practices requires the integration of processes and technologies, specification of data requirements, metadata management, and data modeling. These tools are used most effectively only when the knowledge gained through technology can be used throughout the application development cycle, when the tools and methodologies provide transparency throughout the design phase from requirements to implementation and transition to production, when a link between conceptual presentation and data copy can be drawn (Morrison, 2015). Thus, the influence of the system can be traced for all corrections or changes in semantics or structure at all levels of data accuracy.
LuLu’s IT environment is represented by more than 20 corporate information systems, 300 data channels connecting stores and distribution centers with a central office, several server rooms integrated into a distributed data center. The IT service supports more than 6 thousand user jobs in different regions of the country.
Intensive growth of LuLu’s business entailed an increase in the number of users and the amount of data used, an increase in the load on existing information systems, and the emergence of new information systems. This served as a driver of a large-scale initiative of the retailer’s IT service to review the capabilities of the existing IT infrastructure and to search for new technological solutions to increase the speed of data processing and generate operational reporting.
For LuLu tasks, the Oracle Exadata software and hardware complex was chosen as the optimal, according to the management, solution. The choice is due to both technological criteria (fault tolerance, scalability, performance), and the fact that the Oracle solution makes it possible to consolidate the databases of most business-critical systems using Oracle Database.
As of today, the corporate resource management system (SAP ERP) and a number of other business applications have been transferred to Oracle Exadata. The productive use of Oracle Exadata for SAP applications has shown that business expectations for productivity gains have been fully achieved. Multiple productivity gains and consolidation of IT resources are an advantage of the optimized LuLu complex.
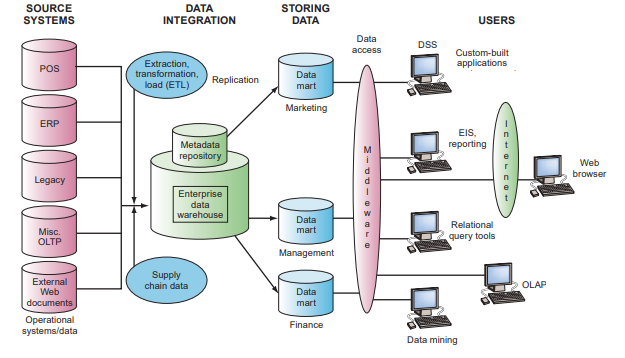
The company’s architecture is built according to the type of traditional data warehouse architecture and has a three-level structure consisting of the following levels:
- Lower level: this level contains a database server used to extract data from many different sources, for example, from transactional databases used for front-end applications.
- Mid-tier: The mid-tier contains an OLAP server that transforms data into a structure that is better suited for analysis and complex queries. An OLAP server can work in two ways: either as an advanced relational database management system that maps multidimensional data operations to standard relational OLAP operations, or using a multidimensional OLAP model that directly implements multidimensional data and operations.
- Upper level: the upper level is the level of the client. This layer contains tools used for high-level data analysis, reporting, and data analysis.
The architecture model is of the Star type and represents a centralized Storage with dependent datamarts.
Data Architecture Evaluation and Recommendations
In the process of architecture analysis, the Software Architecture Analysis Method (SAAM) was used.
The information architecture describes how information technology provides an organization with the ability to quickly make decisions, disseminate information within the organization, as well as beyond, for example, business partners. Information architecture is a kind of “mirror image” of business architecture. Business architecture answers the following question: “Given our common vision, goals, and strategies, who will do what?” The information architecture answers the question: “What information must be provided so that these processes can be carried out by those who must carry them out?” (Anderson, 2015).
The information architecture includes models that describe information processing (information value chain) processes, the main information objects related to business events, information flows, information management principles. The architecture should describe both the data that is required for the execution of the processes (operational), and the analytical data and “content” published on the Web.
The company uses Bill Inmon’s approach, which is based on the fact that the data warehouse is a centralized warehouse for all corporate data (Morrison, 2015). With this approach, the organization first creates a normalized data warehouse model. Then, dimensional datamarts are created based on the warehouse model. This is known as a top-down approach to data warehousing (Anderson, 2015). The scheme of LuLu data architecture is presented below.
Inmon’s atomic approach is essentially strategic and seeks to capture all enterprise data in 3rd normal form and store all this atomic data in a data warehouse. Inmon defines a data warehouse as subject-oriented, consistent, supporting a chronology and an integrated data source (Morrison, 2015). The properties of Inmon’s data warehouse are as follows:
- Subject-oriented ‑ the repository is organized in such a way that the data associated with the subject area are related to each other.
- Variability ‑ after input, the data is never updated or deleted, but stored for future reporting needs.
- Chronology support ‑ due to the invariable nature of the data and the need to create reports based on time, after the data are entered into the warehouse, they cannot be changed: new records must be added to reflect data changes over time.
- Integration ‑ data comes from all information systems of the enterprise and are organized in a consistent and unified manner.
The model also creates datamarts, representing targeted to subjects or units subsets of the data warehouse that are designed to meet the data needs and reporting of the target group of business users.
This model has several advantages. First, all corporate data is fully documented. This process gives the organization a complete picture of its processes, products/services, customers, suppliers, etc. Such documentation is invaluable for the organization, since in most cases, until that moment, each system was launched in isolation. Now the organization can really define the various processes, products, or parties with which it interacts on an ongoing basis.
Secondly, the data is effectively stored in the 3rd normal form in one repository. This storage methodology makes it easy to find and store data from transactional systems already defined in 3rd normal form.
Finally, data is readily available for retrieval in datamarts for business users. Now, when hat the data is fully defined and efficiently stored, a team working with the data warehouse can create data related to business units. These datamarts are created so that the business unit can quickly and efficiently answer their questions. It will also provide the user with detailed data supporting the data store as well as the origin of the data. This information is often critical to the approval and functional use of a data store by a business user.
At the same time, there is a rather serious problem ‑ the lack of necessary flexibility and vulnerability of the structure. Spatially organized atomic data is more difficult to make the necessary changes.
The Corporate Information Factory (CIF) begins with a coordinated extraction of data from sources. After that, a relational database is loaded containing the corresponding cleaned and consistent (“atomic”) data. The resulting normalized storage is used to filling additional presentation data repositories, i.e., data prepared for analysis.
These repositories, in particular, include specialized repositories for the study and extraction of data based on the use of technologies for extracting useful information from “raw data” (Data Mining). After that, the main and, if necessary, additional repositories are used to create datamarts.
In this scenario, end datamarts are created to serve business departments or to implement business functions and use a spatial model to structure the summarized data. Atomic data remains accessible through a normalized data warehouse. Obviously, the structure of atomic and summary data in this approach is significantly different, which is not applicable to the systematic approach.
Despite the fact that this scheme provides ample opportunities for manipulating atomic data and changing its format and way of presentation as necessary, the relational scheme for organizing atomic data slows down access to data and requires more time to complete queries due to the different organization of atomic and summary data.
It is worth emphasizing that if the final presentation of the data is acceptable for use, then this approach can be considered viable. But the double work of preparing and storing atomic data is accompanied by significant additional costs and delays. Therefore, it is probably worth investing in resources and technologies to properly present additional key performance indicators for the business.
Unlike Bill Inmon’s approach, spatial models are built to serve business processes (which, in turn, are related to business metrics or business events), rather than business departments (Southekal, 2017). For example, data about orders that should be available for corporate use is entered into the spatial Data Warehouse only once, in contrast to the CIF approach, in which they would have to be copied three times into the data windows of the marketing, sales, and finance departments.
In this context, the most urgent problem is to provide an integrated view of a complex management object as a whole, a comprehensive analysis of the information collected about it and extracting from the vast amount of detailed data some useful information ‑ knowledge about the laws of its development.
We recommend modifying the existing system based on the InfoVizor software package, as a result of which management decision support based on the accumulated information can be carried out in three main areas:
- The area of detailed data. This is the scope of majority of transactional systems (OLTPs) aimed at finding information. In most cases, relational DBMSs cope efficiently with the tasks that arise here.
- The area of aggregated indicators. A comprehensive look at the information collected in the Data Warehouse, its generalization and aggregation, hypercubic representation, and multivariate analysis are the tasks of online analytical data processing (OLAP) systems (Southekal, 2017). Here one can either focus on special multidimensional DBMSs, or (which, as a rule, is preferable) to remain within the framework of relational technologies. In the second case, pre-aggregated data can be collected in a star-shaped database, or information can be aggregated “in the process” of scanning detailed tables of a relational database.
- The field of laws. Intelligent processing is performed by data mining methods, the main tasks of which are to search for functional and logical patterns in the accumulated information, build models and rules that explain the anomalies found and/or (with a certain probability) predict the development of the processes under consideration.
The software package is an instrumental shell for creating information-analytical systems (IAS) covering all of the above types of data processing. The basis for the presentation of information about the structure of relational databases used in conjunction with InfoVizor toolkit is metadata ‑ navigational (intended for search and data modification tasks), analytical (created to implement multidimensional analysis of accumulated information), and operational (providing automatic filling of data storage from external information sources according to pre-approved scenarios). Due to the presence of such metadata, almost any consistently designed database can be adapted for use as a content-rich IAS based on this toolkit. Thus, the invariance of the software with respect to the structure of the presentation of the source information is achieved.
Data Security Evaluation and Recommendations
The main risks are the risks of business losses associated with the variability of business processes. Moreover, losses occur because business processes need to be changed, and the information system is not ready for this, and losses are associated with suboptimal functioning of the business. In addition, without resolving the issue of protecting data quality, the security system of the enterprise as a whole cannot be effective.
In turn, operational risks for automated operations may arise due to technical risks. For example, the operational risk “Order information cannot be transferred for processing to the system” may arise due to the implementation of the technical risk “Communication channel interruption.” This is due to the dependence of datamarts.
We formulate the basic requirements for data warehouses:
- Support high speed data retrieval from storage;
- Support for internal data consistency;
- The ability to obtain the equation of the so-called data slices (slice and dice);
- The availability of convenient utilities for viewing data in the repository;
- Completeness and reliability of the stored data;
- Support of a high-quality data replenishment process
Typically, data requirements represent a ‘by-product’ of the functional requirements of the business processes described for currently developing applications. These data requirements are formulated to meet specific functional needs, and they do not meet the requirements and are not adapted for use by other possible business processes. As data arrays are centralized and repurposed, there is a corresponding need to customize development processes so that corporate requirements are tracked and integrated into the data architecture.
When creating data warehouses, very little attention is paid to cleaning up incoming information. Apparently it is believed that the larger the storage size, the better. This is a vicious practice and the best way to turn a data warehouse into garbage dump. Data must be cleaned. After all, information is heterogeneous and is collected from various sources. Namely the presence of multiple points of collection of information makes the cleaning process especially relevant.
Quite often, there are events that get out of the overall ‘picture.’ Best of all, these values should be adjusted. This is due to the fact that forecasting tools do not know anything in the nature of processes. Therefore, any anomaly will be perceived as a completely normal value. Because of this, the picture will be distorted ‑ an accidental failure or success will be considered a regularity.
Using testing, we obtained analytical dependencies between errors at the input and output of the decoder by modeling continuous encryption based on shift registers with feedbacks. The boundaries for increasing the number of distorted binary bits in the sequence at the output of the decoder are established. The influence of block cryptographic transformation of information on increasing the probability of errors at the output of the decoder is determined.
It is shown that by choosing a strategy for managing parallel execution of transactions, one can achieve a sufficiently high efficiency of the functioning of operational databases, which are data sources for storage. The proposed version of the combined strategy preserves the advantages of optimistic and pessimistic strategies and reduces their shortcomings, i.e., provides an acceptable response time with few errors.
We recommend the use of an iterative or “spiral” approach when creating large data warehouses, that is, the “construction” of the warehouse not immediately, but in parts. This allows, if necessary, to make changes to small blocks of data or program codes and eliminates the need to reprogram significant amounts of data in the repository. The same can be said about potential errors: they will also be localized within a relatively small array without the risk of spoiling the entire storage.
Another important task that needs to be solved within the framework of consolidation is to assess the quality of data in terms of its suitability for processing using various analytical algorithms and methods. In most cases, the initial data is “dirty,” that is, they contain factors that do not allow them to be analyzed correctly, not allowing revealing hidden structures and patterns, establishing relationships between data elements, and performing other actions that may be required to obtain an analytical solution. Such factors include input errors, omissions, abnormal values, noise, contradictions, etc.
Therefore, before proceeding with the analysis of data, it is necessary to evaluate their quality and compliance with the requirements of the analytical platform. If during the quality assessment process factors are identified that do not allow the correct application of certain analytical methods to the data, it is necessary to carry out an appropriate data cleaning.
Enrichment allows more efficient use of consolidated data. It must be used in cases where the data do not contain enough information to satisfactorily solve a particular analysis problem. The enrichment of data allows increasing their information saturation and, as a consequence, their significance for solving an analytical problem.
The process of collecting, storing, and operational data processing at the enterprise contains several levels. At the top level, there are relational SQL-oriented DBMS Oracle. On the second ‑ file servers with some operational processing system or network versions of personal DBMSs of the R-Base type. Finally, at the lowest level, there are local PCs of individual users with personal data sources. Most often, information is collected on them in the form of office application files ‑ Word, Excel, text files, etc.
From the data sources of all the listed levels, information in accordance with some regulations should be moved to the data warehouse. To do this, it is necessary to ensure the unloading of data from sources, to convert them to a form corresponding to the structure of the data warehouse, and if necessary, to enrich and clean them.
Thus, data consolidation is a complex multi-stage procedure and the most important component of the analytical process, providing a high level of analytical solutions.
When developing a data consolidation strategy, it is necessary to take into account the nature of the location of data sources ‑ local, when they are located on the same PC as the analytical application, or remote, if the sources are available only through local or global computer networks. The nature of the location of the data sources can significantly affect the quality of the collected data (loss of fragments, inconsistency in the time of their updating, etc.).
As it was mentioned above, enrichment allows more efficient use of consolidated data, in fact, solving this problem.
The core of the ROLAP system provides the extraction of aggregated indicators in a multidimensional measurement basis. In this form, the numerical information is convenient for viewing and building reports, but as far as the analytical processing itself is concerned, ROLAP products themselves can perform only the simplest actions. For complex methods of analyzing information, ROLAP tools can be considered solely as a means of preparing source material. Therefore, the core of the InfoVizor system is implemented in such a way that external modules of intellectual and problem-oriented analysis can access it. Supplementing the system with such modules in each specific case of its application allows going into the field of laws and solve problems from the scope of Data Mining.
Conclusion
During the evaluation of the architecture of the LuLu hypermarket data assets organization and management, its inconsistency with the business structure, the dynamics of business processes and the tasks of various departments and divisions was revealed. First of all, we should note the lack of flexibility and the associated risks of incorrect application of certain analytical methods to the data.
The use of an iterative or “spiral” approach is recommended, which will allow making changes to small blocks of data or program codes without the need to reprogram solid amounts of data. Moreover, potential errors will be localized within a small array and will not adversely affect the storage as a whole. The InfoVizor system proposed for use will help to implement the client part of the OLAP system and will allow for the on-line multivariate analysis of the numerical data of arbitrary relational databases. This product is available in a two-tier client-server architecture and in an option for Intranet architecture. In addition, installing the intranet version of the product on a web server can simultaneously serve a large number of remote users who need only a network navigator at the workplace, thereby reducing the load on the enterprise information system.
References
Anderson, C. (2015). Creating a data-driven organization: practical advice from the trenches. Sebastopol, CA: O’Reilly Media.
Morrison, R. (2015). Data-driven organization design: Sustaining the competitive edge through organizational analytics. London, UK: Kogan Page.
Southekal, P. (2017). Data for business performance: The Goal-Question-Metric (GQM) model to transform business data into an enterprise asset. Buchanan, NY: Technics Publications.