Introduction
Growth for housing starts, completions and under construction was negatively affected by the economic downturn in 2008 with only 187,923 units registered. But this has surpassed the 1955 to 2013 historical average, which means that even if there was perceived negative growth the sector was performing well unexpectedly. The impact for Canada and the provinces was momentary as the country has recovered after the economic downturn and attained a steady growth.
The provinces that registered increases in housing starts in 2013 were Alberta and Manitoba, with Alberta having 7.8% increase, departing from the historical average recorded for 1990 and 2013. Alberta gained from the increased wages and employment due to investments in the oil sector which triggered in-migration to the province in 2013. These developments stimulated the need for new homes. Likewise, Manitoba’s increase in housing starts was triggered by low unemployment.
Analysis
The data shown in figure 1 represent their housing start levels for the period as indicated. The following analysis is based on these data compared to the 1990-2013 average levels. Housing starts for the period 2003 to 2013 have become steady at 207,258 units. There was a decline in 2009 because of the economic downturn, but it soon recovered during 2010 to 2011 with improved economic conditions supporting an increased need of housing starts, while the average is near the 1955 to 2013 historical mean. A moderate improvement in 2013 brought the level back to this historical average (“CMHC: Canadian Housing Observer” 3-1).
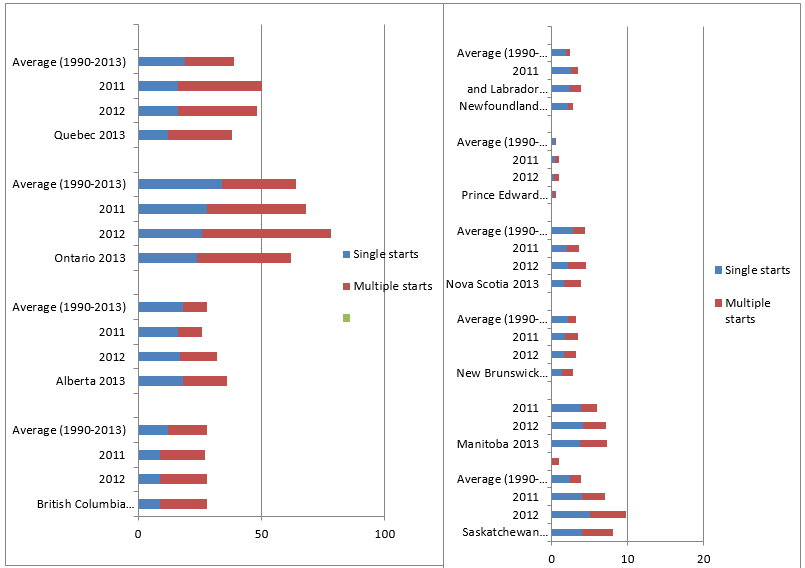
Meanwhile, among the Prairie province Saskatchewan registered a drop in housing starts for the same year 2013. This was reported by builders/contractors as they noted the growing list of completed and unoccupied homes. But this was momentary since in-migration supported the need for housing and so the level rose above the historical average.
In British Columbia, housing starts registered a steady growth at levels comparable to the 1990-2013 average. Figure 1 also shows that Ontario weakened in its record of housing starts in 2013. Later, the condominium builders slowed down their construction activity for apartment units. This made the levels closer to but above the average in Ontario.
Quebec also registered a decline by 20% in 2013. In regard to multiple housing starts Quebec’s level of activity surpassed the historical average. The list of completed and unoccupied units stimulates builders to decrease housing starts by 4 percent below the historical average.
Due to reduced economic activity and a relatively slower population growth in the Atlantic provinces, housing starts declined in Prince Edward Island which registered -32 percent, New Brunswick -14 percent, and Nova Scotia -13 percent. The levels of these provinces were below their 1990-2013 average levels.
The quantity of completed and unabsorbed dwellings and those attributed for 10,000 population had a steady increase since the end of the financial crisis in 2008. It remained at 2.9 which is above the 1992-2013 historical mean. This encouraged constructors to slow down their construction.
Existing Homes Recorded Stable Levels in 2013
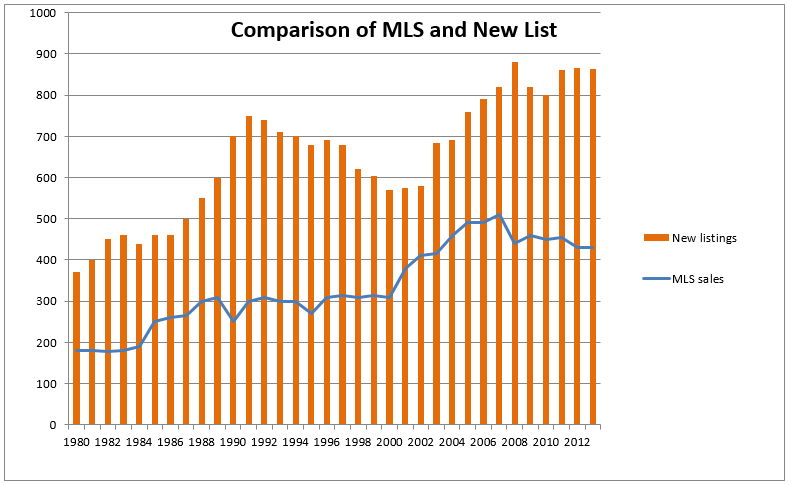
The Multiple Listing Service (MLS)® reported 457,761 existing homes sold in 2013 which was relatively unchanged from the previous 2012 level and maintained the 1980-2013 annual average sales of 339,313. Calculated to sales per 10,000 people it stood at 130 units, which is just above but can be considered near the yearly average of 112 sales.
People were still looking for completion homes, the demand was considered steady in 2013 but supply was falling at 0.7% or 866,890 units although previously, between 2009 and 2012, the demand registered an upward trend.
The New Listings in 2013
What is considered a way of roughly measuring the trend in the housing market experts use the sales-to-new listings ratio (SNLR). When the ratio is below 40%, it can be considered a buyers’ market, but when it is above 55% it is a sellers’ market. Suppose the SNLR is in the middle of these two thresholds, one can consider the housing market as balanced from a national context, with the average house price rising along with increase in inflation (“CMHC: Canadian Housing Observer” 3-8).
Thousands of units
The chart in figure 2 shows that the “sales-to-new-listings” recorded a balance of 52.8 ratio but it can be judged as near the sellers’ side since 2010. Price reacts to changing market situations. The chart also shows that the market fundamentals gradually shifted from balanced conditions to demand of completion dwellings due to improved economic situation. The period 1999 to 2007 marked a balance on the sellers’ side where the average MLS price grew at a yearly rate of 8.1%. As the years passed, balance market conditions emerged just close to the sellers’ market level, making the MLS 2007-2013 price stand at 3.2%.
The Important Role of Condominiums
In 2013 there was slower construction of condominium starts, when it fell into a low of 62,794 units from a high of 77,693 units the previous year. This decline, however, did not mean that it lagged behind the historical average. In fact, it was 50% above the historical average. Condominium construction plays a major role in the entire housing starts business. In the past, one out of five housing starts was a condominium.
Condominium starts were predominant in Vancouver, which reported 62.6 percent; the next is Montréal recording 56.3 percent, and the third is Toronto with a record 53.9 percent. The rental condominium market has been an increasingly significant component of rental housing in Canada. Rental starts are much lower compared to condominium starts; this was noted in the 1990-2013 level. Vancouver and Montreal had an almost similar requirement for rental starts as in the national average. Recent surveys for rental condominiums show that their vacancy rates are relatively low and stable. This means that demand for rental condominiums has grown and expansion is necessary (“CMHC: Canadian Housing Observer” 3-4).
Condominiums across Canada have almost similar features and are operated and owned privately, mostly by corporations. But there also differences, for example, terms that refer to condominium differ in how people call it (“CMHC: Condominium Basics” par. 25).
Completed and Unabsorbed Units
“New Housing Price Index” (NHPI) is a statistical method to measure variations in selling price of houses classified as “new single-detached” (“CMHC: Canadian Housing Observer” 3-5). The method uses housing specifications that have been continuous so that changes in quality of homes can be preserved. It notices periods when the list decreases which concur with NHPI growth, and some time when increasing inventory is accompanied by decreasing NHPI. This is demonstrated in figure 3.
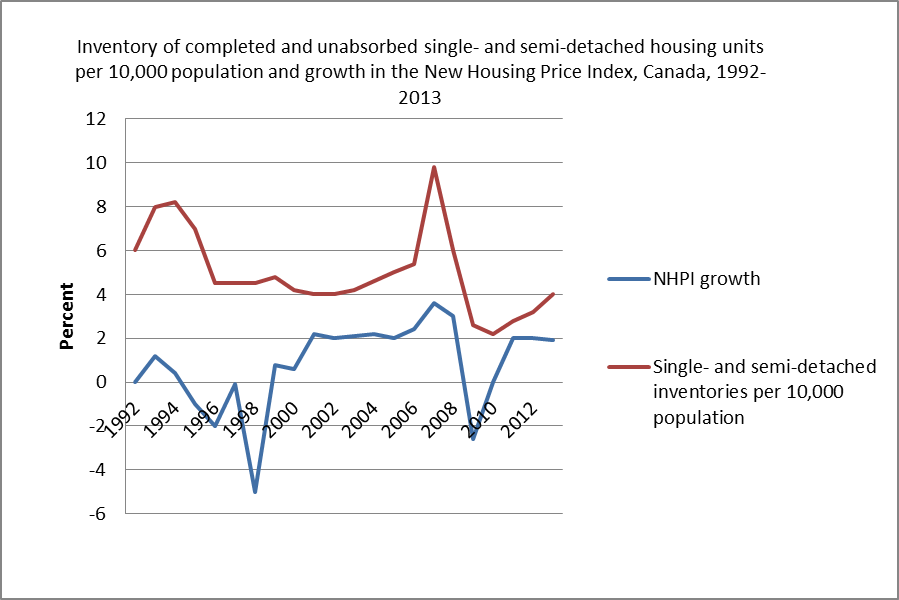
The inventory here revealed a very small increase of detached and semi-detached homes caused by the 2008-2009 global economic downturn. NHPI reflected a negative growth of -2.3% during that period.
The chart in figure 4 shows that new construction activity for SAAR (all areas) declined in January in 2016 but later increased in February 2016. The trend in all areas showed that it was almost even, or a very slight decline from the January to February data. From January 1990 up to the present, the trend started from a very high activity, registering at 275,000-280,000 new construction.
There was a sharp decline in the 1990s but fluctuated up to 1993-1995. Housing activity made a sharp ascent in 2006-2007 but slid down in 2008-2009 during the economic downturn. Canada’s housing activity recovered in 2010 up to 2012, and from that point up to the current period 2016 there has been a steady average growth – 199,107 to 198,880 socially adjusted housing starts.
The data reveal that for housing starts by dwelling, for single apartment, it was 6,072 in 2015 but increased in 2016 to 6,321. For semi-detached, the survey result was 1,247 in 2015 but decreased to 1,091 in 2016. For Row, the trend was 2,220 which increased to 2,459 in 2016. For apartment, it increased from 11,016 in 2015 to 12,781 in 2016.
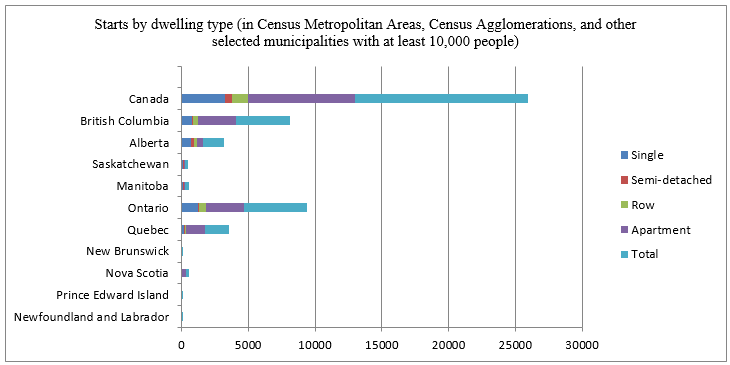
The chart above is based on a table from CMHC which provides data for starts by dwelling type. For a metropolitan area of 10,000 people the largest number of starts by dwelling type has been registered in Canada which has a total of 12,973. This is followed by Ontario with a total of 4,714, and the next is British Columbia with 4,046. The lowest is Prince Edward Island with only one start recorded for 2016.
Starts and Completion
A start refers to the time construction on a building is begun, such as when the concrete has been mixed for the construction project. A completion refers to the overall work of construction for a particular building or dwelling (“CMHC: Housing and Market Information” 3).
Data for Dwelling Starts for Canada, Centres of 10,000 people, and other areas.
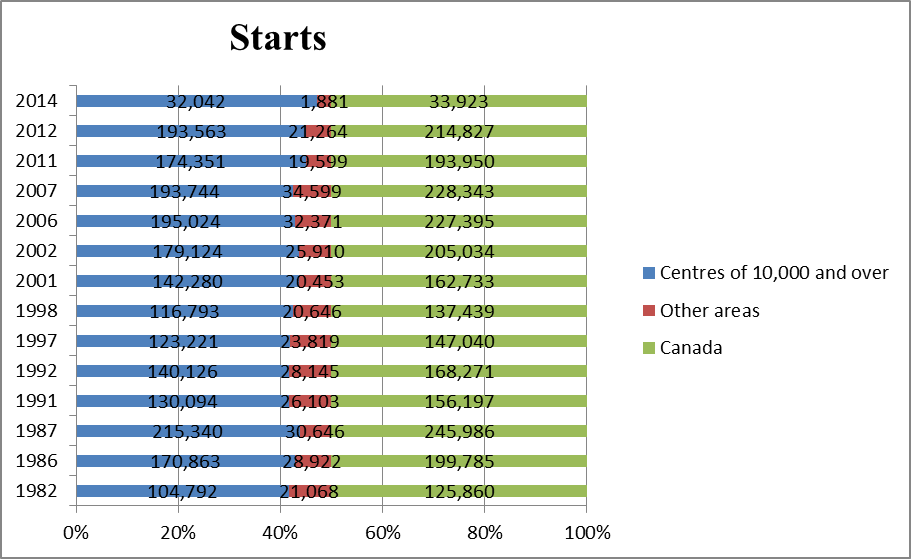
The data in the graph are provided in group periods, for example data collected for 1982 to 1986 range from 104,792 to 170,863 for centres of 10,000 and over, or an average of 137,827.5; for the period 1987 to 1991, the average is 172,717, or an increase of 34,889.5 dwelling starts.
In 1992 to 1997, the average is 131,673.5; in 2012 to 2014 the historical average is 112,802.5, for centres of 10,000 and over. For Canada, the average for the same period is 124,375 dwelling starts and under construction. The average or mean is taken when two periods are added and the sum is divided by 2. In 1982 to 1986, Canada’s dwelling starts and under construction had an average of 162,822.5, which is above the historical average for 1990-2013, and for 2012 to 2014. This means Canada’s dwelling starts and under construction has declined due to some factors like global economic downturn.
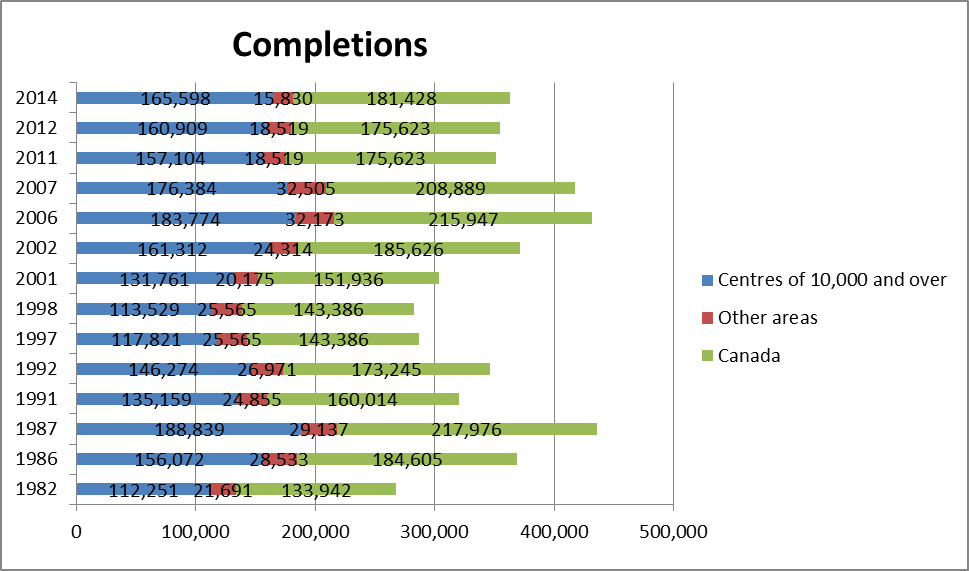
Data for Canada reveals that for 1982 to 1986, the average is 159,273.5; for 1987 to 1991 the average is 188,995; for 1992 to 1997 the average is 158,315.5; for 1998 to 2001 the average is 147,661; for 2002 to 2006 the average is 200,786; for 2007 to 2011 the average is 192,256; for 2012 to 2014 the average is 178,525.5. All these mean that a comparison of the means of the different periods can give us a trend.
As seen from the various averages above, the trend has been fluctuating due perhaps to several factors during those times. The 2008-2009 global economic downturn slightly affected Canada but after that period the economy rebounded and has attained a steady growth after the economic downturn.
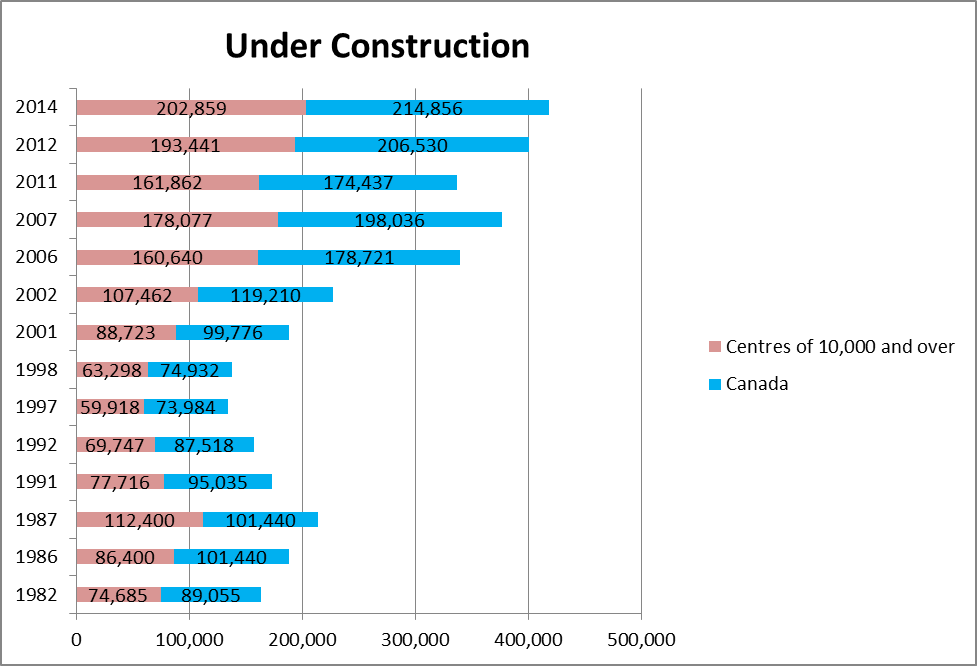
The data available for “under construction” are for Canada and the centres of 10,000 and over population. For Canada, the average or mean for the period 1982 to 1986 is 95,247; for 1987 to 1991 the average is 98,236; for 1992 to 1997 the average is 80,751; for 1998 to 2001 the average is 87,354; for 2002 to 2006 the average is 148,965.5; for 2007 to 2011 the average is 186,236.5; and for 2012 to 2014 the average is 210,693. This means that “under construction” dwellings had fluctuating averages or means for the different periods, but there was increasing trend during 2002-2006 up to 2012-2014 periods.
The data for “centres of 10,000 and over” for the different periods are the following: the average or mean for the period 1982 to 1986 is 80,542.5; for 1987 to 1991 the average is 95,058; for 1992 to 1997 the average is 64,832.5; for 1998 to 2001 the average is 76,010.5; for 2002 to 2006 the average is 134,051; for 2007 to 2011 the average is 169,969.5; and for 2012 to 2014 the average is 198,150. The trend here is the same with Canada’s data, which is fluctuating but a steady growth could also be seen for the last two periods.
Forecast for Atlantic Canada
Housing starts will have relative decline in 2016 and the next year. It will be considered moderate since it is just around 5,850 to 7,800 units this year, and next year (2017) it will be around 5,550 to 8,150 units.
New Brunswick will have growth of.5% this year and will further rise to 1.1% in 2017. Some of the province’s new challenges will include the fragile fiscal stance which makes it a weak contributor to the provincial economy. The country’s currency, the Canadian dollar, though weak at this point will still be able to support manufacturing and export sectors (“CMHC: Housing Market Outlook: Atlantic Region Highlights” 2).
Global demand will have great influence on exports of prime commodity. Other influences include the slow population growth. International migration will overtake interprovince migration, so this will not have a big impact on the economy. New Brunswick will have a declining full-time employment and a moderate growth. This means that there will also be lower demand for housing starts, completion and construction activity.
Economic growth for Prince Edward Island and housing demand will be almost similar with New Brunswick: a growth of.5% for 2016 and 1.1% in the following year. The agriculture sector will have a relative improvement, and a stronger stance for the tourism industry. The Canadian dollar supports the small sectors.
Employment for the province will have a 0.5% growth this year and 0.6% for the coming year (CMHC: Housing Market Outlook: Atlantic Region Highlights” 3).
Nova Scotia will have a higher economic growth of 0.8% this year and 1.6% next year (2017). The shipbuilding industry and the manufacturing sector are expected to grow by 2016 up to 2017. The weak Canadian dollar will benefit the exports sector, but the lower prices in commodity will also impact the commodity exporters (CMHC: Housing Market Outlook: Atlantic Region Highlights” 3). Employment growth will improve housing demand and the investment sector.
By 2016, growth of 0.8% is further seen in the employment sector. In the international migration, there is an expected 1,500 migrants annually but there will be a slower inter-province migration this coming year 2017. A controlled decrease in inter-province migration will improve annual net migration. But there will be improved growth in housing demand, or more housing activity this 2016 and the next year. An aging population will affect demand for single-detached homes; instead demand will shift to rental apartments. Therefore, multiple starts will range from 1,600 to 2,500 units this year and will have a very slight change in 2017 (CMHC: Housing Market Outlook: Atlantic Region Highlights” 3).
For this year until 2017, Newfoundland and Labrador (NL) will have a slow economic activity and lower growth than the rest of Atlantic Canada. But GDP will be more positive at 0.2% this year (2016), and much stronger at 1.4% next year. The province’s employment growth will be around 0.5 for both 2016 and 2017. Net migration will only become steady by 2017. Housing starts and construction activity will have a moderate demand (CMHC: Housing Market Outlook: Atlantic Region Highlights” 3).
Quebec
New home market will have a slow demand for the next few years, but there will be higher demand for condominium construction for 2016. Resale market will have a minor improvement. Vacant rental dwellings also improve this year (“CMHA: Housing Market Outlook Quebec CMA” 1).
Current Trends: Canada
In 2015, housing starts were maintained at 196,565 units in August, which improved since the previous month July, starts only reached 185,642. The increase in August was attributed to a 19.5 percent increase in starts regarded as multi-units in cities (“CMHC: Housing Now Canada” 1).
August housing starts in Canada’s urban centres increased by 12.2 percent; it recorded 216,924 units. The “seasonally adjusted annual rate” (SAAR) of multi-units also increased to 142,927 believed to be a record high since April 2012. Single-detached starts attained an increase of 1.4 percent. Ontario got break by having the largest increase. This was attributed to Toronto’s urban condominium units. British Columbia acquired the worst decline in monthly SAAR (“CMHC: Housing Now Canada” 2).
Completed and unabsorbed housing units were maintained in August of 2015, but an increase was noted later. But the seasonally-adjusted inventory was firmed at 18,100 units, with an upward trend of multiple units equalizing the declined supply of single-detached units. Row units, corresponding to seasonally-adjusted units reached an increase of 1.5 percent at 11,306 units (“CMHC: Housing Now Canada” 2).
Still for the current trend, construction permits increased in July 2015. Data covered from Canadian municipalities revealed that construction permits registered at 234,600. This is considered new dwellings, which is an increase of 10.6 percent from the previous month of June. The single-family dwellings registered 4.8 percent increase. Housing starts gained momentum during the month of July (“CMHC: Housing Now Canada” 2).
Residential building permits recorded increase in value (in terms of dollar), and this was supported by a growth in family value. Investment value for new homes rose by 0.5 percent, compared to last year. This data on investment refers to investment spending by individuals or firms, including government. And increases on investment were noted in the provinces of British Columbia, Nova Scotia and Ontario. There were declines recorded in Quebec and Alberta (“CMHC: Housing Now Canada” 3).
NHPI increased by 1.3 percent and the largest was recorded in Toronto and Oshawa. Largest declines were noted in Victoria and Ottawa. This NHPI increase can be attributed to the house and land factors. MLS sales gathered an increase of 515,580 or a.3 increase from the previous year, 2014. The seasonally-adjusted rate also goes along with this increase.
The MLS HPI had a growth of 6.4 percent; this type of index uses statistical methods in finding changes for quality of homes in the market (“CHMC: Housing Now Canada” 4). Using this method, 8.9 percent increase was recorded for two-storey single family homes. This was followed by single-detached (single storey) with 6.1 percent increase. Greater Vancouver and Toronto attained the largest increases.
Conclusion
Different trends were registered for housing starts, completions, and under construction, but the 1955 to 2013 historical average has been surpassed by the different data for the various time periods. As a whole, Canada’s housing has recorded a steady growth, ignoring economic downturns and financial problems. In 2015 and 2016, increases are even more apparent.
Works Cited
CMHC: Canadian Housing Observer. 2014. Web.
CMHC: Condominium Basics 2016. Web.
CMHC: Housing and Market Information. 2016. Web.
CMHC: Housing Market Outlook: Atlantic Region Highlights. 2015. Web.
CMHC: Housing Market Outlook Quebec CMA. 2014. Web.
CMHC: Housing Now Canada. 2015. Web.