Executive Summary
The competitive global market has compelled firms in the banking industry to introduce new strategies that will help them to remain competitive. These strategies include assessing the profitability of the company to determine its core strengths and weakness. When a firm is profitable, it can pay high dividends, which in turn attract investors. Investors are interested in a firm that can be able to pay constant dividend not only in the short run but also in the long run.
To determine the viability of a company, investors evaluate financial statements, which help them to make sound decisions regarding a particular firm. This paper critically analysis Kasikornbank or KBank, which is listed in the Thailand stock exchange. The firm operates in the service industry; banking and other financial services (Ingkawat, 2009, p. 18).
A critical analysis of the bank noted that it has low profitability ratios that can be attributed to the current financial crisis in Asia. Moreover, the Bank faces stiff competition from its main rival Bank of Bangkok and Siam Commercial Bank. The bank has also reported a significant increase in other expenses due to increased promotion and marketing costs. However, the profitability of the firm raises serious questions able its future sustainability and the ability to pay the dividend. Moreover, the firm is highly volatile which increases the risk that shareholder will not realize their investment in the firm. Therefore, investors should not invest in the shares of this firm due to low profitability and liquidity ratios.
Introduction
The competitive global marketplace today has shifted the way companies approach competition in the marketplace. Competition has increased significantly, which has compelled many companies to do financial analysis to establish their core strength to maximize output. Financial analysis of a company helps to establish the core feature that enables a company to succeed in the market. In this report, we shall critically conduct a financial analysis of Kasikornbank.
Kasikornbank is one of the leading banks in Thailand, which was established in 1945 (Sherman 2006, p. 57). The bank is listed on the stock exchange of Thailand since 1976. The bank changed its name to Kasikornbank or KBank in 2003. It has been listed as the fourth largest bank in Thailand regarding profitability, assets deposits, and market share. It has a market share of an estimated 14.5 per cent. The bank has a total asset of 2.55 trillion baht, which makes it the second-largest in Thailand.
Financial analysis of the bank will help both managers and investors to gain insight into the debt ratio, profitability, and valuation of the company. One of the best strategies that can be applied is ratio analysis. Ratio analysis helps managers to evaluate a company’s financial statement by comparing different figures to establish their relationship. After this ratio is calculated, it is compared with the industry benchmark or standard to establish if the company over or underperformed. It can also be compared with past results of the company and its goals to identify trends, which are relevant in establishing strength and weaknesses (Siregar 2013).
In other terms, financial ratio analysis is imperative since it can yield value feedback, which can establish the strength and weakness of a firm. This will help external stakeholders and especially shareholders to make sound decisions regarding investment in a given company. In this report, we shall analyze the financial, market and profitability of KBank to give a well throughout conclusion that will help investors to make sound investment regarding the company.
A snapshot of KBank
KBank is a public limited company list in Thailand stock exchange. The company is in the service industry; banking service. It was established on June 8, 1945, with only 21 employees and 5 million baht shares. Since the formation of the bank, it has been able to increase its market share significantly to become the fourth largest bank in Thailand. Over the last 70 years, the bank has been in operations, and it has developed its market share slow to become of the giant banks in Thailand.
It offers excellent services with high service delivery to match its slogan. In 2005, the bank had a registered capital of 30.5 million baht and a total asset of 2.5 million baht. According to Bangkok Bank Public Company Limited (2015), the bank also has four overseas branches including Los Angeles, Cayman Islands, Shenzhen and Chengdu, and Hong Kong branch. The company has been performing well in the last five years.
For instance, in 2014, the bank maintained a net profit growth both quarterly and annually. The increased profit in the first quarter of 2014 was attributed to rising income of core business including those of non-interest income. Moreover, the bank net increase in income of the year was attributed to the net increase in interest margin due to effective funding and effective cost management. The company also reports an increase in net profit in 2015, which is in line with the higher ratio of loans and deposits since the bank, has registered an increase in customer loans. However, in 2015, deposits fell slightly due to the launch of deposit campaigns.
This is evident in the whole market of the commercial bank, which experienced a modest drop of 0.57 per cent in customers deposits compared to the same period the previous year. The increase in net profit in 2014 and 2015 can be attributed to non-interest income due to the increased net fee income. However, the non-performing loans increased by 1.2 per cent from the previous year. However, the company reported a slight decrease in net profit in 2015 due to the economic meltdown in Asia.
The main competitors of KBank include Bangkok Bank and Siam Commercial Bank. However, although the company faces stiff competition from other banks, it has been able to maintain a high-profit margin. Moreover, the efficiency ratios of the company have improved significantly in the last four years.
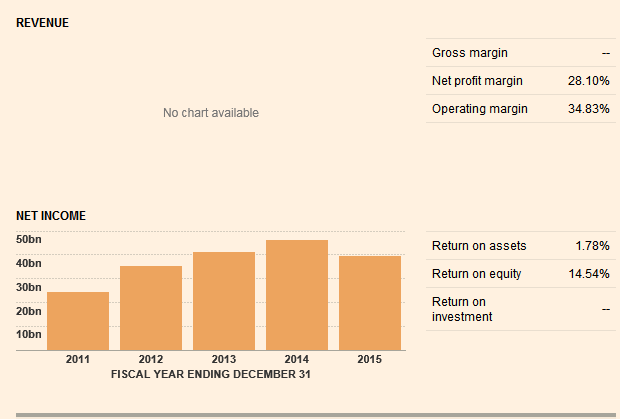
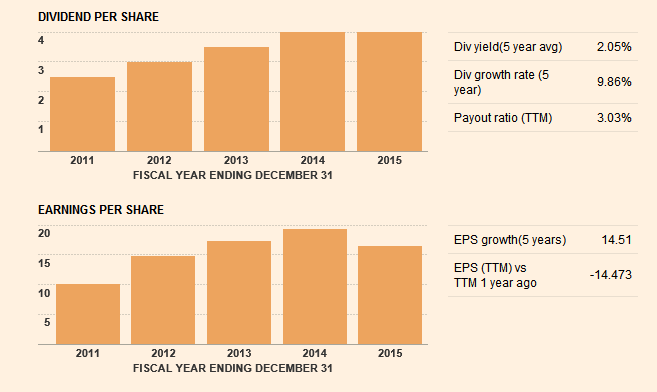
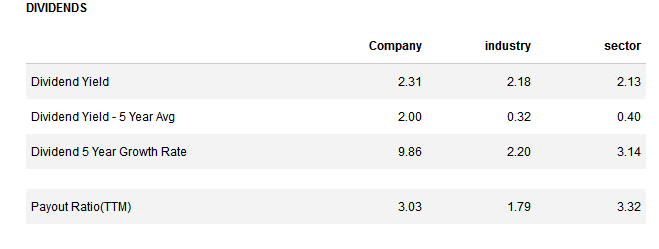
The dividend per share has increased significantly over the last five year. The average dividend in the last five years was 2.05 per cent, which represents a high dividend yield. However, the bank reported a decline in earnings per share in 2015, which was attributed to the financial crisis in Asia. Although the bank’s earnings per share decreased in 2015, it has maintained increasing earnings per share in the last five years, which is consistent with the wealth creation goal of shareholders. KBank has a higher dividend yield compared to the industry average and the sector (Reuters 2016). The bank has a dividend yield of 2.31 per cent, which is slightly higher than the industrial average of 2.18 per cent. Moreover, the company has reported a higher average dividend yield of 2, which is higher than the industrial average of 0.32. Moreover, the 5-year average growth rate shows the company has a high prospect of future growth. Investors are interested in a company that has high growth prospect, which will assure them that the company will continue to pay dividends at least shortly. This shows that investors should invest in the company because of its pays a constant dividend. However, it is paramount to carry out other internal and external analysis to establish the viability of the company. For instance, shareholders/investors who intend to invest in the bank could carry out ratio analysis to establish if the firm is highly geared or not. Moreover, it would be critical to establishing the liquidity of the firm before investing. A company might be paying high dividends, but is highly geared which increases the risk that it might fail to meet its obligation. Thus, investors must use different tools to evaluate the viability of the bank and its shares in the long run. However, we can argue that the bank has a high prospect of future growth, which is also reflected in its dividend payout ratios below.
Summary of financial statements
The financial statements show that the bank has reported an increased profit in the last three years. This can be obtained in the excel sheet (provided as an attachment).
Operating performance and financial position
The bank reported an operating profit of baht 11, 732 it consolidated financial statements which represented a fall compared to the previous year by 1.73 per cent due to increased operating expenses by 14.3 per cent. The increased operating expense was due to high seasonal personal marketing expenses and market promotion in 2014 and 2015. The non-interest declined by 0.64 per cent due to the gain in trading and foreign exchange transactions.
Due to the increase in selling an investment in 2014, the bank saw its efficiency ratio rise by 44.3 per cent, which was higher than the previous quarter of 2013. The bank also reported an increase in the net margin by 3.75 per cent, which was also slightly higher than the market target compared to the previous year. This was due to the ability of the bank to lower its cost of funds as deposits and higher interest rates that favoured a higher profit margin.
The net profit in 2013 increased by 6.85 per cent compared to the same quarter in 2013 due to increased net profit incomes and loan growth in 2013. The loan growth in 2014 also facilitated the increase in noninterest income (fees and premiums) which led to a rise in efficiency ratio. The efficiency ratio increased to 44.3 in 2014, which was higher than in the previous period. Moreover, the efficiency ratio was more than the market expectation.
The consolidated net interest income in 2014 increased by 5.5 per cent compared to 2013 from 1,086 to 20, 580 million respectively. However, the quarterly interest income in 2014 declined due to a slight decrease in interest expense from deposits. Moreover, this was attributed to a decrease in interest deposits and expiration of special deposits on average interest rates. However, the interest income from external investments and loans increased significantly due to the rise in the average loan volume. Although the bank saw its money market interest rates decline, it did not affect the overall increase in interest rates in the second quarter of 2014.
Thus, the interest income increased by 3.75 per cent compared to the same period in 2013, which was higher than the analyst target and market expectation. The second quarter of 2014 also reported an increase in net interest income by 14.7 per cent, which was mainly attributed to high-interest income from loans, and an increase in loan volumes. Moreover, the bank also saw its interest from external investment increase significantly. In the third quarter of 2014, the bank reported a decline in interest expense from deposits. In summary, the bank reported an increase in interest income in 2014 compared to 2013, which was mainly due to high-interest rates from bank loans.
The consolidated non-interest income in the financial statements decreased by 0.64 in the second quarter of 2014 compared to the same period in 2013. This decrease was attributed to the high cost of foreign exchange due to losses on foreign investment income. However, overall, the non-interest income increased by 7.3 per cent, which was mainly attributed to owing net fees and net premium, earned.
The bank also reported an increase in consolidated fee by 5.4 per cent mainly due to the rise in loan fees and mutual management fund as well as securities brokerage fees. The service income also increased by 12.42 per cent in 2014 compared to the same period in 2013, which was attributed to high net fees from card business and effective management of loan-related businesses. In summary, the increase in consolidated non-interest income was attributed to the application of customer Centricity strategy, which has supported continuous growth in market share.
Other operating expenses in the statement of financial position increased significantly by 14.3 per cent to 15,137 million baht. This was consistent with the normal spending behaviour of the bank in the promotion and marketing activities. Due to the rising personal expense in 2014, the bank reported an increase in operating expense in the last quarter of 15.98 per cent. Consequently, the efficiency ratio declined to 44.33 per cent. In other words, the bank reported an increase in operating expenses in 2014 compared to the same period in 2013.
The consolidated impairment loss on loans decreased by 17 per cent in 2014 compared to 2013. This was a significant decrease in impairment losses in the subsidiaries as a result of effective management of assets.
Financial position analysis
The bank reported an increase in the net asset in 2014 compared to the same period in 2013 by 1.33 per cent. The increase in a net asset can be attributed to increases in loans and investment. However, the bank reported a decrease in interbank assets. The net asset (investment) in 2014 amounted to 531, 315 baht that was an increase of 3.79 per cent compared to the previous year. The increase in investment in government bonds also increases in the last quarter of 2014. The figure below takes a snapshot of the KBank’s asset and liabilities in 20133 and 2014.
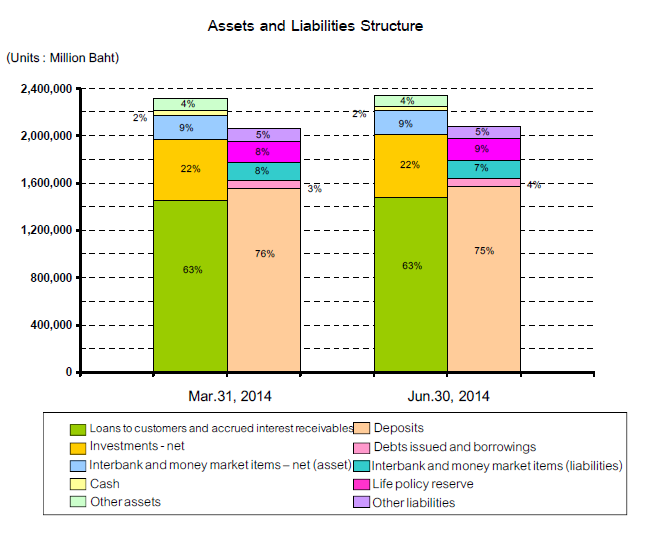
In the consolidated financial statements, net investments increased by 1.49 per cent when compared with the figures reported in 2013. This can be attributed to the increase in home loans, trade finances, and credit card loans. The consolidated financial loans were the fourth largest among other commercial banks in Thailand. However, the net investment on consolidation at the end of 2014 was equal to that reported in 2013. The total loan decreased slightly by 0.94 per cent compared to 2013. The consolidated loans less deferred revenues were 1,471, 922 million in the last quarter of 2014. This represents a 1.49 per cent increase compared to the previous period. In summary, the consolidated investment income increased in 2014 compared to 2013, which represent good news for investors who intend to invest in the bank.
Financial Ratio
Financial ratio analysis is an evaluation tool used by managers and investors to assess the viability of a company by comparing figure from financial statements to establish the relationship. This analysis helps investors to establish the liquidity, gearing, efficiency, and profitability of the company. To help investors analyze the viability of the company, we shall analyze liquidity ratio, gearing/ debt ratio and profitability ratios (Damjibhai 2016). Moreover, we shall critically carry out a valuation analysis to assess the value of the bank when compared with other banks in the same industry.
Liquidity Ratios
Liquidity ratios measure the ability of a company to convert its most liquidity asset to cash easily. The liquidity ratios are used by investors to assess the ability of the company to pay off its current liability when they become due. In simpler terms, the ratios measure the ability of a company to meet its obligations when they fall due. It also measures how much money there is in the company to meet its obligations. These ratios include acid test ratios, cash ratio, quick ratios working capital, and networking capital ratios. In this analysis, we shall focus on the acid test ratio, cash ratio, and quick ratio.
Quick ratio.
The quick ratio of KBank shows that the company does not have any cash to meet its current liabilities in the company. It has a quick ratio of zero, which is even below the industrial average. This is an indication that the company cannot be able to meet its current liability as and when they fall due. When calculating this ratio we do not include inventory because it cannot be converted to cash easily. As a rule, the higher the ratio the better the performance. A ratio greater than one is preferred because it shows that a company can be able to meet its short-term obligation as and when they fall due.
The low quick ratio shows the bank is over-leveraged and is struggling to pay its obligation. The low quick ratio indicates the firm is very risky for investors to buy stocks (Yu-Lu & Yensen 2014, p. 249). In other words, investors should not buy stocks of KBank because it is likely to fail to meet its obligations when they fall due. This can lead to the liquidation of the company that can potentially lead to a loss of investment.
Usually, secured creditors are paid first in a liquidation suit before a shareholder. If nothing is left, a company is not obligated to pay ordinary shareholders. Thus, investors should be very careful when investing in KBank. They must consider other factors that have a direct impact on the firm’s future profitability. From the balance sheet statements, the liquidity of KBank is approximate $38.042, which is very low compared to the industrial average. This ratio is not effective since a bank does not have current assets and current liabilities. However, we can analyze the performance of the bank by assessing its overall liquidity ratio of $38.042, which is below the industrial average and is considered to be very low. The bank is rated below average when compared with its main competitor Bangkok bank and Siam commercial bank.
Debt Analysis
This ratio indicates the extent to which a company has been financed by borrowed money to finance the assets (Andrijasevic & Pasic 2014, p. 118). This ratio is computed to assess the financial risk of the bank and its probability of going into receivership as a result of the failure to pay its obligation (interest and principal).
Debt to equity ratio shows the amount of debt capital for every baht of equity. The bank reported a debt to equity ratio of greater than 0.5 shows that the firm is highly geared and risky. Therefore, we can strongly argue that KBank has a strong debt to equity ratio, which is an indication debt capital slightly finances the bank. Thus, the financial risk of the bank going into liquidation is very low. Investors can, therefore, invest in the Bank shares without fear that it might go into liquidation.
In summary, KBank has a strong debt ratio, which is an indication the bank is not highly geared. In other terms, it means the bank does not rely heavily on fix return sources of capital. However, KBank is highly volatile. The volatility of the company is measured based on how assets sing up and down. KBank has market volatility of 12.7 per cent and annual volatility of 26.3 per cent. Thus, we can string conclude that although the bank has a strong debt to equity ratio, it experiences an extremely volatile market. This means the risk associated with volatility in the market can outweigh the strong debt to equity ratio. Therefore, investors should avoid investing in the shares of the bank. The risk associated with the market volatility will potentially lead to huge losses since the shares are more likely to lose their value.
Profitability ratios
This ratio is one of the most variable ratios in ratio analysis. Faello (2015) argue that it indicates the ability of a company to generate returns from investment and with sales (p. 82).
Return on asset ratio.
This is a profitability ratio that shows how effective the bank is using its assets to generate profits. In 2014, the bank was more effective in managing its assets to generate returns. The higher the ratio the better the performance. However, it is imperative to note that the fluctuation of firms earning can have a significant effect on the ratio. Therefore, investors should evaluate this ratio from a long-term perspective. The return on the asset can be affected by issuance, buyback, and goodwill of a company and its interest payment. Moreover, the ratio does not reflect the true earning of the assets of a firm. In summary, KBank has a high return on an asset which is an indication the bank is utilizing its assets effective to generate future returns.
Return on average assets.
The average return on equity shows how a firm uses its equity finance to generate income. The ratio shows that there was a slight decline in the return on average equity, which is an indication that shareholders return declined in 2014.
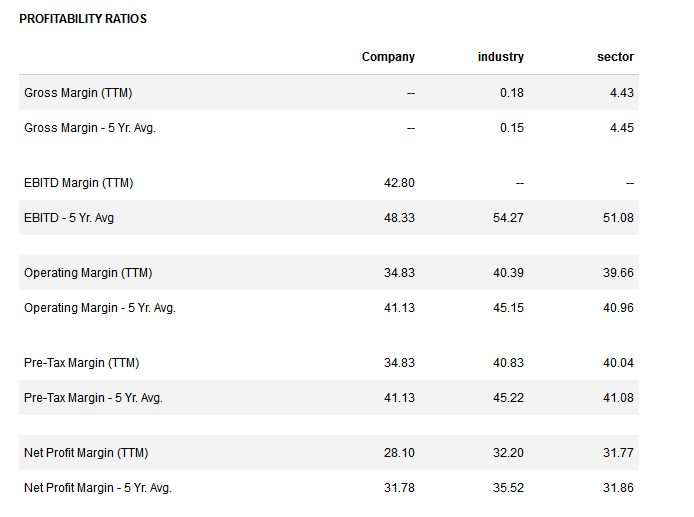
From the ratios above, the average earnings before interest and tax in the last five years shows, that the bank has underperformed compared to the industrial average and sector average. This shows the bank profit before tax declined in 2014. Moreover, the decline is significant to investors who want to invest in a company that is generating adequate profits that can be distributed as dividends. Since the bank is performing below the industrial average shows investors should not invest on the bank.
The operating margin is below the industrial average. This is an indication the bank is not making adequate profits. The ratio has a significant difference when compared with the sectors average by 4.833 (39.66-34.83=4.833). The bank also seems to underperform in net profit margin when compared to both the industrial and sector average. This also shows the company is reporting below-average profits, which is a signal to investors that they should not invest in the stock of the bank.
The industrial average of 32.2 is above the net profit margin of KBank of 28.1. The same trend is also reported in the average net profit margin of over the last five years that is 31.78 below the industrial average of 35.52. Therefore, we can conclude that the bank has underperformed compared to both the industrial and sectors averaged in 2014. This is a powerful signal to investors that they should not invest in the bank since their investments will not pay off compared to investing in another competitor in the same industry.
For instance, Siam commercial bank has a high profitability ratio compared to the industry and sector average; investors should consider competitor firms such as Siam Commercial banks and Bangkok Bank, which are more profitable, compared to the industrial average. Moreover, KBank has a high-risk score that shows the firm should be avoided by any investor who wants to enjoy future returns from his or her investment. KBank is estimated to have a right score of 9/10 which is considered to be highly risky. In summary, KBank has a low-profit margin, which exposes investors to high risk compared to other firms in the same industry. KBank has underperformed in its ability to generate and maintain profits compared to the industry and sector average.
Valuation ratios
Valuation ratios are used to measure the value of a firm, which is essential for shareholders (Krivka & Stonkutė 2015, p. 123). These ratios include the price-earnings ratio, price per book value, dividend yield, and price per cash flow.
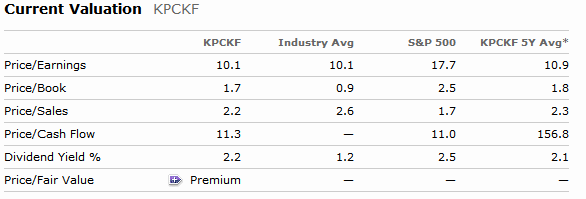
From the ratios above, KBank has a modest price-earnings ratio, which is equal to the industrial average. However, the company has performed below average on its average price-earnings ratio in the past five years. The bank has a 10.9 average price per earnings ratio below 17.7 industrial averages. The price to book ratio shows the bank has outperformed the industrial average by 0.8. However, the average price per book value is below the S&P 500 average of 2.5. This shows that the firm is overvalued. Therefore, investors should not invest in the stock of the firm. Overvalued firms are associated with other external risks such as weak liquidity ratios, high volatile businesses and
The dividend yield is above the industry average at 2.2. This shows that the bank has a high return on the dividend at the current market price. Therefore, an investor can be able to obtain high returns for their investment in the company. However, the risk associated with the firm outweighs the advantage for any investor to consider the bank viable in the long run. In the short run, the bank will pay high dividends, which will later decline significantly. KBank has been reporting a decreasing net return before interest and tax, which is an indication the bank, has other external risks.
Conclusion and recommendation
Kasikornbank Public Co Ltd is a public limited company listed in Bangkok stock exchange. The bank reported an increase in net profit in 2015, which is in line with a higher ratio of loans and deposits since the bank, has registered an increase in customer loans. The bank is operating in a highly volatile market, which exposes investors to both internal and external risks affecting the bank. The bank has a higher dividend yield compared to the industry average which indicates the company pays higher dividends per share. The dividend per share has increased significantly over the last five year.
The average dividend in the last five years was 2.05 per cent, which represents a high dividend yield. In fact, in 2014, KBank the company paid a high dividend compared to 2013. However, net income reduced by a sign which can be attributed to the loss of market share and the economic crisis in Asia. The bank is facing low profitability ratios and liquidity challenges, which raises the risk associated with the firm.
It is recommended that the bank should evaluate the noninterest income, which can be a major bolster in real income. Today, due to the nature of competition in the market, banks are concentrating on income from non-interest income. This can be achieved if the firm will be able to control operating expenses. Specifically, the bank should introduce new strategies that will enable the bank to reduce other operating expenses. In 2014, the bank reported an increase in operating expense by 14.3 per cent which is a significant change considering that sales have been declining.
The bank can be able to improve sales even if the level of competition is stiff by reducing other expenses, which is as a result of increased marketing and promotion activities. For instance, the bank can reduce personal expenses, which has significantly increased the operating expenses in 2014. High operating expenses have a direct impact on the efficiency ratios of the firm, which declined to 44.3 in 2014. Therefore, if managers can be able to improve the efficiency of the firm, efficiency ratios will increase which will have a positive impact on the profitability of the firm. Managers should also introduce new products in the market that will help the bank to increase sales and future profitability.
References
Andrijasevic, M, & Pasic, V 2014, ‘A blueprint of ratio analysis as information basis of corporation financial management’, Problems of Management in the 21st Century, vol. 9, no. 2, pp. 117-123. Web.
Bangkok Bank Public Company Limited, 2015, Bangkok Bank Public Company Limited MarketLine Company Profile, pp. 1-27. Web.
Damjibhai, SD 2016, ‘Performance Measurement Through Ratio Analysis: The Case of Indian Hotel Company Ltd’, IUP Journal of Management Research, vol. 15, no. 1, pp. 30-36. Web.
Faello, J 2015, ‘Understanding the limitations of financial ratios’, Academy of Accounting & Financial Studies Journal, vol. 19, no. 3, pp. 75-85. Web.
Ingkawat, K 2009, ‘Thailand’s KBank credit card ads are funny and likeable’, Media: Asia’s Media & Marketing Newspaper, p. 18. Web.
Krivka, A, & Stonkutė, E 2015, ‘Complex analysis of financial state and performance of construction enterprises’, Business, Management & Education / Verslas, Vadyba ir Studijos, vol. 13, no. 2, pp. 220-233. Web.
Reuters, 2016. Kasikornbank PCL (KBANK.BK).
Sherman, P 2006, ‘Thailand’s KASIKORNBANK’, RMA Journal, vol. 89, no. 1, pp. 54-60. Web.
Siregar, RY 2013, ‘Living with interconnected banking sectors during the period of global financial market uncertainties: experiences of east and southeast Asia’, Journal of Advanced Studies in Finance (De Gruyter Open), vol. 4, no. 1, pp. 32-61. Web.
Yu-Lu, L, & Yensen, N 2014, ‘Evaluating overseas convertible bonds from financial statements using five forces analysis’, International Journal of Electronic Business Management, vol. 12, no. 4, pp. 247-255. Web.