Introduction
Strategic planning is a crucial process that allows companies to plan their business according to their capabilities and resources. The process involves careful consideration of market factors and conditions that could affect the company’s decision in the future. The changing spectrum of competition requires companies to monitor the outcome of their strategies on a regular basis and make changes when required to maintain their business position.
The estimation of product demand is made by including different variables such as price, volume, and cost of products manufactured by the company in the analysis. The simulation allows strategic decisions to be made for Clipboard Tablet Company, which manufacturers three different models of tablets including X5, X6, and X7. Each model has its price, cost, and allocation of R&D expenditure.
There are specific decisions that the company needs to make related to these products to maximize their sales and profit. The basic decisions that are permitted in the simulation include those related to price, allocation of R&D expenditure, and continuation of the model. It could be stated that the company needs to make the decisions affecting both financial and market position of products.
Current Position
The current market report indicated that X5 was the most selling model that had no performance issues, and it had been on the market for three years with market saturation of 15%. X6 had been on the market for two years, and it had performance issues. The third model, X7 is the latest product launched by the company as it had been on the market for just one year. X7 is a new model and customers do have concerns regarding its price and performance. The company has to make strategic decisions for the next four years to ensure that these products remain profitable, and the business can maximize its sales and earnings.
Joe Thomas’s Decision
Table 1: Joe Thomas’s Decisions.
The table provided above summarizes results of simulation if no changes were made to the decisions of Joe Thomas.
Strategic Decisions
The strategic decisions are long-term in nature. However, their outcome can be observed in the short term, and the company needs to be vigilant and responsive to the changes taking place in the business environment. The objective of strategic decision-making is to avoid losses and achieve higher sales (Parry, 2004). The following information summarizes and discusses all decisions that were taken during the period from 2012 to 2015.
These decisions are made after review of the market summary and information related to each model. Specifically, the decisions were made by altering price and allocation of R&D expenditure. No decision was made to discontinue any product. These decisions were made based on the current scenario faced by the company that is already discussed in the previous section. The details of strategic decisions and their outcome are discussed in the following.
Table 2: 2012 Decisions.
Based on the market and product situation in 2011, the price of X5 was not changed as this product had no performance issues and the company had the opportunity to increase its sales and generate higher revenues. It could be indicated that X5 remained favorable by customers. Furthermore, the allocation of R&D expenditure was reduced from 33% to 15% as it had no performance issues and it was not feasible to spend more on its improvement.
On the other hand, the price of the two models including X6 and X7 was reduced in 2012, and a higher proportion of R&D expenditure was allocated to these models. It was observed that customers expected improvements in X6 and X7, and it was necessary to adjust R&D expenditure for these models. Keeping in view these decisions, it could be noted that X6 outperformed other two models as its sales increased by 128.97%. It is suggested that the company should achieve a higher return by increasing the price of X5. Furthermore, the price of X6 should be lowered and its technology must be improved.
Table 3: 2013 Decisions.
The decision taken in 2013 generated positive outcomes for the company. The cumulative score increased by more than 129%. In this period, the focus was on improving X6 and X7 by allocating a greater proportion of R&D expenditure to these models. It could be noted that no R&D expenditure was allocated to X5. X5 had no performance issues, and the market summary indicated that this model was underpriced than other products in the market. Moreover, the results showed that X7 had entered its growth stage, and it would be appropriate to increase its price to achieve a higher profit. Moreover, it was noted that customers accepted X6 for its performance. Therefore, the company does not need to change R&D expenditure on this model in the next year.
Table 4: 2014 Decisions.
The table provided above provides a summary of the decisions taken by the company in 2014. X5 was underpriced in 2013, and it was necessary for the company to increase its price. Also, it did not increase its allocation of R&D expenditure. On the other hand, X6 was in its growth stage. Therefore, the company not to increase its price or R&D expenditure so that it could achieve repeated sales.
From the market summary, it was also noted that X7 was underpriced than other products in the market, and the company needed to increase its price and at the same time improve its technology. However, the financial results indicated that these decisions did not prove to be favorable. The sales of all models declined in 2014. It could be argued that if the company is not able to predict the impact of different factors and market conditions accurately, then it could lead to major problems for the business.
Moreover, it is important for the company to determine the cost of each product and set its price to achieve high-profit margin. Instead of making higher sales, Clipboard faced declining sales, and it was important for the company to allocate its resources appropriately in the next year. The customer demand for X5 decreased in 2014, and its technology was not highly accepted by customers. Therefore, it was decided to lower its price to give a higher value for money to customers. Moreover, X7 was still underpriced than other products in the market. Therefore, it was decided to increase its price to achieve higher revenues.
Table 5: 2015 Decisions.
In 2015, the company made adjustments to the three variables included in strategic planning. The price of X5 was reduced to attract customers and boost its sales. The strategy worked out well, and it could be indicated that sales of X5 increased by 387%. Another strategic choice related to X5 that the company could have made was to discontinue this model. However, it was not considered because the management had the idea that the company could still induce sales by lowering its price and making it more attractive to customers.
There was no change in the price of X6, and R&D expenditure did not also change. Also, the market summary indicated that X6 had reached its maturity stage. It must be understood that products in maturity stage require aggressive strategies to avoid the declining stage (Simerson, 2011). Although the company was able to achieve a net profit margin of 19%, sales of X6 deteriorated. It became necessary for the company to rethink its strategy by either lowering its price or increasing R&D expenditure to improve its technology in the next year. The company increased the price of X7 as it was considered underpriced than other products.
However, this strategy did not prove successful as it could be indicated that the company failed to achieve net profit from its sales in all four years. It also suggested that the company’s management failed to estimate its costs and incorporate them into its decisions. The cumulative score achieved by the company after the completion of four years was 1,169,420,620 that was lower than the score achieved if Joe Thomas’s remained unchanged.
Results Summary
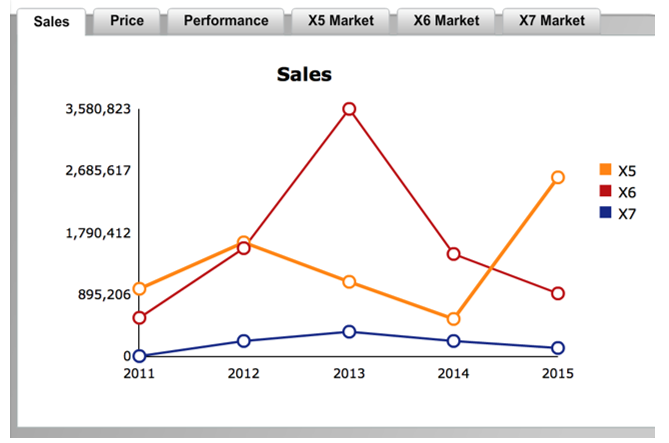
The following table summarizes the results achieved by the company.
Table 6: Overall Sales.
Discussion
From the simulation, various elements of strategic planning could be identified. These elements include planning, implementation, review, and revision of strategies (Olsen, 2011). The planning phase is the most crucial one. If the company does not take into account all factors that could affect its decisions and business, then it is most likely that the company will face problems. The planning stage requires careful and in-depth analysis of customer needs and market conditions.
After planning stage is completed, the company carries out different steps in the implementation stage to achieve its targets set out in the planning stage. The review stage requires the company to evaluate the impact of its decisions on the business outcomes. If there is a gap in actual and expected results, then the company must redevise its strategies (Steiner, 2008). It could be concluded that strategic planning is a continuous process, and it is difficult for companies to manage their resources in the entire process.
References
Olsen, E. (2011). Strategic Planning For Dummies. Hoboken, New Jersey: John Wiley & Sons.
Parry, M. (2004). Strategic Marketing Management. New York: McGraw-Hill Professional.
Simerson, B. K. (2011). Strategic Planning: A Practical Guide to Strategy Formulation and Execution. Santa Barbara, California: ABC-CLIO.
Steiner, G. A. (2008). Strategic Planning. New York, NY: Simon and Schuster.