Introduction
The changing spectrum of competition requires companies to monitor the outcome of their strategies on a regular basis. They also need to make changes when required to maintain their business position. Many variables are involved in estimating the product’s success. Clipboard Tablet Company has been in existence for many years. It has managed to develop three of its products that have shaped its future perspective.
It manufactures three different models of tablets, which include X5, X6, and X7. Each of the three types has its price, cost, and allocation of the Research and Development expenditure budget. For the company to continue earning from these products, it has to make accurate decisions. Clipboard Tablet Company’s simulation decisions involve the price, allocation of R&D expenditure, and the decision to maintain the model or remove it from the market. The study will deal with the three products and how to make them continue in the market. The decisions will involve financial capability and market positioning.
Current Position
The three products have become core to the strategic positioning of the company products. X5 model has been in the market for a long time and has provided income for the enterprise to support other products. It had been on the market for about three years. It had a market saturation of 15%. X6 had been on the market for about two years. Its performance was average (Mooradian, Matzler, & Ring, 2012). The X7 model is the latest product that the company has launched. It has been on the market for about a year. Customers still have concerns regarding its price and performance. The company’s decisions affect the products so much because if the company fails to sell them, it cannot make money.
My Decision
Table 1: Decisions.
Joe Thomas’s decisions led to a cumulative score of 1, 359, 053,621. It was 40, 014,399 ahead of my score. During the first year, there was no need to change the prices and the cost of Research and Development. In 2013 I reduced the cost for R & D on model X5 and increased model X7’s price because it was in its developmental stage (Mooradian et al., 2012). R & D in 2014 increased for X6 model in Joe’s case. Both X5 and X7 remained had the same expenditure budget in my plan, while X6 was 34%. For Joe, in 2015, X7 model had the highest spending while X5 had the lowest budget. My budget for X6 and X7 was 40% for each and 20% for X5 in 2015.
Strategic Decisions
During the period from 2012 to 2015, some crucial decisions needed to provide the pathway for Clipboard Tablet Company. Below is a summary of those decisions. They were specifically related to price alteration and allocation of R&D expenditure. There was no need to discontinue any product. The critical thing was that the decisions relied on the prevailing circumstances at the time when the previous year’s results closed. The details of strategic decisions and their outcome are as follows;
Table 2: 2012 Decisions.
Based on the market and product situation in 2011, there was no need to change the price of X5 not changed. It was performing well, and the company obtained increased sales and generated higher revenues. The customer preference for the product was still high. R & D allocation expenditure remained at 33% because any change could affect its sales volume. It had no performance issues, and it was not practical to spend more money on its improvement. The prices of the two other models X6 and X7, also remained constant until the year 2012.
The cost of Research and Development also remained constant for the two products as the management monitored their performance (Pasmore, Woodman, & Shani, 2010). Customers preferred product X5 more than the other two products. Perhaps they expected improvements in X6 and X7, and it was necessary to adjust R&D expenditure for these models. X5 performed better than the other products. It had increased sales.
But the company can achieve a higher return by maintaining or slightly increasing the price of X5. Furthermore, the price of X6 should be lowered, and its technology must be improved. Customers are paying more for X6 than for other products in the same category. It is also in its growth phase of the product lifecycle. The majority of potential X6 customers have not yet purchased it.
Table 3: 2013 Decisions.
In 2013 the decision to reduce X6 price was achieved. The R & D expense for tablet X5 and tablet X7 increased. The decision taken in 2013 generated positive outcomes for the company. The cumulative score increased by more than 200%. The 2013 financial year concentrated on the tablet X7 by allocating a greater proportion of R&D expenditure to the model. The expenditure on X5 went down.
It is not because the company did not need it, but that it had achieved its maturity and was about to start declining in sales. X7 was also priced higher than competing products and needed drastic action to manage its price. It was in its growth stage. There were many potential buyers of X7. X6 was performing better than other competing tablets. Moreover, it was noted that customers accepted X6 for its performance. Therefore, the company may only think of improving or maintaining the R&D expenditure on this model in the next year.
Table 4: 2014 Decisions.
The table provided above provides a summary of the decisions taken by the company in 2014. X5 had started showing signs of decline in 2013, and it was necessary for the company to maintain its price. Also, it did not increase its allocation of R&D expenditure. On the other hand, X6 was in its growth stage (Leleur, 2012). Therefore, the company maintained its price and R&D expenditure so that it could achieve repeated sales.
From the market summary, all the products had almost the same price as other competing products from the competition. However, the financial results indicated that these decisions did not prove to be favorable. The sales of all models declined in 2014 except for X7. The decisions made were only favorable to X7 and not for the other products. It could have been wise to develop product X but not at the expense of other products that had been in existence longer than X7. At the same time, product X7 was in its growth stage and, if well managed, could become the company’s primary product.
Instead of making higher sales, Clipboard faced declining sales, and it was important for the company to allocate its resources appropriately in the next year. The customer demand for X5 decreased in 2014, and customers did not accept its technology (Simerson, 2011). It was also time to remove product X5 from the production department and only concentrate on repairs and replacements. Therefore, it was decided to lower its price to give a higher value for money to customers. Moreover, X7 was still selling at a considerably fair price.
Table 5: 2015 Decisions.
In 2015, the company made adjustments to the three variables included in strategic planning. The price of X5 was reduced to attract customers and boost its sales as it achieved its maturity stage. The strategy still did not work out well, and the sales of X5 continued going down. Another strategic choice related to X5 that the company could have made was to discontinue this model. However, the management had the idea that the firm could still achieve sales by lowering its price and making it more attractive to customers. R & D expenditure for X5 went down to save on costs. The price of X6 went up, and R&D expenditure did not also change. X6 could still achieve growth if a better decision on pricing were available.
Products in such a condition require aggressive strategies to avoid the continued declining stage (Simerson, 2011). Although the company was able to achieve a net profit margin of 17%, it was a drop from the previous 27%. Sales of X6 and X5 deteriorated. It became necessary for the company to rethink its strategy by either lowering its price or increasing R&D expenditure to improve its technology in the next year.
The company maintained the price of X7 as it was continuing on its growth stage. The strategy worked well for this particular product, but now there is a need to lower the price again. The company’s management failed to estimate its costs and incorporate them into its decisions. The cumulative score achieved by the firm after the completion of four years was 1,359,053,621. It was lower than the score achieved by Joe Thomas. There were a few errors of judgment that made the company lose profits and sales. The market and competition are volatile and require stringent rules that have gone through extensive study.
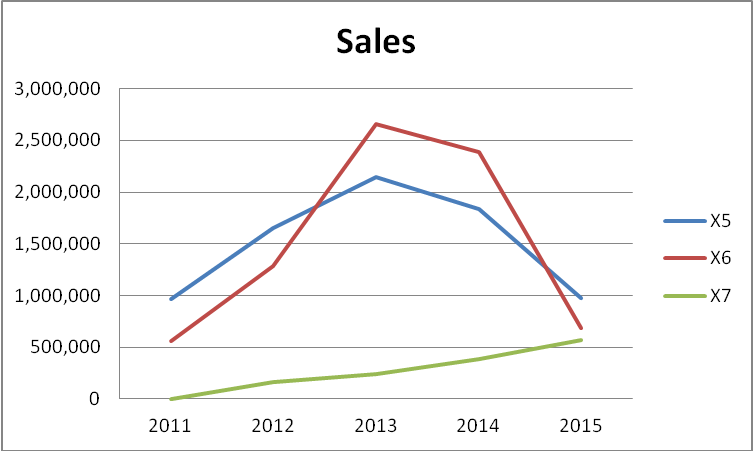
Results Summary
Table 6: Sales Summary.
Discussion
The simulation encouraged lessons that are essential to the success of the enterprise. For planning to be successful, an implementation must be progressive. The management needs to keep reviewing and revision its strategies from time to time (Leleur, 2012). It leads to the immense success of the organizational strategy. But the company must invest so much in policy formulation and accomplishment. It is the place that Research and Development take center stage.
Joe Thomas performed better and was able to achieve growth in most of the sectors. My pricing strategy was weak, and it made my work difficult as the company’s sales and profits dropped drastically. In the fifth year, I should have stopped any investment in the R D for Model X5. It has been an excellent study.
References
Leleur, S. (2012). Complex strategic choices. London, UK: Springer.
Mooradian, T., Matzler, K., & Ring, L. (2012). Strategic marketing. Boston, MA: Pearson Prentice Hall.
Pasmore, W., Woodman, R., & Shani, A. (2010). Research in organizational change and development. Bingley, UK: Emerald.
Simerson, B. (2011). Strategic planning. Santa Barbara, California: Praeger.