Introduction
ICICI Bank is one of the major banks in India. According to the bank’s financial reports of the financial year 2013, its assets are worth the US $ 99 billion. The bank has are not less than “3588 branches and 11,162 ATMs in India” (ICICI 2013, p. 1). “ICICI Bank was originally promoted in 1994 by ICICI Limited, an Indian financial institution, and was its wholly-owned subsidiary” (NDTV 2014, p. 1).
In addition to India, ICICI Bank operates in 18 other countries worldwide (Microcapital 2013). The bank has a variety of financial products and services. Such products include, “commercial banking, retail banking, project, and corporate finance, working capital finance, insurance, venture capital, and private equity, investment banking, broking, and treasury products and services” (Reuters 2013a, p. 1). In an endeavor to serve it, valuable customers, the bank uses various channels and, “its specialised subsidiaries in the area of investment banking, life and non-life insurance, venture capital and asset management” (ICICI 2013, p. 1).
ICICI bank has associates in countries such as, “United Kingdom, Russia and Canada” (ICICI 2013, p. 1). The bank’s associate in the United Kingdom has opened local offices in two European countries namely, Belgium and Germany (Reuters 2013b). The bank has its “branches in United States, Singapore, Bahrain, Hong Kong, Sri Lanka, Qatar and Dubai International Finance Centre” (ICICI 2013, p. 1). In addition to the associate and branch offices, the bank also has, “representative offices in United Arab Emirates, China, South Africa, Bangladesh, Thailand, Malaysia and Indonesia” (ICICI 2013, p. 1).
ICICI Bank is listed on Mumbai Stock Exchange. The National Stock Exchange of India Limited (NSE) also has the bank’s listing. In addition, the bank’s “American Depositary Receipts (ADRs) are listed on the New York Stock Exchange (NYSE)” (ICICI 2013, p. 1). The ICICI Bank’s BSE (Mumbai Stock Exchange) code is 532174 and its NSE symbol is ICICIBANK (NDTV 2014).
Financial and operational overview of ICICI Bank
According to the ICICI Bank’s financial statements of June 2013, the bank made a ‘consolidated profit’ of US dollar 463 million. This ‘consolidated profit’ showed an increase of 32% as compared to the ‘consolidated profit’ in June 2012. The bank’s ‘consolidated profit’ in June 2012 was US dollar 350 million. As per the bank’s financial statements, the ‘return on equity’ for the first quarter of 2014 is 15.6%. The ‘return on equity’ during the same period in 2013 was 13.3% (Yahoo Finance 2013).
The bank’s ‘standalone profit’ for the first quarter of 2014 is US dollar 383 million (Zacks 2013). The figures show that there has been an increase of 25% in the ‘standalone profit’ of the bank, as compared to the ‘standalone profit’ during the same period in 2013. The ‘standalone profit’ of the bank in the first quarter of 2013 was US dollar 306 million (Yahoo Finance 2013).
The proportion of the bank’s current and savings account also witnessed an enhancement. The ‘CASA ratio’ in the second quarter of 2013 was 43.2%. The ratio showed an improvement as compared to the figures during the same period in 2012. In the second quarter of 2012, the ‘CASA ratio’ of the bank was 41.9%. The provisions of the bank experienced an increase of 27.25%. As compared to US dollar 78 million in the first quarter of 2013, the provisions of the bank for the first quarter of 2014 are US dollar 100 million (Yahoo Finance 2013).
During the first quarter of 2013, the ‘net interest margin’ of the bank was 3.01%. The percentage increased to 3.27% for the first quarter of 2014. It is noticeable that ‘domestic net interest margin’ of the bank stood at 3.63% for the first quarter of 2014. The ‘non-interest income’ also showed a substantial increase for the first quarter of 2014 as compared to the same period in 2013. In 2013, it was US dollar 317 million, whereas for 2014, it is US dollar 418 million; an increase of 32% (Yahoo Finance 2013).
ICICI Bank has been able to achieve substantial growth during the previous year. Besides being India’s largest private bank, ICICI holds the second rank in the overall Indian banking sector. The bank at the top in the Indian banking industry is the State Bank of India (Glassdoor 2013). ICICI Bank maintained its influence in, “strong corporate franchise, its international presence and its branch network in India” (Yahoo Finance 2013, p. 1). During the previous year, the bank opened several additional branches and ATMs across the nation. To serve the village population and to expand its network, ICIC bank also opened 150 branches in Indian villages.
Stock performance and value to shareholders in recent history
Stocks of companies perform according to their business developments. The value to shareholders increases when the long-term returns are more than the cost of capital to the shareholder (Wasmer 2003). So, to understand the advantage of ICICI Bank’s shareholders, it is imperative to have a look at the bank’s share performance during the previous five years. The following chart depicts such results (The Economic Times 2014).
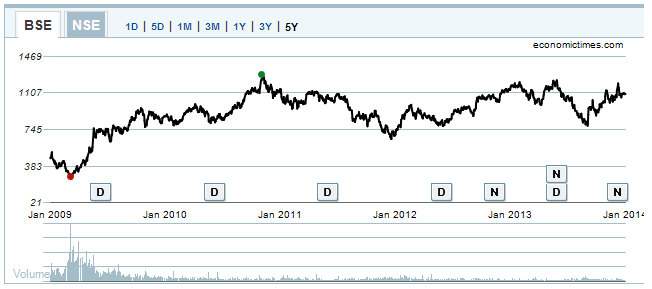
The chart depicts the share prices of ICICI Bank from January 2009 to December 2013 (5 years). The red dot shows the lowest share price and the green dot shows the highest share price. From the chart, it is evident that during the past five years, the lowest price for ICICI shares was INR 262.95 (during January 2009) and the highest was INR 1269.70 (during January 2011). The following chart depicts the performance of ICICI Bank’s shares during the year 2013 (The Economic Times 2014).
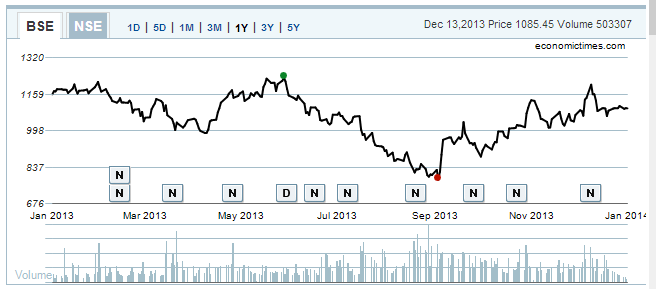
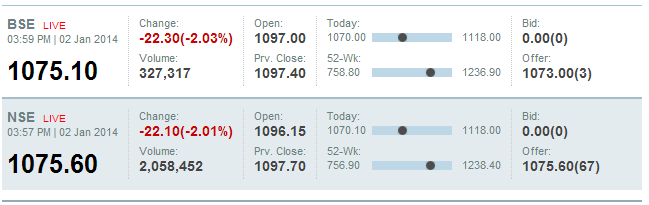
From the chart it is evident the highest price during the previous year was INR 1232.75 (during June). The lowest was INR 783.85 (during September). The following chart depicts the current share price of ICICI Bank (The Economic Times 2014).
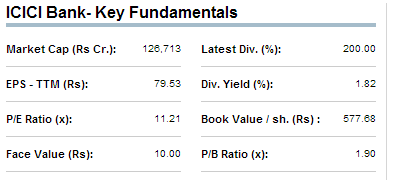
The key fundamentals of ICICI Bank are depicted in the following chart (The Economic Times 2014). The most important aspect to consider in this chart is the ‘price-earnings ratio (P/E ratio). It is calculated by dividing the ‘market value per share by the ‘earnings per share’. This particular ratio, as depicted in the chart is 11.21. This ratio is quite impressive. As the earnings per share increase, this ratio decreases (provided that the market value per share is constant). It is to be understood that the P/E ratio evaluates the share and not the company (Graham 2014). It is easy to be manipulated by the company to show a better view or performance of the company (Pietersz 2012).
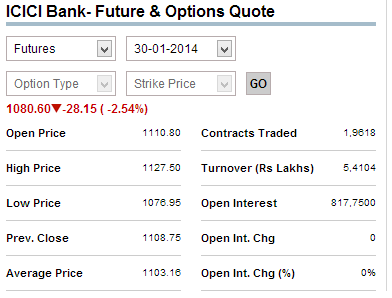
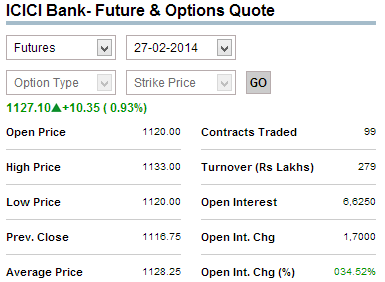
The following two charts depict the expected future performance of ICICI Bank’s shares. The first chart pertains to 31 January 2014 and the second one pertains to 27 February 2014. From both the charts, it is evident that the future prospects of the share are bright and shareholders can expect a better bargain for their shares.
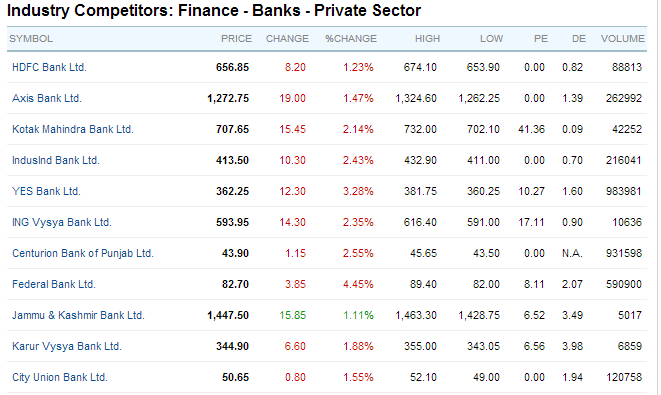
The following chart enlists the major competitors of ICICI Bank and their current share prices. Considering the current price of ICICI Bank’s shares (as depicted in chart # 3), only Axis Bank Limited and the Jammu and Kashmir Bank Limited seem to be performing better than ICICI Bank.
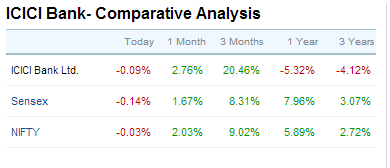
The following chart compares the performance of ICICI Bank’s shares with Sensex and NIFTY. It is evident from the chart that the ensuing three months are good for ICICI bank’s shareholders.
Net Asset Value (NAV) of ICICI Bank
“Net Asset Value is the market value of the assets of the scheme minus its liabilities” (SIFY 2008, p. 1). According to the financial report of ICICI Bank, the following are the details required (ICICI Bank 2013).
- Total assets: 287,202.90 (Amount in Crore Rupees)
- Total Liabilities: 32,133.60 (Amount in Crore Rupees)
In calculating the net asset value:
NAV (Equity) = Value of total assets–Value of total liabilities
NAV = 287202.90-32133.60
NAV = INR 255,069 crore
“The per unit NAV is the net asset value of the scheme divided by the number of units outstanding on the Valuation Date. Thus, NAV of a mutual fund unit is nothing but the book value” (SIFY 2008, p. 1). The numbers of shares as on 31 March 2013 were 1,153,581,715 (ICICI Bank 2013). Note: 1 crore = 10,000,000
The calculation of the book value is:
Book value per share = NAV / Number of shares
So, as of 31 March 2013, the book value calculation is:
Book value per share = 2,550,690,000,000 / 1,153,581,715 = 2211.10 or say INR 2,211.00
This implies that the book value per share of ICICI Bank is INR 2211.
Price/Earnings ratio of ICICI Bank
The P/E ratio of a company is the ratio of the market price of the share price compared with the earnings per share. The P/E ratio is a widely used valuation multiple used as a guide to the relative value of companies (Investopedia 2013). The P/E ratio is the most common valuation technique used by investors or finances professionals (Mayo 2007).
The earnings per share of ICICI Bank are INR 79.58 (Profit NDTV 2014).
The current share price of ICICI Bank is INR 1075.10.
So, the P/E ratio will be:
P/E ratio = 1075.10 / 79.58
= 13.509 or say 13.51
Discounted Free Cash Flow of ICICI Bank
“The discounted cash flow (DCF) analysis represents the net present value (NPV) of projected cash flows available to all providers of capital, net of the cash needed to be invested for generating the projected growth” (Macabacus 2014). For an organization such as ICICI Bank, discounted cash flow analysis by the free cash flow to equity is more appropriate. The free cash flow to equity can be calculated as below: Following is the calculation formula:
FCFE = Cash flow from operations–Capital expenditures + new debt financing–Debt repayment
ICIC Bank’s cash flow from operations (March 2013) is INR 11,102.01 crore (Moneycontrol 2014). The capital expenditures of ICIC Bank (March 2013) are INR 40,095.82 crore. ICICI Bank’s debt financing is INR 145,341.49 crore and the debt repayment is INR 115,641.03 crore.
So, the calculation will be:
11,102.01–40,095.82+145,341.49–115,641.03 = 706.65 (in crore INR).
Expected rate of increase in GDP (India) is 4.8% (The Times of India 2013).
Cost of equity (Ke) = Risk-free rate + (market risk premium x beta of ICICI Bank)
R = Rf + β (Rm – Rf)
The ‘risk-free rate’ is 7.16% (India macroeconomic snapshot 2013, para. 1). The beta of ICICI Bank is 1.86 (Reuters 2013c). The market risk premium is 11.92% (Mohanty 2013).
The calculation is:
Ke = 7.16% + (1.86 x 11.92%) = 29.33%
PV of the FCFE for the next five years:

PV = {740.57 / (1+29.33)} + {776.12 / (1+29.33)²} + {813.37 / (1+29.33)³} + {852.41 / (1+29.33)4} + {893.32 / (1+29.33)5}
PV for the next five years is = 25.28 Crore INR
The PV of an organization’s terminal value = (FCFE6 / (Ke – g) * (1/(1+Ke)5)
g = the assumed growth rate for the subsequent years
PV of terminal value of ICICI Bank = (893.32 / (0.2943 – 0) x (1 / (1+0.2943)5 = 3035.40 x 3.63
= 11,018.50 crore INR
The value of ICICI Bank’s equity = PV of 5 years FCFE + PV of terminal value = 25.28 + 11018.50 = 11,043.78 crore INR
Therefore the value per share of ICICI Bank = 11043.78 / 115.358 = 95.73 INR
References
Glassdoor 2013, ICICI Bank.
Graham, J 2014, The price to earnings ratio.
ICICI 2013, About us.
ICICI Bank 2013, Unconsolidated financial results, Web.
Investopedia 2013, Price-earnings ratio – P/E ratio.
India macroeconomic snapshot 2013, Web.
Macabacus 2014, Discounted cash flow (DCF) analysis.
Mayo, H 2007, Investments: An introduction, Cengage Learning, USA.
Microcapital 2013, ICICI Bank Limited, Web.
Mohanty, P 2013, Market risk premium at the end of June 2013, Web.
Moneycontrol 2014, ICICI Bank.
NDTV 2014, ICICI Bank Ltd, Web.
Pietersz , G 2012, Adjusted EPS, Web.
Profit NDTV 2014, ICICI Bank’s key fundamentals, Web.
Reuters 2013a, ICICI Bank Ltd, Web.
Reuters 2013b, Full description, Web.
Reuters 2013c, ICICI Bank Ltd (ICBK.NS), Web.
SIFY 2008, What is net asset value?, Web.
The Economic Times 2014, ICICI Bank Ltd, Web.
The Times of India 2013, RBI lowers FY14 GDP growth to 4.8%.
Wasmer, K 2003, Increasing shareholder value, Web.
Yahoo Finance 2013, ICICI Bank announces performance review – Quarter ended June 30, 2013, Web.
Zacks 2013, Strong Q1 earnings for ICICI Bank, Web.