Introduction
Abu Dhabi Commercial Bank was founded in 1985 and is currently the third-largest commercial bank in the United Arab Emirates by Assets. Abu Dhabi Commercial Bank is a UAE-based public joint-stock company that operates in the commercial bank sector. Most of the Bank’s shares (about 65 percent) are owned by state-controlled Abu Dhabi Investment Council. Abu Dhabi Commercial Bank links its retail, commercial, investment, and merchant banking services with brokerage and asset management services through its branches within and without the United Arab Emirates.
The bank has about 42 branches in UAE, 2 branches in India, 137 ATM networks, and an offshore banking entity in Cayman Island. Abu Dhabi Commercial Bank also offers products that are compliant with the Islamic principles and practices (Abu Dhabi Commercial Bank Management and Analysis Report, 2011, P. 3). In the year 2008, the bank was recognized by the Middle East Banking Association as the ‘Best Bank’ and the Best Advertising and Marketing Bank’. The bank has also received accolades from the Asian Bankers Excellence awards as the best retail bank in the United Arab Emirates.
In September of the same year, the bank appointed a new chairman and five directors to oversee the newly launched Islamic banking division-ADCB Meethaq. The division was to provide Shariah-Compliant financial solutions to Muslim clients (ADCB, 2011, P. 2).
Headquartered in Abu Dhabi (UAE), Abu Dhabi Commercial Bank is a full-service commercial bank that provides a broad range of products and services, for instance, retail banking, management of wealth, personal banking, corporate banking and finance, foreign exchange, Shariah-compliance products, project finance, and property management services among others. The bank was originally known as Khalij Commercial Bank.
The bank changed its name after merging with Emirates Commercial Bank and Federal Commercial Bank in 1985. Currently, the bank has over 20 affiliates/ associates/ subsidiaries in UAE, Cayman Islands, United Kingdom, and Malaysia. The bank also boasts of numerous investments and funds such as Al Bashar Fund, Al Nokhithitha fund, Al Barari Development Company, and Gulf Merchant Group among others (Press Release, 2012, P. 1).
The bank is owned by the Abu Dhabi Investment Council (an investment arm of the Abu Dhabi government) which claims over 64.4 percent of its shares. Abu Dhabi Investment Council (ADIC) was split from Abu Dhabi Investment Authority (ADIA) and took control of most of the assets formerly owned ADIA which includes Abu Dhabi Commercial Bank and Abu Dhabi Investment Company among others. The council’s most important people are HH Sheikh Khalifa bin Zayed Al Nahyan who is the Chairman and HE Khalifa Mohammed Al Kindi who is the Managing Director. The topmost ranking office within the council is the office of the Managing Director (MD). The MD is in charge of the operations of the council and reports to the Board of Directors (Abu Dhabi Commercial Bank Management and Analysis Report, 2011, P. 3).
Abu Dhabi Commercial Bank (ADCB) operates as a different entity and is governed by the same structure as Abu Dhabi Investment Council. The current chairman of ADCB is H.E Eissa Al Suwaidi and the Chief Executive Officer who is also a member of the board is Ala’a Eraiqat. The board consists of the chairman, vice-chairman, CEO, and directors. On the other hand, the executive wing of the management led by the CEO is comprised of Chief Financial Officer, Chief Risk Officer, Head of Treasury and Investments, Head of Wholesale Banking, Head of Consumer Banking, Head of Operations and IT, Head of Government Relations, Head of Human Resources, Head of Internal Audit and the General Counsel and Board Secretary (Press Release, 2012, P. 1; ADIC, 2012, P. 2).
Background Check of the Banking Industry
UAE banking sector comprises both domestic and foreign banks offering both conventional and Islamic banking services. In tandem with the economic growth, UAE banks recorded impressive growth in total assets, surging at a three-year rate of 39.6 percent reaching AED 1223.07 bn during 2009-2011. While the total assets rose by 36 percent to AED 15000 BN IN 2011, the national bank’s assets accounted for over 76 percent of these assets (AED 1113 bn).
The country’s banking penetration has considerably increased. The penetration level which is represented by the total asset to GDP ratio has risen to 170 percent in the last three years. The overall deposit to GDP ratio has also increased by 100 98 percent over the last three years, at the same time the ratio of credit deployment to GDP has increased up to 124 percent. Fascinatingly, towards the end of the last financial year banks in the UAE had an average capital adequacy ratio of 13 percent against 8 percent which is the threshold. Considerable improvement on the population to branch ratio (8000 people per branch) was also recorded. Similarly, the population to ATM level also reduced to 2600 in the last three years (Press Release, 2012, P. 2).
Even though the total domestic credit and investment grew by 39,7 percent in the last three years, it rose by 57 percent in the last financial year to over AED1000 billion. This increase is attributed to the service offered to the private sector to support the growth of credit facilities. The credit segment increased by 59 percent to AED 800 billion as a result of increased loans, high real estate mortgage loans, overdraft facilities among others.
Real estate mortgage loans to the private sector increased by 132 percent to AED 120 bn. In the meantime, the overall credit to residents rose 58 percent to AED 950 BN, attributed to healthy growth of the construction, commercial and private loan activities. Nevertheless, due to the decline in the market value of the foreign securities, foreign assets went down by 3 percent to 240 bn in December 2011. Conversely, banks foreign liabilities increased 24 percent to AED 326 bn on account of higher outstanding amounts to foreign banks (Press Release, 2012, P. 2).
When the credit crunch hit the global financial crisis in the second half of 2008, many banks in the country began to offload their balances with the central bank. Consequently, cash and deposits with the central bank declined significantly.
Similar to other nations, banks in UAE were also hit by the global financial crisis otherwise known as the sub-prime crisis. The problem was no longer a crisis of the periphery rather the problem had hit the heartland of the financial capital. This was because of the bank’s interest to protect the shareholders. There led to increased cost of borrowing since there were higher fees that included agency fees, upfront fee, standby fee and underwriting fee.
This came about after the credit crunch where bond market closed, underwrite and syndicate bank lending weakened, club deals were common and some banks and life insurance companies financed small projects single handed. Default provisions in public private partnership financing agreements contained default events usually found in other loans agreements plus default events specifically tailored to the project. Bond financing focussed on ratings downgrade. Banks reviewed defaults with greater scrutiny by tightening loan agreement provisions and required earlier triggers. Banks re-examined default provisions in agreements executed prior to the credit crunch (Davidson, 2008, P. 4).
Major subprime crisis in the UAE was felt in the mid 2008 on the corporate investment. The Subprime crisis characterized unexplored harmful shocks to the supply of exterior finance for non-financial firms. Corporate investments declined to a great extent following the inception of the crisis, controlling for the construction firm’s permanent effects ands varied measures of investment opportunities. Steady with the sources of the supply shock, the crisis affected most firms with small cash reserves or with high short term debts thus financially repressed or operated on external funding. The effects of the crisis weakened significantly with the commencement of third quarter of 2009, when the demand side effects of the crisis stated to take course eliminating the supply constraints (Murphy, 2009, P. 14).
Subprime crisis begun when consumers defaulted to payback on their mortgage debts. Effects of the crisis include regional banks failure and collapse of several financial institutions. In general, many financial institutions, for instance banks and insurance companies, saw enormously decline in capital associated with bad debts and plunging values of collateralized debt repayments. The massive losses have led to escalation of interest rates in risk management for the banks and have decreased their capability and willingness to take risk. This is evident in stringent lending conditions, withdrawn lines of credit bonds and increased loan spreads.
To understand the magnitude of subprime crisis emphasis was placed on the shocks to the supply of the external funding affects the economy. Theoretically, negative shocks to the supply of external funding, jointly with the existence of financing problems, impedes investment if companies are in short of enough financial slack to finance all of its internal profitable ventures. Furthermore, some studies suggests that, subprime crisis was felt in depth by companies who are exposed to higher cost of acquiring external funds or are in greater need to carry out the same (Murphy, 2009, P. 14;Barker et al., 2009, p. 21).
Liquidity limitations not only affected the price of loans but also the amount available as financial institutions rationed loans regardless of the prices. Financial institutions had become cautious of increasing loans and the relegation of the major business firms due to the crisis thus contracted the capital market for construction projects. The banks which were willing to offer loans were not able to do so because of the limited cash reserves. Reduction of private partnership and stagnant external debts caused a huge impact on the balance sheet and the repayment of loans. The global economic and financial crisis generated challenges at all levels of the economy decisions (Barker et al., 2009, p. 22). UAE governments and emerging markets faced an urgent need to act concurrently in different fronts.
Methodically and politically sensitive economic sectors had to be bailed out. The general downfall in economic activities had to be counteracted and vulnerable population groups had to be protected from declining incomes. These costly actions were taken in a context of falling government revenues and shrinking domestic and foreign financing, with medium to long term consequences for budgets and debt. As a result of the precautionary measures the UAE central bank became more cautious in lending to the construction industry. The banks were also charging high interest rates while giving loans to real estate developers and clients. This negatively affected the mortgage volume by hurting the demand for real estate demand (Murphy, 2009, P. 14).
Towards the end of 2009, the UAE central bank reduced the limit on loans to the real estate industry to 11 percent of the total bank assets and reduced the total deposits from 20 percent to 18 percent. Fascinatingly, Islamic financial institutions were protected by the government. Over the recent past, Islamic banking assets have been increasing at an alarming rate, mainly because of the rising demand for Shariah-compliant banking products and the political good will and support from the UAE government. In addition, most of the projects in the country are demanding for Shariah-compliant products and this has played a major role in promoting Islamic banking industry. The rising demand for Islamic banking services has also helped to stabilize and grow the banking assets in UAE (Press Release, 2012, P. 4).
Furthermore, the recent surge in population has also helped to support the banking sector. According to the government statistics about 90 percent of the population was engaged in the troubled construction industry and real estate sector. Collapse of these sectors would affect both the population growth and consequently bank’s credit and deposit growth. To avert the negative effects of the subprime crisis, the country’s central bank took many steps to calm down the economy, pumping in liquidity and restructuring economic activities. The central bank had reduced its repo rate five times within the crisis. In 2009, the central bank had lowered its lending rate from 5 percent to 3 percent. This really boosted the growth of credit in the private sector which in turn facilitated the overall growth of the economy through investment and consumption (Barker et al., 2009, p. 22).
Analysis of Abu Dhabi Commercial Bank
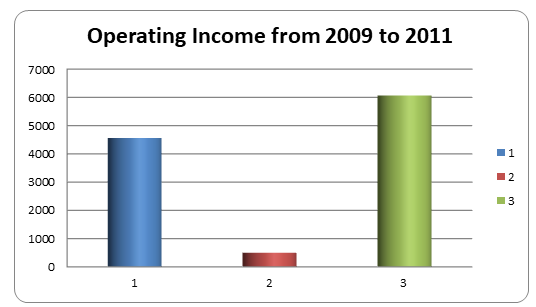
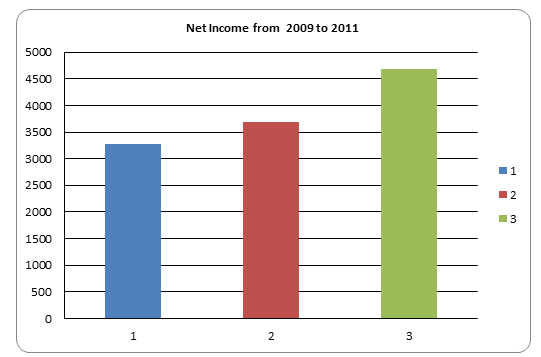
Abu Dhabi Commercial Bank trades in Abu Dhabi Security Exchange and is identified as Abu Dhabi Commercial Bank PJSC (ADCB). As per March 4th 2012 the banks shares were trading at 3.10 dirham per share. The company’s earning per share in the last financial year had risen from AED 0.51 from AED 0.04 which was recorded the previous year. Earning per share attributed to the sale of investment in subsidiary companies was AED 0.24. The bank reported a net profit of AED 3045 mn in the last financial year (Dec 2011) compared to AED 390mn which was recorded in the previous year (Dec 2010). The net profit was boosted by the sale of shares in RHB Capital Berhad, leading to in an extraordinary item gain of approximately 1,314 mn (Shahine, 2012).

The bank’s operating income in the last financial year reached AED 6069 mn which represented a record growth of 21 percent from the previous year. On the other hand, non-interest income in the same period increased by 5 percent, reaching AED 1382 mn. Net fees decreased by 6 percent, while net trading income rose by 9 percent reaching AED 336 mn.
Abu Dhabi Commercial Bank reported a recorded total net interest and Inslamic finance income in the last financing income at approximately 4700 mn, an increase of 27.2 percent from the previous year. This was particulaly attributed to the bank’s improved funding profile, reduced interest expenses (18 percent) and improved cost of funding (2.16 percent increase). Gross interest and islamic banking income for the financial year 2010/.2011 rose to AED 7716, representing as 5 percent increase. Return on interest earning assets for the last finacial year was at 5.11 percent which represents a drop of 0.03 percent from the previous year. Net interest marging rose by 0.53 percent from the previous year to settle at 3.10 percent (Shahine, 2012).
ADCB Operating expenses and Cost to income ratio
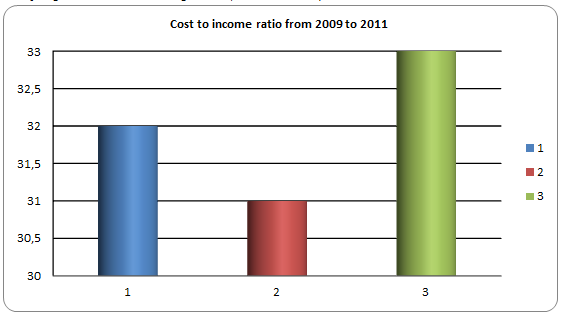
Operating expenses increased by 25 perecent in the last financial year to AED 2063 mn, particularly attributed to the cost of acquired retail banking, management of wealth and small and Medium businesses of the Royal Bank of Scotland in the United Arab Emirates, and the Bank’s devotion to invest in modern systems and technology. Cost to income ratio for the finacial year 2010/.2011 increased by 2 percent (from 31% to 33%) and the percentage contribution of workers costs to overall operating expenses rose by 3 percentage, while the percentage contribution of the overall administrative expenses in relation to overall expenses decreased by 5 percent in the same period (KPMG, 2011).
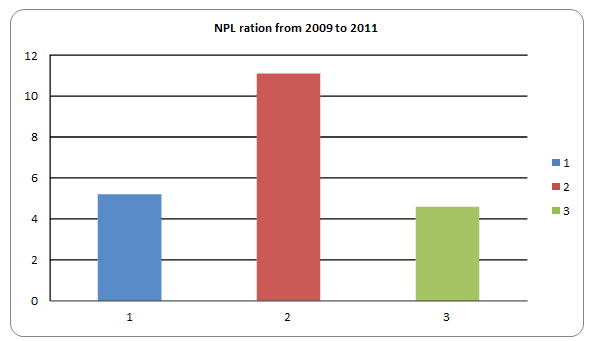
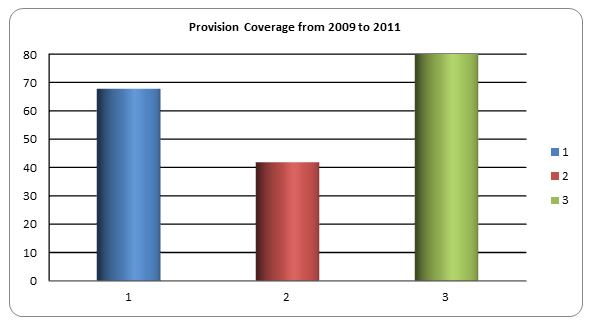
The Non-Performing Loan ratio declined by 5.8 percent (excluding Dubal global exposure) within the two cosecutive financial period and provision coverage ratio rose by 69.6 percent (excluding Dubai global exposure) within the period. Loan worth AED 6749 were transfered from impaired to performing loans based on the fullfillment of the terms agreed upon. The net impairment allowance during the last finacial year reduced by 27 percent to AED 2398mn.
The provision for the funded and non-funded invetsment portfolio amounted to AED 315 mn compared to AED 427 mn in the previous year, which is 26 percent lower. Portfolio impairement allowance balance for the bank in 2011 was AED 2059 mn and credit rik weighted asset wasn at 1.59 percent. Exposure to investment in CDS were considerably minimised AED 55 mn from AED 1457 mn in the previous financial year. Risk cost recorded an improvement of 84 bps at 1,77 percent compared to 2.66 percent of the previous financial year (KPMG, 2011).
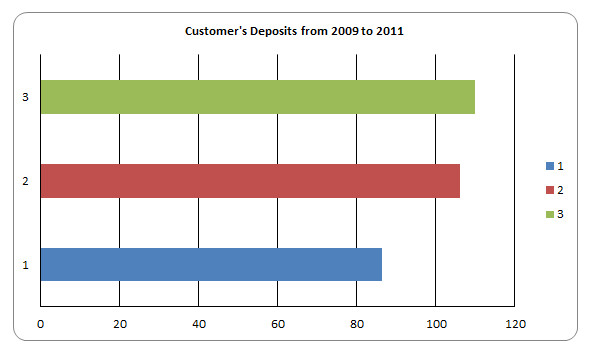
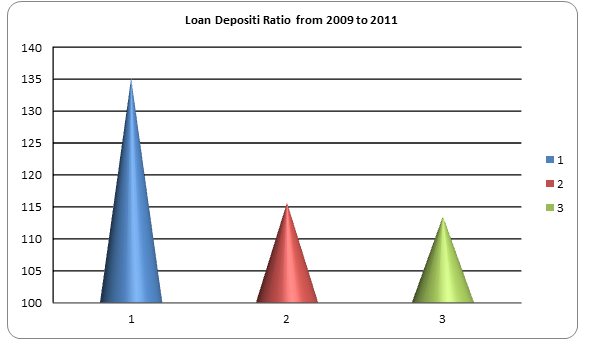
The total assets of the Abu Dhabi Commercial Bank in last finacial year (2010/2011) was estimated at about 184 million Dirhams, representing a 3 pecent growth from the previous period. Gross customer loans on the same period was 130 million dirhams, representing a one percent growth from the previous finacial year. Total ttal amount of customer deposits is estimated to be around 110 billion dirhams and represents a 4 percent growth from the previous financial year. Loan to deposit ratio had improved significantly by over 113 percent to 215 bps towards the end of 2011. Advance to stable ratio (set by the United Arab Emirate’s central bank) of the Abu Dhabi central bank is 92 percent which is below the maximum 100 percent level set by Central Banks all over the world (Shahine, 2012).
ADCB Capita and Liquidity
Towards the end of 2011, ADCB capital adequacy ratio had increased to 22.51 percent from 16.65 recorded in the previous year. The Bank’s tier 1 ratio also rose to 15.97 percent from 11.97 percent in the previous financial year, which is above the minimum requirement (8 percent) of the UAE central Bank. Thebank’s liquidity ratio had increased by 4.68 percent in the last financial year to 22.13 percent (Giarraputo, 2012).
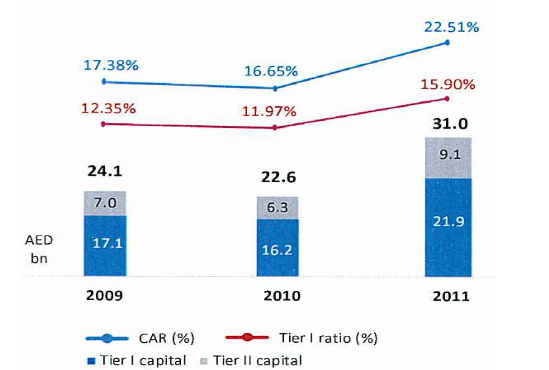
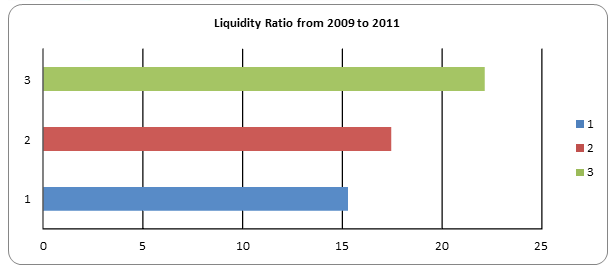
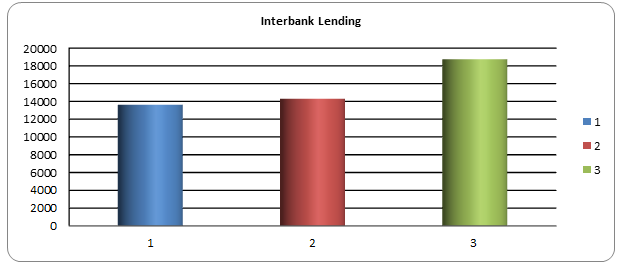
N/B: ADCB’ s liquid assets include cash and balances with the UAE central banks, deposits due from banks, security trading, and liquid investments. In addition, the certificate of deposit from the UAE central bank is regarded as due to the bank for the intention of calculating the bank’s net position in the interbank market (Giarraputo, 2012).
Comparing ADCB and Abu Dhabi National Bank
United Arab Emirates banks, along with Saudi and Kuwait banks have dominated most of the Asian markets. As a result, UAE has three banks among the top Middle East banks. This ranking is pegged on the tier one shareholder’s equity as defined by the global banking standards. The table in the appendix provides the list of the top ten banks (both conventional and Islamic banks) with their positions among the top 100 Middle East banks based on their assets, profits, ROE, and ROA. The most obvious observation is that all the banks made a profit in the last financial year. The country’s central bank had set a standard of 10 percent capital per asset ratio and most of these banks surpassed it.
Only three banks ( National Bank of Dubai, Union National Bank, and Commercial Bank of Dubai) had a lower capita/asset ratio that did not meet the central bank’s threshold. The table also shows that Return On Asset (ROA) and Return on Equity (ROE) were much higher among the conventional banks as compared to Islamic banks. The highest Return on Equity (ROE) was reported by the Union National Bank (20.3 percent), while the highest Return on Asset (ROA) was reported by the Commercial Bank of Dubai (3.3 percent). The top Top UAE BANKS based on its capita is Emirates Bank International and the top ten bank based on its asset is the National bank of Abu Dhabi (Giarraputo, 2012).
One of the main competitors of Abu Dhabi Commercial Bank is the National Bank of Abu Dhabi. Abu Dhabi National Bank is ranked among the best four financial institutions in the Arab world. This bank relies on market research, long-term credit ratings, and analysis of the world’s largest banks in conducting its business. The Banks Headquarters is also in Abu Dhabi and has a similar operational structure as that of Abu Dhabi Commercial Bank. The bank’s chairman is H.E Nasser Ahmed Khalifa and the Chief Executive Officer is Michael Tomalin. This bank was incorporated in 1968 to serve the UAE government and the emirates of Abu Dhabi. This bank also served the role of the central bank until 1975 when the currency board was formed (Abu Dhabi Securities Market, 2011).
Abu Dhabi National Bank is organized into three fold-customer focused businesses. These include UAE local banks, foreign businesses, and local investment banks. Abu Dhabi National Bank’s retail client base is divided into retail, elite and personal banking. The foreign banking segment oversees foreign subsidiaries based in all corners of the world including Africa, Europe, America, Asia, and the U.S. Abu Dhabi financial services in Abu Dhabi National Bank’s fully owned subsidiary which offers brokerage services in domestic and international equities. Furthermore, it offers commodities trading and managing IPOs (Initial Public Offers) and is presently UAE’s largest brokerage firm.
This bank also trades in the Abu Dhabi stock exchange and is known as the National Bank of Abu Dhabi PJSC-NBAD. The price of its share as of April 11 was AED 8.69 which is slightly higher than the price of Abu Dhabi Commercial Bank’s share on the same period which was AED 3.24. Its outstanding share volume in the Abu Dhabi stock market on the same period was 3874558 compared to 4930530 of Abu Dhabi Commercial Bank. This means the latter floats more shares than the former. Apendix 1 and 3 provides a summary of the two banks during the same period (Abu Dhabi Securities Market, 2011).
From the two summaries it is clear that Abu Dhabi National Bank’s income (AED 6382.31mn) is slighly higher than that of Abu Dhabi Commercial Bank (AED 5144.56mn). This partly atributed to its size and global networks. The trend is also similar with Net profit with Abu Dhabi National Bank having AED 3707.55mn as compared to AED 3025mn of Abu Dhabi Commercial Bank in 2011. As per the last finacial year Abu Dhabi National Bank’s total assets were estimated at AED 255667.51mn compared to Abu Dhabi Commercial Bank which had AED 183725.63 mn. This means that Abu Dhabi National Bank’s asset base is larger than Abu Dhabi Commercial Bank. On the same period Abu Dhabi National Bank had an equity of AED 26389.49mn compared to Abu Dhabi Commercial Bank’s equity which was estimated at AED 22072.01 mn.
By the look of these figures one can conclude that National Bank of Abu Dhabi is doing better than Abu Dhabi Commercial Bank. This is partialy tru but not the case in absolute sense. To verify this we can observe trend of growth of assets, equity and liabilities of the two banks. Between 2010 and 2011 the assets value of Abu Dhabi commercial bank grew by 3 percent as compared by National Bank of Abu Dhabi whose assets grew by only 2 precent. This means Abudhabi Commercial Bank did better than National Bank of Abu Dhabi during the same period. During 2010/2011 period Abu Dhabi Commercial BANK’S Equity grew by 12 percent as compared to National Bank of Abu Dhabi whose equity grew by 9.4 percent. In this case Abu Dhabi Commercial Bank also did better than National BANK OF Abu Dhabi.
However, the share market price of the two banks tells a different story. Looking at the tables it is very obvious that the share price of National Bank of Abu Dhabi has been growing faster than that of Abu Dhabi Commercial Bank. The current share value of the latter stands at AED 2.780 compared to the former which boasts of AED 10.950 share price (Abu Dhabi Securities Market, 2011).
Return on Asset (ROA) and Return on Equity (ROE) for Abu Dhabi Commercial Bank are 1.65 percent and 13.71 percent respectively during the year 2010/2011. On the other hand, Return on Asset and Return on Equity for National Bank of Abu Dhabi are 1.45 percent ans14.05 percent during the same period. From the observation it is clear that Abu Dhabi Commercial Bank recorded a slighly higher fighure for ROA compared to National Bank Of Abu Dhabi.
The reverse is true for the case of ROE. However, the historical trend tells us a different story. Between 2010 and 2011 alone Abu Dhabi Commercial Bank experienced a record OF 11.76 percent increase on ROE to13.71 compared to National Bank of Abu Dhabi which experienced a negative growth of 1.22 percent to 14.5 although this figure was still higher than that of its competitor.
Conversely, Abu Dhabi National Bank experienced a 1.44 percent increase on Return on Asset compared to National Bank of Abu Dhabi which experienced a negative growth of 0.29 percent. However, this figure was this time lower than that of its competitor (Abu Dhabi Securities Market, 2011). Abu Dhabi Commercial Bank reported a recorded total net interest and Inslamic finance income in the last financing income, an increase of 27.2 percent from the previous year. This was particulaly attributed to the bank’s improved funding profile, reduced interest expenses (18 percent) and improved cost of funding.
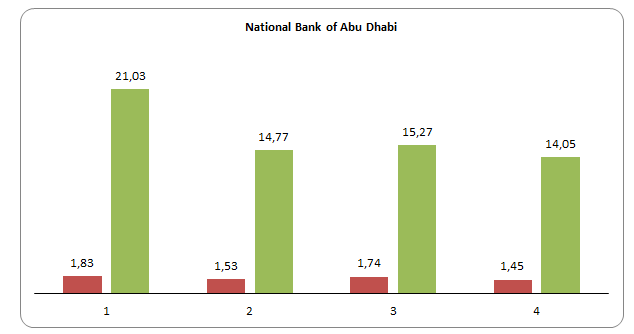
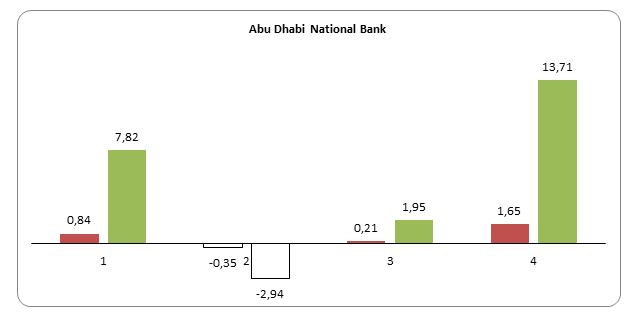
N/B: Red graphs represents ROA in ascending order from 2008 to 2011.
Green Bar graphs represents ROE in ascending order from 2008 to 2011.
Conclusion
Abu Dhabi Commercial Bank is a full-service commercial bank that provides a broad range of products and services, for instance, retail banking, management of wealth, personal banking, corporate banking and finance, foreign exchange, Shariah-compliance products, project finance, and property management services among others. Most of the Bank’s shares (about 65 percent) are owned by state-controlled Abu Dhabi Investment Council. Abu Dhabi Commercial Bank links its retail, commercial, investment, and merchant banking services with brokerage and asset management services through its branches within and without the United Arab Emirates. In the year 2008, the bank was recognized by the Middle East Banking Association as the ‘Best Bank’ and the Best Advertising and Marketing Bank’.
The bank has also received accolades from the Asian Bankers Excellence awards as the best retail bank in the United Arab Emirates.UAE banking sector comprises both domestic and foreign banks offering both conventional and Islamic banking services. In tandem with the economic growth, UAE banks recorded impressive growth in total assets, surging at a three-year rate of 39.6 percent reaching
AED 1223.07 bn during 2009-201. When the credit crunch hit the global financial crisis in the second half of 2008, many banks in the country began to offload their balances with the central bank. Consequently, cash and deposits with the central bank declined significantly. Similar to other nations, banks in UAE were also hit by the global financial crisis otherwise known as the sub-prime crisis. Liquidity limitations not only affected the price of loans but also the amount available as financial institutions rationed loans regardless of the prices. Financial institutions had become cautious of increasing loans and the relegation of the major business firms due to the crisis thus contracting the capital market for construction projects. The banks which were willing to offer loans were not able to do so because of the limited cash reserves.
The reduction of private partnerships and stagnant external debts caused a huge impact on the balance sheet and the repayment of loans. The global economic and financial crisis generated challenges at all levels of economic decisions. UAE governments and emerging markets faced an urgent need to act concurrently on different fronts. Methodically and politically sensitive economic sectors had to be bailed out. The general downfall in economic activities had to be counteracted and vulnerable population groups had to be protected from declining incomes. These costly actions were taken in the context of falling government revenues and shrinking domestic and foreign financing, with medium to long-term consequences for budgets and debt. As a result of the precautionary measures, the UAE central bank became more cautious in lending to the construction industry.
The banks were also charging high-interest rates while giving loans to real estate developers and clients. This negatively affected the mortgage volume by hurting the demand for real estate demand. Towards the end of 2009, the UAE central bank reduced the limit on loans to the real estate industry to 11 percent of the total bank assets and reduced the total deposits from 20 percent to 18 percent. Fascinatingly, Islamic financial institutions were protected by the government. Over the recent past, Islamic banking assets have been increasing at an alarming rate, mainly because of the rising demand for Shariah-compliant banking products and the political goodwill and support from the UAE government. In addition, most of the projects in the country are demanding Shariah-compliant products and this has played a major role in promoting the Islamic banking industry.
The rising demand for Islamic banking services has also helped to stabilize and grow the banking assets in UAE. To avert the negative effects of the subprime crisis, the country’s central bank took many steps to calm down the economy, pumping in liquidity and restructuring economic activities. The central bank had reduced its repo rate five times within the crisis. In 2009, the central bank had lowered its lending rate from 5 percent to 3 percent. This boosted the growth of credit in the private sector which in turn facilitated the overall growth of the economy through investment and consumption.
The total assets of the Abu Dhabi Commercial Bank in the last financial year (2010/2011) were estimated at 184 million Dirhams, representing a 3 percent growth from the previous period. Abu Dhabi Commercial Bank reported a recorded total net interest and Islamic finance income in the last financing income at approximately 4700 mn, an increase of 27.2 percent from the previous year. This was particularly attributed to the bank’s improved funding profile, reduced interest expenses (18 percent), and improved cost of funding.
The closest competitor of the bank has been the Abu Dhabi National Bank. Abu Dhabi National Bank is ranked among the best four financial institutions in the Arab world. This bank relies on market research, long-term credit ratings, and analysis of the world’s largest banks in conducting its business. The Banks Headquarters is also in Abu Dhabi and has a similar operational structure as that of Abu Dhabi Commercial Bank.
As per the last financial year, Abu Dhabi National Bank’s total assets were estimated at AED 255667.51mn compared to Abu Dhabi Commercial Bank which had AED 183725.63 mn. This means that Abu Dhabi National Bank’s asset base is larger than Abu Dhabi Commercial Bank. In the same period Abu Dhabi National Bank had an equity of AED 26389.49mn compared to Abu Dhabi Commercial Bank’s equity which was estimated at AED 22072.01 mn.Between 2010 and 2011 the assets value of Abu Dhabi commercial bank grew by 3 percent as compared by National Bank of Abu Dhabi whose assets grew by only 2 precent.
This means Abudhabi Commercial Bank did better than National Bank of Abu Dhabi during the same period. During 2010/2011 period Abu Dhabi Commercial BANK’S Equity grew by 12 percent as compared to National Bank of Abu Dhabi whose equity grew by 9.4 percent. In this case Abu Dhabi Commercial Bank also did better than National BANK OF Abu Dhabi. However, the share market price of the two banks tells a different story. Looking at the tables it is very obvious that the share price of National Bank of Abu Dhabi has been growing faster than that of Abu Dhabi Commercial Bank.
The current share value of the latter stands at AED 2.780 compared to the former which boasts of AED 10.950 share price. Return on Asset (ROA) and Return on Equity (ROE) for Abu Dhabi Commercial Bank
are 1.65 percent and 13.71 percent respectively during the year 2010/2011. On the other hand, Return on Asset and Return on Equity for National Bank of Abu Dhabi are 1.45 percent ans14.05 percent during the same period. From the observation it is clear that Abu Dhabi Commercial Bank recorded a slighly higher fighure for ROA compared to National Bank Of Abu Dhabi. The reverse is true for the case of ROE.
However, the historical trend tells us a different story. Between 2010 and 2011 alone Abu Dhabi Commercial Bank experienced a record OF 11.76 percent increase on ROE to13.71 compared to National Bank of Abu Dhabi which experienced a negative growth of 1.22 percent to 14.5 although this figure was still higher than that of its competitor. Conversely, Abu Dhabi National Bank experienced a 1.44 percent increase on Return on Asset compared to National Bank of Abu Dhabi which experienced a negative growth of 0.29 percent. However, this figure was this time lower than that of its competitor.
Abu Dhabi Commercial Bank reported a recorded total net interest and Inslamic finance income in the last financing income, an increase of 27.2 percent from the previous year. This was particulaly attributed to the bank’s improved funding profile, reduced interest expenses and improved cost of funding. Abu Dhabi Commercial Bank is not doing badly against its closest rivals in the industry both in the banking business and trading in the stock market.
Even though its share price has been moving up at a relatively slower rate than that of National Bank of Abu Dhabi, it has remained stable. Abu Dhabi Commercial Bank’s success is attributed to divesification of its product, increasing shariah-compliant products and personal banking. The only reason why it has not gone above National Bank of Abu Dhabi is because the latter enjoyed massive government support during its earlier stages and therefore has massive capital/. Asset base. In addition, National Bank of Abu Dhabi is spread internationaly more than Abu Dhabi Commercial Bank. Nevertheless, with the current trend it is just a matter of time before the bank becomes number one in United Arab Emirates and the entire Middle East.
References
Abu Dhabi Securities Market. (2011). National Bank of Abu Dhabi: Financial Year Summary. Web.
Abu Dhabi Commercial Bank Management and Analysis Report. (2011). Abu Dhabi Commercial Bank PJSC Report for 2011 financial year. Web.
ADCB. (2011). Abu Dhabi Commercial Bank PJSC Full Report 2011. Web.
ADIC. (2012). Abu Dhabi Investment Council. Web.
Barker, J., Brooke, G., Ramamurthy, S. & Wilschetz, T. (2009). Global crisis in infrastructure. Web.
KPMG. (2011). National Bank of Abu Dhabi P.J.S.C: Consolidated Financial Statement. Web.
Davidson, S. (2008). Don’t Blame CDOs for the Subprime Crisis. Web.
Giarraputo, J. D. (2012). Abu Dhabi National Bank among the world’s safest banks. The New Independent Libya Daily, p. 1.
Lynch, B.M. (2011). National Bank of Abu Dhabi P.J.S.C.
Murphy, T. (2009). 4th Construction financing course: financing changes for P3s after the credit crisis. Web.
Press Release. (2012). Abu Dhabi Commercial Bank PJSC reports full year 2011 record net profit of AED 3,045 MN, recommends cash dividend of 20%. Web.
Shahine, A. (2012). Persian Gulfs Stocks: Abu Dhabi Commercial Bank, Gulf General. Bloomberg Business Week, p. 1. Web.