Industry: Apparel Stores
Gap, Inc.
- Date: 01/09/14
- Ticker Symbol: GPS – NYSE
- Recommendation: Hold
- Current price: $46.15
- Price Target: $46.03
Earnings per Share
Highlights
- The company reported an increase in the value of net sales over a five year period, that is, between 2009 and 2013. The value increased from $14,197 million in 2009 to $16,148 million. The gross profit margin declined gradually from 40.3% in 2009 to 39.0% in 2013. The operating margin fluctuated over the five year period.
- The net income fluctuated during the five year period. The value ranged between $883 million to $1,280 million. Generally, there as an improvement in profitability between 2009 and 2010. In 2011, the company reported a decline in performance and it later improved between 2012 and 2013.
- The total assets of the company declined over the period. In 2009, the value was $7,985 million. It declined to $7,065 million in 2010. It increased gradually to $7,849 million. Similarly, the amount of stockholders’ equity dropped from $4,891 million in 2009 to $3,062 million in 2013. The cash used to purchase property and equipment increased from $334 million in 2009 to $670 million in 2013.
- Others: The number of franchise store locations opened at the end of the year increased from 136 in 2009 to 375 in 2013. Further, the company-operated store locations opened at the end of the year also increased from 3,095 to 3,164 in 2013. Finally, during the five year period, the company one acquisition in 2010 which was worth $129 million.
Daily Stock Price
The chart presented below shows the daily stock price for the company between 1st February 2009 and 31st January 2013.
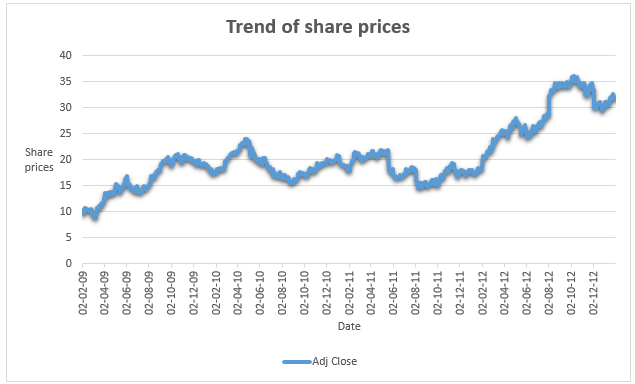
Source of data – Yahoo Finance 2014b Source of chart – self-generated
Market Profile
Business Description
The Gap Inc., established in 1969, is a multinational company that is based in California, America. The company operates in the retail industry and trades in clothing and other accessories. Gap, Inc. was founded by Donald Fisher and Doris Fisher. Further, it trades on the New York Stock Exchange with a ticker symbol of GPS. Currently, the company carries out its operations in six key segments, these are, Athleta, Piperlime, Banana Republic, Old Navy, and Intermix.
The brands comprise of Gap, GapBody, GapKids, BabyGap, and GapMaternity (Gap Inc. 2014b). The current number of employees stands at 140,000 across the world. Gap, Inc. has approximately 3,600 outlets across the world. About 3,200 of the total stores are located in Italy, Japan, China, France, the United States, Canada and the United Kingdom. Further, the company has more than 400 franchise stores located in regions such as Latin America, Africa, Middle East, Asia, Australia, and Eastern Europe.
Stock Performance and Value to Shareholders
The value of shareholders’ equity declined over the period. The decline can be attributed to a number of factors such as share repurchases. The decline was also caused by an increase in the balance of treasury stock from $9,069 million in 2009 to $14,245 million in 2013. The total cash dividend paid by the company rose gradually. The dividend per share also rose from $0.34 in 2009 to $0.70 in 2013.
The significant rise resulted from the decline in the total shareholder’s equity. Further, the earnings per share increased from $1.59 in 2009 to $2.78 in 2013. The return on equity increased from 23.76% in 2009 to 42.98% in 2013. Thus, it can be observed that the value to shareholders rose over the period. The chart for share prices reveals that there was a general rise in the prices of shares. However, between 2010 and 2011, there was a decline in the share prices. This can be attributed to the decline in performance reported during that period (Gap Inc. 2014b; Wasmer 2014).
Industry Overview and Competitive Positioning
As indicated above, Gap, Inc. operates in the apparel stores industry. It is a competitive subgroup of retail industry. The industry is comprised of large companies with strong brand names. In the industry, the number of stores opened by a company contributes significantly to the net sales and brand. Further, the profit margins generated by the companies depend on the pricing and discounting strategies (Kinney, Skaife, & William 2007).
High-end players such as Gap, Inc. gain from large profit margins. One major challenge experienced by the companies in the industry is the changing fashion. Another challenge is fluctuation in consumer income as a result of economic swings. Finally, brand positioning also plays a significant factor in the success of these companies (Head & Watson 2009). The companies have packaged their products into categories that appeal to the various market segments. Brand positioning also helps the company survive economic swings. The world’s apparel store industry is almost worth $ 1.3 trillion in 2014. Women’s ware accounted for more than 50% of the total market.
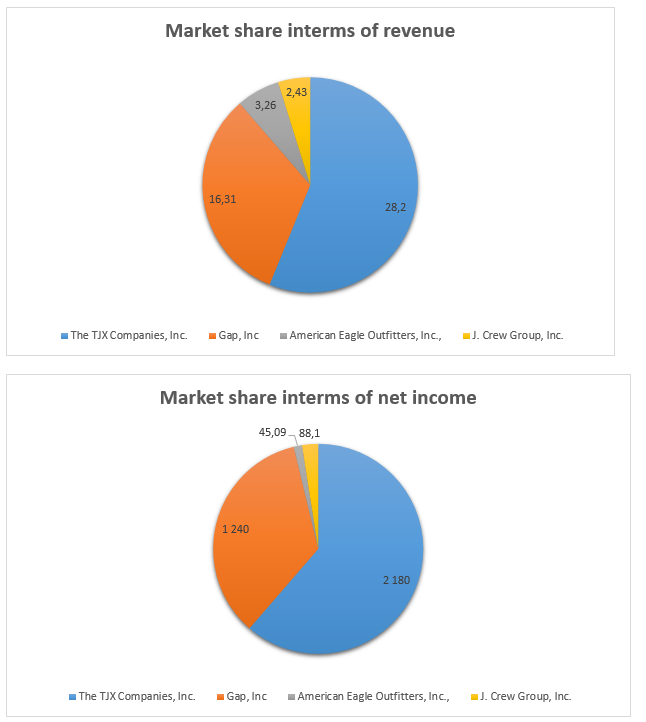
Further, the US market accounts for about 36% of the world market. Thus, the industry has a high potential of growth and profitability. Some of the competitors of Gap, Inc. are American Eagle Outfitters, Inc., J. Crew Group, Inc., and the TJX Companies, Inc. Out of these four companies, the TJX Companies, Inc. is the largest in terms of market capitalization and revenue. The table presented below shows the ranking of the four companies.
Investment Summary
The par value of the shares is $0.05. Currently, the shares are trading at $46.15. This implies that the value of shares of the company has increased tremendously. Further, the company pays a dividend of $0.88 per share while the dividend yield is 2.2%. The market capitalization of the company is worth 20.03 billion. The price-earning ratio is 17.67 while the earnings per share is 2.61. Gap, Inc. pays a higher dividend than its competitor the TJX Companies, Inc., the company. Also, the dividend yield for the company is higher than its competitors. However, the price-earnings ratio, earnings per share and market capitalization of the TJX Companies, Inc. is higher than that for Gap, Inc. Further, it can be noted that the beta (risk level) for Gap, Inc. (1.45) is higher than that for the TJX Companies, Inc. (0.6). Thus, it can be observed that the shares of the company perform well (Mayo 2007).
Valuation
Risks to Your Price Targets
There are a number of risks that may deter the company from achieving the price targets. First, is the risk that the changes in the global economic conditions will affect the consumption behaviour, thus impacting on the bottom line of the company. The second factor is competition from both local and foreign companies. The third factor is the inability to manage the inventory effectively. This might affect working capital and the entire operation of the company. Another risk is the inability of the various franchises to be successful. This will affect the projection adversely. Another risk is the changes in the credit rating and profile of the company. This may affect the ability of the company to access credit.
Differences Between Different Estimates
Relative valuation model
Projected values
EPS 2013 = 2.02
SPS 2013 = 9.50
CFPS2013 = 2.50
Benchmark values
Price / earnings = 22.15
Price / Sales = 4.53
Price/cash flow = 17.36
Computation of share prices
Expected price per share = 2.02 * 22.15 = 44.743
Expected price per share = 9.50 * 4.53 = 43.035
Expected price per share = 2.50 * 17.36 = 43.4
Residual income model
Po = Bo + (EPS1 – Bo * k) / (k – g)
The current book value of the shares Bo = $6.82
EPS1: The average growth rate of EPS for the past 10 years = 13.42%
Estimated EPS1 = 2.32 * 113.42% = $2.63
k = 14.5%
g = 13.41%
Po = 6.82 + (2.63 – 9.68 * 0.145) / (0.145 – 0.1341)
Po = 9.966358 / 0.0109
Po = $914.34
Dividend discount model (DDM): One-stage model
Po = Do (1 + g) / (k – g)
The recent annual dividends paid by the company (Do) amounted to $0.70.
Constant perpetual growth rate (g) = 15.47%
Required rate of return k = 14%
Po = 0.7 (1 + 0.1341) / (0.145 – 0.1341)
= 72.83
All the three approaches reveal that the intrinsic value is more than the market price of the shares. Thus, it gives potential investors a big boundary of safety (Atrill 2009; Graham 2014).
Financial Analysis
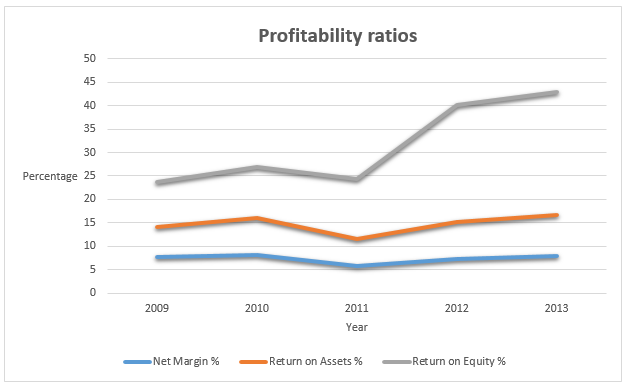
Earnings
The company reported an increase in earnings and profitability between 2009 and 2010. However, in 2011 there was a decline in the values. The company reported an increase in the values of ratios in the subsequent years (Morningstar 2014). The decline reported in 2011 can be attributed to the decline in sales as a result of downswings in economic conditions (Collier 2009). The graph presented below shows trend of earnings ratio.
Cash Flow
The cash flow generated by operating activities fluctuated during the period. The values ranged between $1,363million and $1938million. The values are positive which implies that the company is in a financial position to generate positive working capital (current assets – current liabilities) to support the operations of the business (SIFY 2008). The net cash flow used in investing activities also fluctuated during the period.
The cash flows as used to purchase investments. The net cash flows used in financing activities was significantly larger (Lys, Collins, & Badertscher 2007). The cash was used for share repurchase. Finally, the free cash flow was positive and it ranged from $ 815 million to $ 1,594 million during the period. It implies that the company has cash that can enable it invest in viable opportunities as they come along (Arnold 2008; Macabacus 2014).
Balance Sheet and Financing
The total assets declined over the period. This can be attributed to a decline in both total and current assets. The debt-to-equity ratio was 0.43 in 2012 and 0.45 in 2013. This shows that a significant proportion of the assets are financed by equity (Pike, Neale & Linsley 2012).
Calculation of Cost of Capital
Cost of debt = (risk free rate + default spread) (1 – t)
Risk free rate = 9%
Default spread = 0.4
Tax rate = 26% (corporate tax in the UK is 26%)
Substitute the Values
(9% + 0.4)0.26 = 6.956% = 7%
Cost of equity = risk-free rate + Beta * Risk premium
= 9% + 1.45 * 1.605% = 11.328%
The weighted average cost of the capital = cost of equity * proportion equity the capital structure + cost of debt * proportion debt in the capital structure.
= 11.33% * 38.78% + 7% * 61.22% = 8.68%
Investment Risk
Some of the investment risk that the company faces is fluctuation in interest rates especially when the company buys securities, or when it had debt instruments that have fixed rates in the books of account. Secondly, foreign exchange risk also affects the company because it operates in different countries. Also, business risk, especially in cost and supply management (Skinner & Kim 2010). Another risk is importation risk. It arises from the uncertainty that surrounds the delivery of goods that are bought from foreign countries. Finally, the company also faces the risk that the stores and franchises will not attain the expected results (Gap Inc. 2014a).
Reference List
Arnold, G 2008, Corporate financial management, Prentice Hall, Harlow.
Atrill, P. 2009, Financial management for decision makers, Financial Times Prentice Hall, Harlow.
Collier, P. 2009, Accounting for managers, John Wiley & Sons Ltd, London.
Gap Inc. 2014a, 2013 annual report. Web.
Gap Inc. 2014b, About – key facts. Web.
Gap Inc. 2014c, Investors. Web.
Graham, J 2014, The price to earnings ratio. Web.
Head, A & Watson, D 2009, Corporate finance: principles & practice, Prentice Hall, Harlow.
Kinney, J, Skaife, A, & William, C 2007, ‘The discovery and reporting of internal control deficiencies prior to S0X-mandated audits’, Journal of Accounting and Economics, vol. 44, no.1, pp. 166-192.
Lys, T, Collins, D, & Badertscher, B 2007, ‘Discretionary accounting choices and the predictive ability of accruals with respect to future cash flows’, Journal of Accounting and Economics, vol. 53, no.1, pp. 330-353.
Macabacus 2014, Discounted cash flow (DCF) analysis. Web.
Mayo, H 2007, Investments: An Introduction, Cengage Learning, USA.
Morningstar 2014, Gap Inc. – GPS. Web.
Pike, R, Neale, B, & Linsley, P. 2012, Corporate finance and investment: decision and strategies, Prentice Hall, London.
SIFY 2008, What is net asset value? Web.
Skinner, D & Kim, I 2010, ‘Measuring securities litigation risk’, Journal of Accounting and Economics, vol. 53, no. 2, pp. 290-310.
Wasmer, K 2014, Increasing shareholder value. Web.
Yahoo Finance 2014a, The Gap, Inc. (GPS). Web.
Yahoo Finance 2014b, The Gap, Inc. (GPS): historical share prices. Web.
Yahoo Finance 2014c, The Gap, Inc. (GPS): key statistics. Web.