The latest annual recap by the Home Office suggests that burglaries and violence around the nation may have at least held steady against the prior 2007/08 financial year, even shrunk slightly. Since the situation doubtless varies markedly across communities and over time, it is worthwhile investigating how the situation ‘on the ground’ in London and Greater Manchester differs.
A unitary database is essential for analyzing data even over a relatively short period of seven to ten years. The annual Home Office Statistical Bulletins may all be labelled ‘Crime in /England and Wales (financial year covered)’ but details given by local authority and by police force area vary from year to year. Even definitions of offences change over time, given the initiatives government has taken to reduce crime. Finally, the databases may cover offenses reported to police, reports elicited directly from citizens in the British Crime Survey series, or both in the same publication.
As it turns out, the most complete (and presumably consistent in the definition of terms) data series that breaks out the information by metropolitan area is within the Statistics sub-section of a Home Office Web page series dealing with crime reduction. However, the data series features 2002 as the starting year.
We chose to compare the incidence of “violence against persons” and “burglary” for this comparative analysis of the London Region and the Greater Manchester metropolitan area. Table 1 (below, page 5) shows crime incidence after pro-rating for population size and correcting the entries in the official database for both cities (the variable was labeled “Population in thousands” but the London data was in millions and pivot table tabulations on Greater Manchester kept yielding figures of less than 400,000 in absolute headcount).
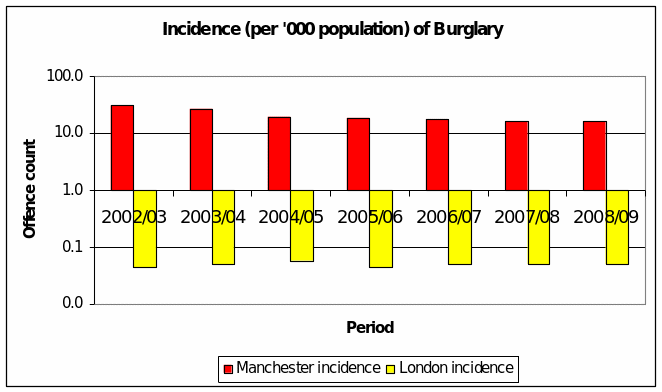
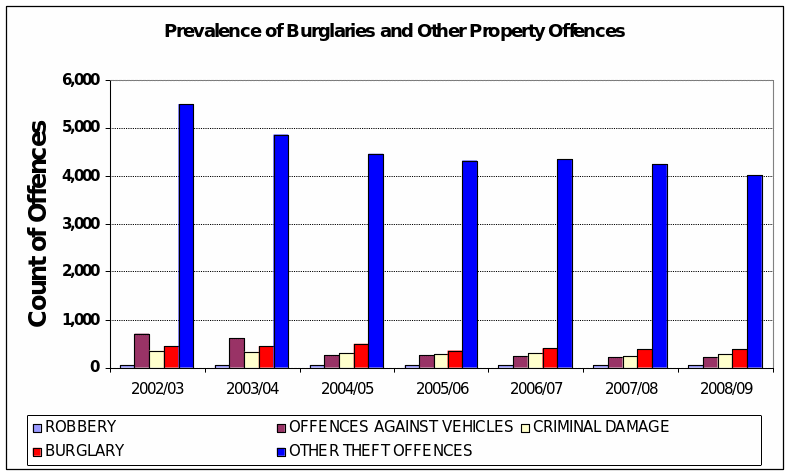
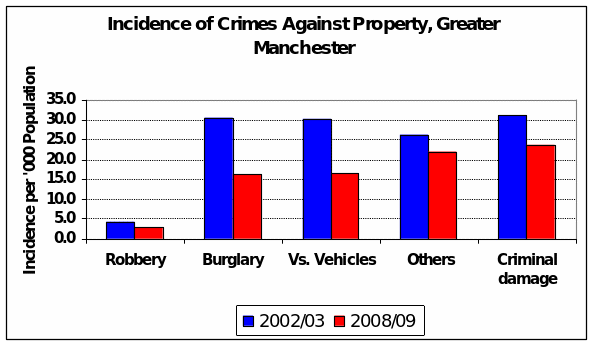
The required histogram for burglary (Figure 1 below) must be presented as a logarithmic scale because the (presumably) well-secured residences and commercial properties typical of London so depress incidence, it is far overshadowed by petty theft in the capital (in the hierarchy of crimes against property, see Figure 3 overleaf) and by the sheer prevalence of crimes against property in Greater Manchester (Figure 4).

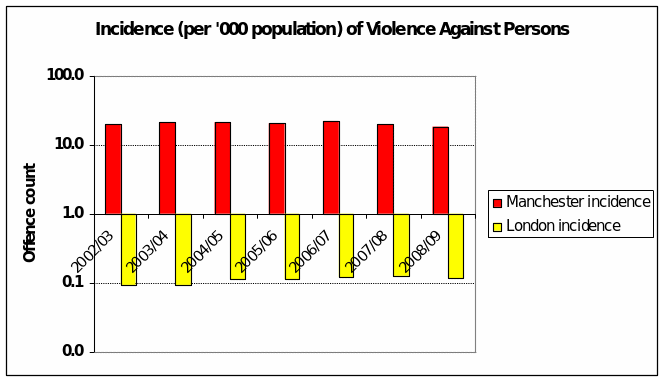
This is about the same picture that emerges when one compares incidence, adjusted for population size, of all offenceses involving violence against another. By comparison with boisterous Manchester, London is quiet as a graveyard.
Note that means for the incidence of both offense types are calculated and presented in Table 1. In this instance, the mean incidence of 20.6 burglaries in Manchester versus 0.5 per thousand Londoners over the seven-year span of time tells the reader that burglaries are 40 times more likely in the former city.

The means also show where the “mid-point” of the seven-year trend is for each index offense in the respective local areas. Thus, the average of 20.6 for burglaries in Manchester reflects the level sometime between the 2003/04 and 2004/05 financial years (from 1st April to 31st March the following year). One interpretation might be that the incidence of burglaries has been “below normal” in the five years since then.
For London, in contrast, the hundreds of burglaries that take place year after year is modulated somewhat by the finding that annual incidence fluctuates very closely around the mean of 0.5 per thousand residents. One burglary per 2,000 seems a stable rate that means, among other things, that burglary incidence will continue to drop as the population of the capital gradually shrinks in favour of other urban centres.
Table 1: Annual Incidence of Selected Crimes, 2002-2009
As to violence against persons, the distribution of annual prevalence and the mean of 0.11 in Table 1 above shows that the propensity of Londoners for domestic violence and sundry aggression may be essentially flat but it looks to have risen marginally in the last three years or so.
In Manchester, the incidence of violence against persons may have trended down lately but visual inspection of the secular trend reveals that progress towards more harmonious families and neighbourhoods is uneven.


The above analysis of just two offences in two areas and over a span of just seven years does not permit any meaningful use of the measures of central tendency and dispersion. More suitable, perhaps, is taking a cross-section of all 43 local authorities at a single point in time and finding out where London and Manchester stand versus other cities around the nation.
Recorded crime
Table 2: Recorded offences by offence group by police force area, English region and Wales, rates per 1,000 population, 2008/09
For the data array alongside, the measures of central location and dispersion are as follows:
The arithmetic mean – 15 violence-against-persons offences per 1,000 population (both resident and transient) – is the ‘typical value’ for all communities around England and Wales. This is a weighted average, raised or lowered by the number of police force areas or local authorities reporting offence frequencies close to, below or above the mean.
Clearly, this concededly brief analysis shows, Mancurians are at much higher risk of burglaries and violence to their persons than Londoners, at least where offences reported to the police are concerned. Paradoxically, however, the latest British Crime Survey reveals that reported violence against persons is at its worst in the capital. And, contrary to rosy reports that crime has generally trended downwards, the trend in both cities for violence against persons is decidedly mixed.
References
Dobbs, S. & Miller, J. Statistics 1 for OCR (Cambridge Advanced Level Mathematics), 2nd edn, Cambridge University Press, Cambridge, 2004.
Home Office, Crime in England and Wales (various years), Research, Development and Statistics Directorate, Crown Printing Office, London, 2010.
Home Office, Crime statistics, 2009, Web.
Research Development & Statistics, Notifiable offences recorded by the police, 2007/2008, Research, Development and Statistics Directorate, Crown Printing Office, London, 2009.