A massive volume of data needs to be specially handled in almost any organization when tapping value to be used in decision-making. This paper mainly explores how big data found in organizations should be used for it to be an essential input when making decisions (Sill 2016). The document explains how data should be handled within the shortest time possible to make real-time and clever decisions in an organization. It describes a personally derived framework that the top managers of America’s Community Bankers (ACB) in collaboration with their junior employees should implement when handling data to make decisions that will place the firm at an added competitive advantage.
Data Gap Analysis
Background
America’s Community Bankers is a community initiative representing the community banks’ grievances and saving institutions to the necessary authority. It was started in 1992 when the National Council of Community Bankers merged with the U.S. League of Savings institutions (America’s Community Bankers 2007). Initially, it was known as Savings and Community Bankers of America Community, but it later changed its name to America’s Community Bankers in 1995 (America’s Community Bankers 2007). It mainly operates in the community banks owned by American citizens. The primary issue that the organization has to deal with now is understanding the financial needs of the American residents and businesspeople in the areas where banks operate.
Data sources and datasets available for America’s Community Banker’s
Research Information Systems (RIS) which have many digital libraries is a significant data sources for America’s Community Bankers. It has software that enables data exchange through programs such as the ACM portal and Springer Link. Another source of data known as SOD simplifies the tasks of selecting tedious data and employs the seismology method of data selection (García et al. 2017). CALC is a dataset available for America’s Community Bankers, which allows the combination of data.
Table 1. Key financial and non-financial types of data in the case study
Data integrity and current of potential gaps in data analytics and data protection
Data integrity is a mandatory requirement for America’s Community Bankers for adherence to its ethical requirements. For any organization to ensure that it maintains its integrity and status, it must ensure it has the right business model for data protection and privacy. (Pullonen et al. 2019). They are required to respect the American bankers’ privacy and never use their information without their consent.
Organization Data Sources Business functions
Table 2. The identified gaps in data management
Recommendations to America’s Community Bankers’ data analytics processes
Reorganization of the current data-driven strategies to streamline and enhance the data analytics and decision-making.
The data analysis and decision-making can be enhanced by first defining the questions and ensuring that they are right. The organization should ensure that the questions are concise, clear, and measurable (Cleff 2021). The questions should be designed to provide high chances of finding the solutions within the shortest time possible. The organization should also come up with manipulated ways of analyzing and interpreting the data (Janssen et al. 2017). After analyzing the data, the results should be interpreted to answer the original questions and defend against all objections that may arise.
Table 3. Proposed data analytics
Roadmap to the development or enhancement of extensive data infrastructure
Firstly, the American Community Bankers should evaluate the nature and form in which the data exists and identify which elements they need to operate for their system to work perfectly. The organization should then carry out a diagnosis of the actions and the decisions they plan to make (Chen et al. 2021). The organization should evaluate whether the decisions and steps they are planning to make are effective and the barriers that might exist. The last step the organization should take is to strategize by identifying plans, actions, and new theories which they will adopt.
Table 4. Data analytics implementation process
Compliance aspects of the proposed changes in data analytics
The American Community Bankers should adopt data protection policies and maintain ethics when handling data for the organization to comply with the law. The organization should ensure that it has adhered to the regulations set up by the General Data Protection Regulation (GDPR).
Table 5. Data protection and ethical compliance
How the processed data can be used in the organizational decision-making
Table 6. Supported business decisions
For an organization to ensure that data management is effectively achieved, it can apply the operational strategy. This can be accomplished by coming up with ways to improve the skills of the employees and training new employees. This way, the company ensures that its traditional methods of data management are maintained and updated in accordance with technological advancements. By offering training, new employees’ skills in big data management are up to standard with the company requirements.
Executive Summary
Big data has become highly proliferated in the contemporary business environment. In the past, this information did not help organizations much. However, with technological advancement, and with the growth of online databases and information processing software, big data is now driving crucial decisions and innovation. Notably, a firm’s ability to utilize big data effectively to understand current trends and change operations depends on that company’s willingness to examine the existing data and use corporate performance management (CPM) software to organize, filter, analyze, and interpret the data, among other things (Pulakos, 2004; Corporate performance management, n.d.). CPM is essential in this regard because it is cheap, accurate, and customizable. In this paper, the author talks about the Independent Community Bankers of America’s use of data about commercial bank loans to American businesses and citizens to streamline its operations through effective decision-making. The article also provides a critical discussion of the confidence interval, Chi-square, and ANOVA as specific examples of inferential statistics that corporate organizations can use for decision making (Tabachnick and Fidell, 2007; Sharpe, 2015). The decision that the author chose pertains to the Independent Community Bankers of America’s business expansion. Since the outcomes show a positive trend in loan taking, the recommendation is that the company focuses on loan-related services to individual and institutional customers.
Data Preparation Process
For an organization to succeed in today’s fast-paced environment, it must make strategic decisions in a timely and efficient way. Leaders need reliable and actionable data to make these strategic decisions and inspire organizational growth and development (Nakagawa and Cuthill, 2007). Financial institutions have significant customer data, but most of them are not utilizing this information properly and to their advantage (Nick, 2007). Notably, the struggle that companies have to convert data into critical business leads lies in their inability to organize and prepare the existing data. Luckily, there is a variety of software tools on the market that companies can use to organize their data. Most of these pieces of software contain procedures for collecting, filtering and preparing datasets.
Notably, corporate performance management (CPM) is the umbrella term describing all pieces of software that companies can use to automate their business operations. Specifically, CPM automates such core business functions as budgeting and forecasting, thereby enabling organizations to execute strategic goals promptly (Integrated business intelligence and performance management: What you need to know, n.d.; Corporate performance management: A tool for formulating organizational strategies, n.d.). It allows companies to define and analyze strategic options before implementation to ensure that the recommended course of action agrees with company finances, business model, operational approaches, and key performance indicators. Any existing CPM software will help the user collect, filter, and prepare data for analysis (Corporate performance management, n.d.). CPM saves the company time and money by preventing employees from entering information manually and tracking it using less specialized software.
The continued utilization of CPM can reduce budgeting, analytics, forecasting, and planning time by 50 to 70 percent. It also reduces the time needed for data preparation, report production, and assessment of performance. Understanding descriptive statistics adds value to business processes and makes big data more meaningful to the company (Fisher and Marshall, 2009; Du Prel et al., 2009). Once the CPM software is up, no major changes will be needed to make it function. Instead, users will input daily figures during their usual working times, and the software will organize the data and generate graphs or reports whenever needed. Companies such as the Independent Community Bankers of America have information about banks and their clients. Using CPM, the company easily manipulates available data to see trends over the years and predict possible future performance.
Rapid consolidation of data is also possible within any organization that has integrated CPM into its operations. During the life of a company, specific changes that cause significant disruption of data may occur. However, with CPM, such transitions will be seamless, and the company will need only focus on delivering its promise to the customers and maintaining its bottom line. The powerful analytics of the enhanced CPM software promote and enhance data-driven decision-making, which was once a difficult and costly undertaking (Data modeling: Conceptual, logical, physical, data model types, n.d.; Data-driven decision-making: Succeed in the digital era, n.d). Companies in the past maintained disorganized data, and they hardly used it for business enhancement because no CPM that could simplify the job existed. Rather than spend a significant amount of time and resources cleaning historical data and analyzing them using less-sophisticated tools to see possible trends, these past companies preferred instead to use trial and error and to base their forward decisions on the CEO’s or top manager’s recommendations.
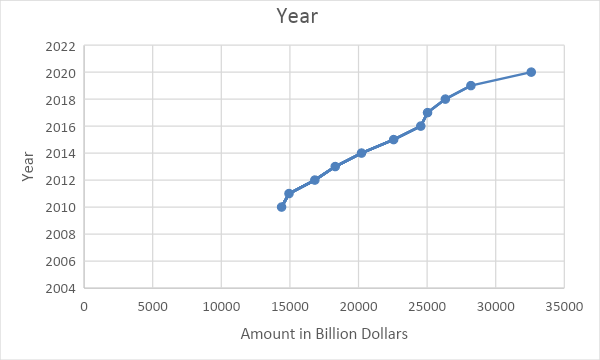
Big data has helped the Independent Community Bankers of America understand many important financial data in the United States. For example, the Independent Community Bankers of America know the amounts of business loans extended by American commercial banks to the public from as far back as the Great Depression of the 1930s. Its CPM has carefully and adequately organized this data such that one can see specific trends in how Americans have been borrowing loans over the years. The good thing about the arrangement of the data is that one can select any data points and examine them for a more effective case study. For example, a look at the data about business loans in the United States by month between 2010 and 2020 shows a general upward trend in the loans extended to the public as illustrated in Figure 1. With this graph, it is evident that more American people and companies are taking loans, and financial institutions could leverage the same data to improve performance.
The data is representative of the American population because it is drawn from all American commercial banks. Therefore, it includes all the information about all loans extended by American commercial banks to individuals and businesses throughout the United States. The main disadvantage of this data is that it does not show the specific individuals or groups that took the most loans. As such, it is difficult for a user to target specific loaners with good credit history. For that decision, one will need to access another dataset about individual creditworthiness. However, the data presented here is highly generalizable because it is derived from a large sample. Indeed, the sample from which the data is drawn is almost the same size as the population.
Data Modeling
Descriptive Statistics
Data is useful only when knowledgeable and skilled individuals analyze them and interpret the results meaningfully. One way that the Independent Community Bankers of America can convert its mere data about amounts of loans borrowed by American citizens and businesses is to perform a confidence interval. Doing so will help the company gain some insights into the probable loaning trends in the coming years (Marshall and Jonker, 2010; Larson, 2006). The confidence interval gives a clear picture of how much confidence there is in a given data. It is obtained by getting the mean and the standard deviation to determine the general characteristic of a given data set. Mathematically, the confidence interval CI is given by:

 is the sample mean,


The implication of the confidence interval is that American commercial banks could lend out 2716 billion dollars in the following months of 2021, plus or minus 141 billion dollars. The CI in this regard is the true mean, but there is a 5 percent chance that the upcoming loans would not fall within this range.
 ) it is:
 is the Chi-square test,


The expected loan amounts for 2021 are given by multiplying the category column total by the result of dividing the category row total by the total sample size. Since the category row and the total sample size are the same in this scenario, the expected loan amount is given by multiplying the category column total by one. As seen in Figure 4, the expected value for 2020 (based on the 2019 results) for January was 2328.1491. However, the observed value for that period was 2359.0658. Thus, Chi-square is given by subtracting the expected value from the observed value, squaring the result, and dividing it by the expected value. The statistic proves that some correlation exists between the 2019 and the 2020 monthly loan amounts extended by US commercial banks to individuals and organizations.
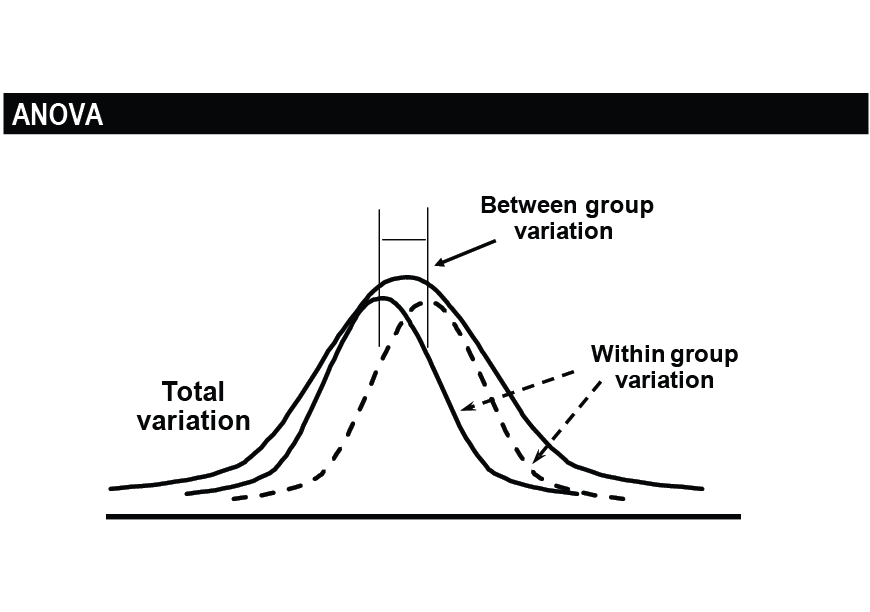
Lastly, the analysis of variance (ANOVA) is also an important inferential statistic that could be calculated from the Independent Community Bankers of America’s data about the amounts of loans that commercial banks have extended to Americans over the years. ANOVA is important in statistical analysis because it splits data into systematic and random factors (Rutherford, 2001; Blanca et al., 2018). Since it calculates the treatment levels’ means and examines their similarity to the overall mean, they provide crucial information about the statistical difference between them (Plonsky and Oswald, 2017; Breitsohl, 2019). Figures 5 and 6 below summarize the analysis of variance for the 2020 data about the loans offered by US commercial banks to individuals. Figure 5 is the ANOVA single factor while Figure 6 is the ANOVA two-factor without replication.


Since the f-value is significantly large in both the single and to-facto ANOVA, the variability between group means in the loan data between January and December 2020 is larger. Usually, the P-value indicates the strength of the evidence for or against the null hypothesis. If it is low, then strong evidence exists against the null hypothesis. However, this information was not captured in the analyzed data in the ANOVA because the author did not determine the null and the alternative hypotheses before examining the data.
Justification of the Inferential Statistical Model
The use of the confidence interval, Chi-square, and ANOVA is justified by their significance in the study. It is difficult or impossible to do a statistical comparison without looking at what some of these inferential statistics provide. In big data analysis, knowledge of all the important inferential statistics ensures that one makes the right decision based on the available data (Mishra et al., 2019) In less-big data sets such as the one provided in this case study, the study of the confidence interval provides an illustration of the spread of the values making it easy for the user to approximate the range of the results and the likelihood that a given value will fall within the desired range. it helps with predicting future values in forecast scenarios. The Chi-square, on the other hand, provides information about the relationship between categorical variables. It is one of the most important inferential statistics for testing or formulating a hypothesis (Kaur, Stoltzfus, and Yellapu, 2018). It shows the relationship between the different statistical values included in a given dataset. Lastly, the analysis of variance (ANOVA) examines how the dataset variables, including the dependent and the independent ones, relate to each other (Faraway, 2002). In this examination, the provided dataset shows that critical decisions are possible if the corporation understands the meaning of its big data or how it is changing. The Independent Community Bankers of America can use its data to determine better ways of extending loans and making profits from its huge data. Table 6 summarizes the information.
Table 6. Comparison of different inferential statistical models
Initial Outcomes of the Inferential Analysis
The initial outcomes of the inferential analysis show that the Independent Community Bankers of America can use the data in its proposal about the amounts of loans extended to American people and businesses by American commercial banks to organize its services and benefit from it. For example, the trends prove that the amount of loans that American people and businesses have been taking over the years has increased significantly, and will continue to do so in the coming years. Therefore, theoretically, companies offering financial services like loans are likely to continue enjoying a good business well into the future (Asadoorian and Kantarelis, 2005; Big data: How could it improve decision making within your company? 2017). The only uncertainty that currently exists is that there is no confirmation about the most effective or reliable lender out there. That information could only be obtained from other datasets existing on the market.
Data used in this presentation proves that Americans will continue to take loans, even though it does not specify the preferred amounts or the people more likely to do so. Thankfully, because the data is highly representative, it is greatly generalizable back to the population from which it is drawn (Allua and Thompson, 2009; Amrhein, Trafimow, and Greenland, 2019). The generalisability of the data means that the information applies to almost all Americans, but in slightly different ways. Therefore, it is the responsibility of the user of the data to determine how well and how best to apply the information to get the maximum benefit from it. For example, although the data proves that Americans have been taking an increasing amount of loans yearly, it does not specify which Americans offer the least likely risks due to timely repayments. Thus, the company will need to examine individual loan applicants critically before approving any payments to them.
Further Visualisation and Interpretation of Results as Expected in Business Reporting
Further visualization of the data is possible depending on the user’s needs. It can happen through tabulation, diagram formation, and graphs to provide the most accurate representation of the data. Agreeably, the visualization of the statistical data is an important component of understanding big data and making sense of it. It simplifies the information and summarizes it for easy consumption and decision-making. Most importantly, visualized data are easy to consume and interesting to utilize. The data used in this example do not provide all possible scenarios for the application of big data in decision-making. However, they provide important consideration for the application of the same in business (Data-driven decision-making: A primer for beginners, n.d). With the utilization of big data, businesses these days increase the chances of success and continue to grow and expand. Data-driven decisions are also more accurate and help companies to, among other things, offer specialized services and run appropriate campaigns for each group of customers.
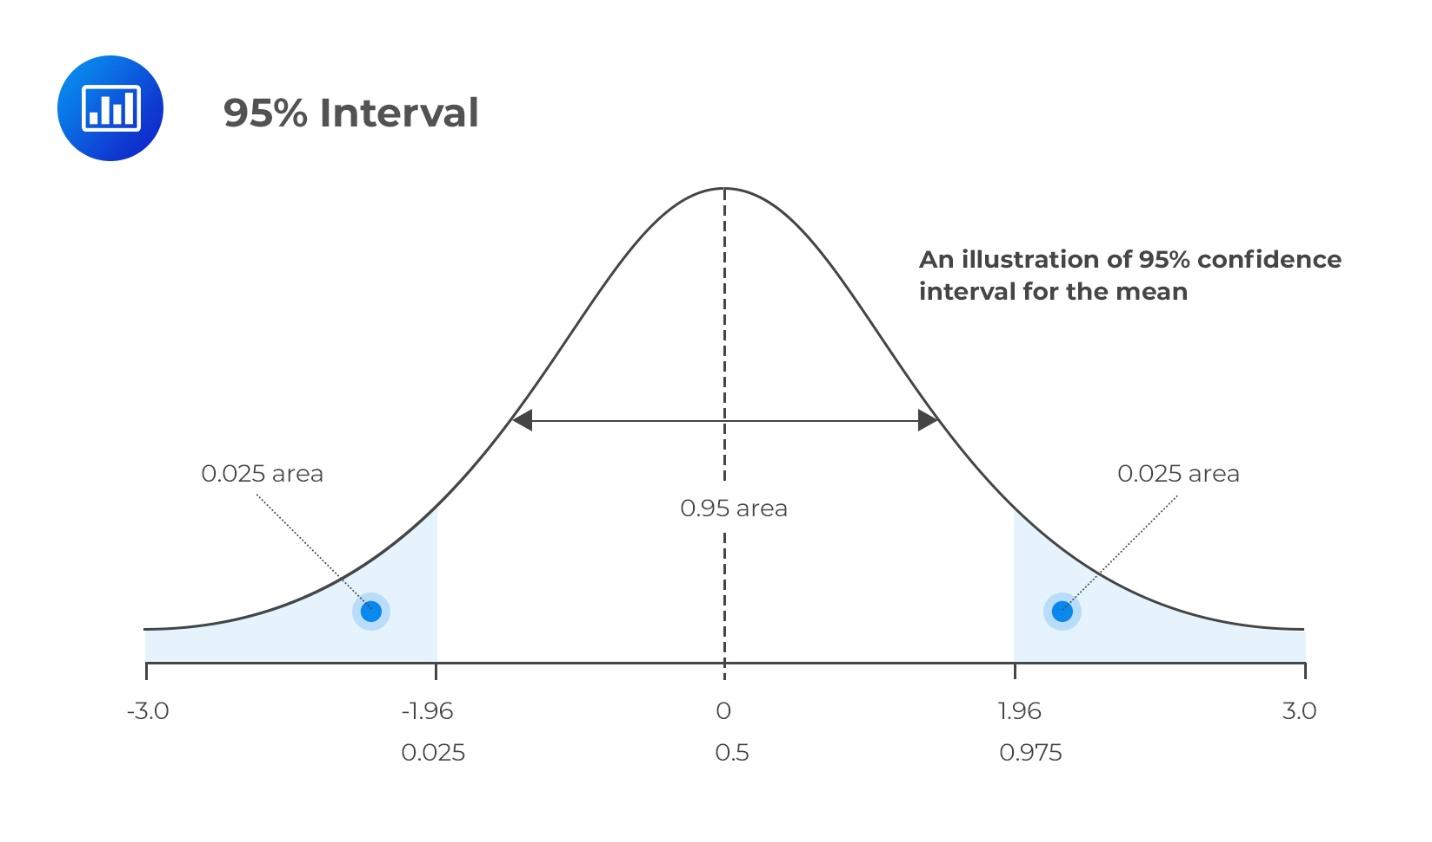
As noted earlier, the confidence interval lets the business data user approximate the tendency or characteristics of future data based on current ones. It is needed and important in predicting future trends. As shown in Figure 7, a 95 percent confidence interval shows the area within which future data is likely to lie, with only a 5 percent chance that it will not be in that area. For example, the data shows that the American commercial banks are likely to loan out 2716 billion dollars in the next month of 2021 based on historical performance, plus or minus 141 billion dollars. It is the true mean of the data, with only a five percent chance that it is not true.
The implication of the confidence interval is that American commercial banks could lend out 2716 billion dollars in the following months of 2021, plus or minus 141 billion dollars. The CI in this regard is the true mean, but there is a 5 percent chance that the upcoming loans would not fall within this range.
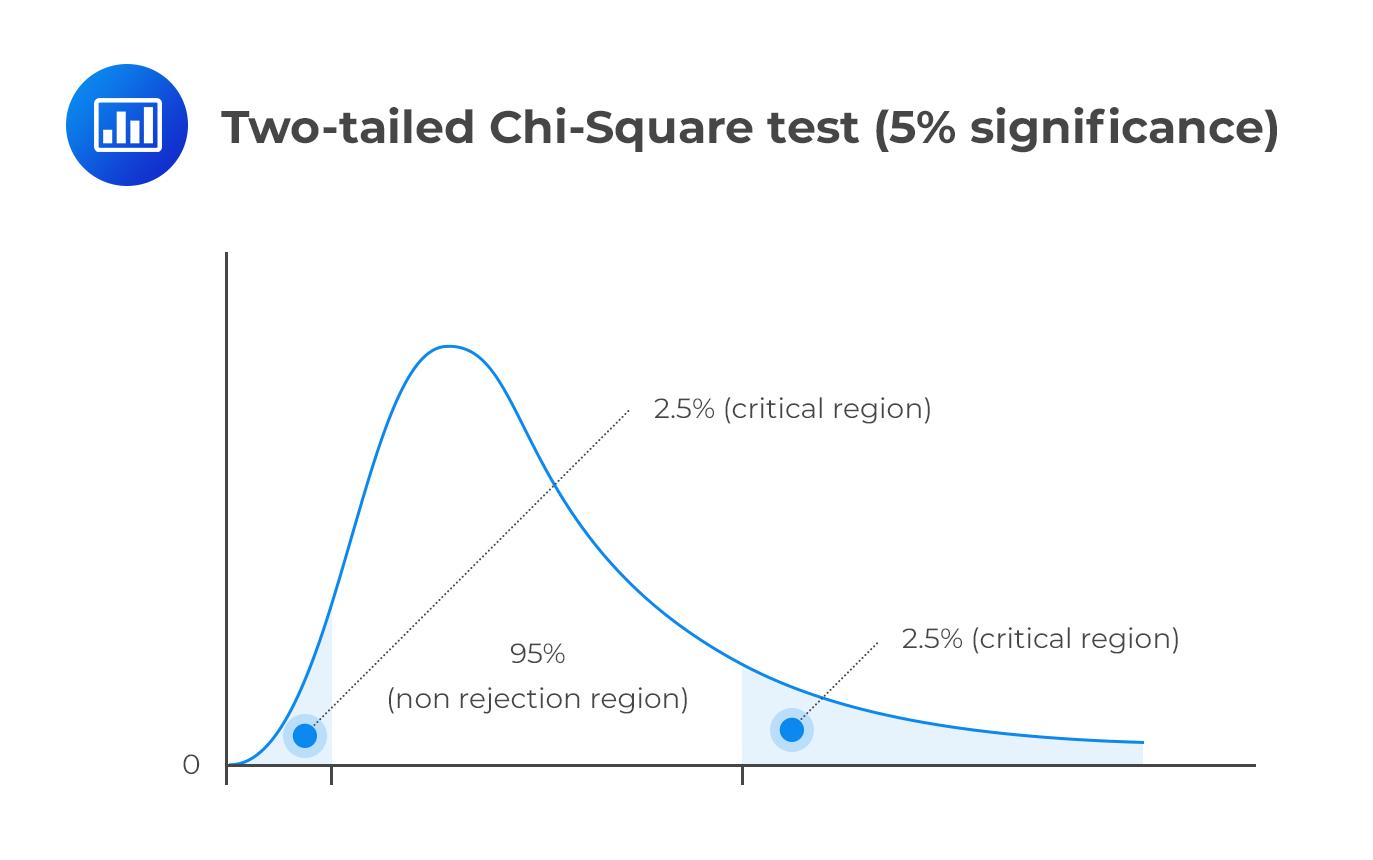
As shown in Figure 8, The Chi-square test also offers comparable information to the confidence interval. It shows the similarities and differences between the expected and the observed values, thereby depicting a more accurate relationship between variables. The Chi-square test is particularly important in forming and testing hypotheses. Therefore, it encourages users to visually analyze data and make hypotheses that could lead to critical business decisions. Notably, statisticians sometimes suspect the existence of a relationship between different variables. By creating null and alternative hypotheses, and generating the Chi-square values, they can determine if their suspicions are true or false.
Lastly, the analysis of variance offers a more critical examination of differences between variables. It is also useful in testing or formulating hypotheses. The data included in this exercise provides sufficient details of the utilization of ANOVA in decision-making. As shown in Figure 9, the statistic shows variations between and within groups. The data differences in these groups and outside can provide critical insight into how future statistics based on the same information could appear. Based on the data about commercial loans extended to Americans, it is evident that the amounts will continue to rise in the future, with less significant changes happening between and within groups. For instance, it is expected that the number of monthly loans extended to Americans will continue to rise, translating into even more annual loans for them. Businesses that offer services in loans can use this information to prepare themselves adequately and position themselves better to benefit from these changes. What matters is the ability to understand trends and move efficiently and effectively with them, rather than trying to change or stop them.
Recommendations for the Decision-Making Process
Table 7. Decision recommendation
Specific actions that the company can take to provide customers with even better information about loans include investing in a reliable CPM. Its acceptance by stakeholders can be achieved through extensive training and product popularization. Although people tend to resist change, telling them that adopting to current industry practices is the easiest way of remaining competitive and achieving growth. CPM will help the company to utilize even broader data more effectively leading to success. Extra data sources that could further augment the decision-making process is primary research, which entails asking customers questions directly to understand their opinions and expectations on various issues. Notably, the effectiveness of the applied analytical model depends on the quality of the data used and the analyst’s ability to make accurate and reliable predictions. Thus, the study assumes that the data presented concerning business loans that commercial banks have extended to customers are accurate. In the future, better outcomes can be achieved by confirming the effectiveness and reliability of the data. One can often do this by looking at the data sources and their past treatment, including storage and manipulation.
References List
Amrhein, V., Trafimow, D., and Greenland, S. (2019) ‘Inferential statistics as descriptive statistics: There is no replication crisis if we don’t expect replication’, The American Statistician, 73(1), 262-270.
Allua, S., and Thompson, C. B. (2009) ‘Inferential statistics’, Air Medical Journal, 28(4), 168-171.
America’s Community Bankers, 2007. America’s Community Bankers: Celebrating 115 Years of Leadership 1892-2007. Washington DC: America’s Community Bankers.
Asadoorian, M. O., and Kantarelis, D. (2005) Essentials of inferential statistics. Lanham, Maryland: University Press of America.
Blanca, M. J. et al. (2018) ‘Effect of variance ratio on ANOVA robustness: might 1.5 be the limit?’, Behavior Research Methods, 50(3), 937-962.
Big data: How could it improve decision-making within your company? (2017) Web.
Breitsohl, H. (2019) ‘Beyond ANOVA: an introduction to structural equation models for experimental designs’, Organizational Research Methods, 22(3), 649-677.
Bonett, D. G. (2006) ‘Confidence interval for a coefficient of quartile variation’, Computational statistics & data analysis, 50(11), 2953-2957.
Chen, S., Liu, J., Xu, Y. (2021) ‘A logical reasoning based decision-making method for handling qualitative knowledge,’ International Journal of Approximate Reasoning, 129, 49-63.
Cleff, T. (2021) Applied statistics and multivariate data analysis for business and economics. 1st edition. Cham: Springer.
Corporate performance management (n.d.) Web.
Corporate performance management: A tool for formulating organizational strategies (n.d.) Web.
Data-driven decision-making: A primer for beginners (n.d) Web.
Data-driven decision-making: Succeed in the digital era (n.d.) Web.
Data modelling: Conceptual, logical, physical, data model types (n.d.) Web.
Du Prel, J. B. et al. (2009) ‘Confidence interval or p-value? Part 4 of a series on evaluation of scientific publications’, Deutsches Ärzteblatt International, 106(19), 335-349.
Faraway, J. J. (2002) Practical regression and ANOVA using R. Bath: University of Bath Press.
Fisher, M. J., and Marshall, A. P. (2009) ‘Understanding descriptive statistics’, Australian Critical Care, 22(2), 93-97.
Franke, T. M., Ho, T., and Christie, C. A. (2012) ‘The chi-square test: often used and more often misinterpreted’, American Journal of Evaluation, 33(3), 448-458.
García, D., Nebot, A., and Vellido, A. (2017) ‘Intelligent data analysis approaches to churn as a business problem: a survey,’ Knowledge and Information Systems, 51, 719-774.
Hazra, A. (2017) ‘Using the confidence interval confidently’, Journal of thoracic disease, 9(10), 4125-4136.
Integrated business intelligence and performance management: What you need to know (n.d.) Web.
Janssen, M., van der Voort, H., and Wahyudi, A. (2017) ‘Factors influencing big data decision-making quality,’ Journal of Business Research, 70, 338-345.
Jin, D. and Kim, H. (2018) ‘Integrated understanding of big data, big data analysis, and business intelligence: a case study of logistics. Sustainability, 10(10), 3778.
Kaur, P., Stoltzfus, J., and Yellapu, V. (2018) ‘Descriptive statistics’, International Journal of Academic Medicine, 4(1), 60-71.
Larson, M. G. (2006) ‘Descriptive statistics and graphical displays’, Circulation, 114(1), 76-81.
Marshall, G., and Jonker, L. (2010) ‘An introduction to descriptive statistics: a review and practical guide’, Radiography, 16(4), e1-e7.
McHugh, M. L. (2013) ‘The chi-square test of independence’, Biochemia Medica, 23(2), 143-149.
Mishra et al. (2019) ‘Descriptive statistics and normality tests for statistical data’, Annals of cardiac anesthesia, 22(1), 67-83.
Nakagawa, S., and Cuthill, I. C. (2007) ‘Effect size, confidence interval and statistical significance: a practical guide for biologists’, Biological Reviews, 82(4), 591-605.
Nick, T. G. (2007) ‘Descriptive statistics’, Topics in biostatistics, 10(2), 33-52.
Plonsky, L., and Oswald, F. L. (2017) ‘Multiple regression as a flexible alternative to ANOVA in L2 research’, Studies in Second Language Acquisition, 39(3), 579-592.
Pulakos, E. D. (2004) Performance management: a roadmap for developing, implementing and evaluating performance management systems. Alexandria, VA: SHRM Foundation.
Pullonen, P. et al. (2019) ‘Privacy-enhanced BPMN: enabling data privacy analysis in business processes models,’ Software and Systems Modelling, 18, 3235-3264.
Rutherford, A. (2001) Introducing ANOVA and ANCOVA: a GLM approach. London: Sage.
Satorra, A., and Bentler, P. M. (2010) ‘Ensuring positiveness of the scaled difference chi-square test statistic’, Psychometrika, 75(2), 243-248.
Shamim, S. et al. (2019) ‘Role of big data management in enhancing big data decision-making capability and quality among Chinese firms: a dynamic capabilities view,’ Information & Management, 56(6), 103135.
Sharpe, D. (2015) ‘Chi-square test is statistically significant: now what?’, Practical Assessment, Research, and Evaluation, 20(1), 8-12.
Shi, W. et al. (2021) ‘Handling uncertainty in financial decision making: a clustering estimation of distribution algorithm with simplified simulation. IEEE Transactions on Emerging Topics in Computational Intelligence, 5(1), 42-56.
Sill, A. (2016) ‘Cloud, Data, and Business Process Standards for Manufacturing,’ IEEE Cloud Cmputing, 3(4), 74-80.
Tabachnick, B. G., and Fidell, L. S. (2007) Experimental designs using ANOVA. Belmont, CA: Thomson Brooks Cole Publishers.