A survey was performed to determine the demographic characteristics of the infected population. This survey involved 969 participants with a mean age of 29.06 years (SD=9.33). The youngest participant was aged 1 year, while the oldest was 72 years old. Most (63.8%) of the participants were female, while the rest were male. The study corrected data on the patients’ age, gender, month and year of onset, and the month and year that the sickness was reported. A comprehensive analysis of the dataset shows that the disease was more prevalent among the old population.
Demographic Characteristic of Infected Persons
As indicated, the disease was more prevalent among women. Figure 1 shows the gender composition of the infected subjects.
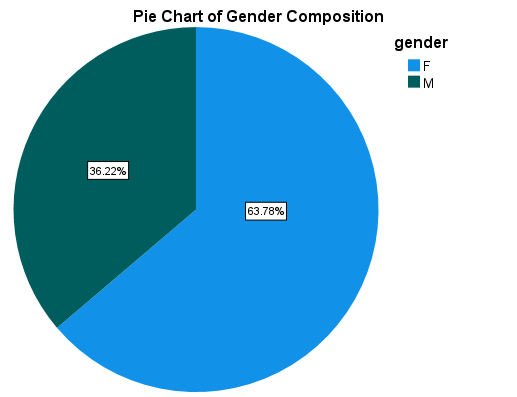
The mean age of female patients was slightly lower than that of their male counterparts. Specifically, the average age of women subjects was 28.87 years (SD=9.29), while that of men was 29.28 years (SD=9.41). Table 1 shows the summary descriptive statistics for the infected population.
Table 1: Summary Descriptive Statistics for Age by Gender
The age distribution had a positive skew. Therefore, most of the patients were younger than the average age. Figure 2 shows a histogram of the affected population.
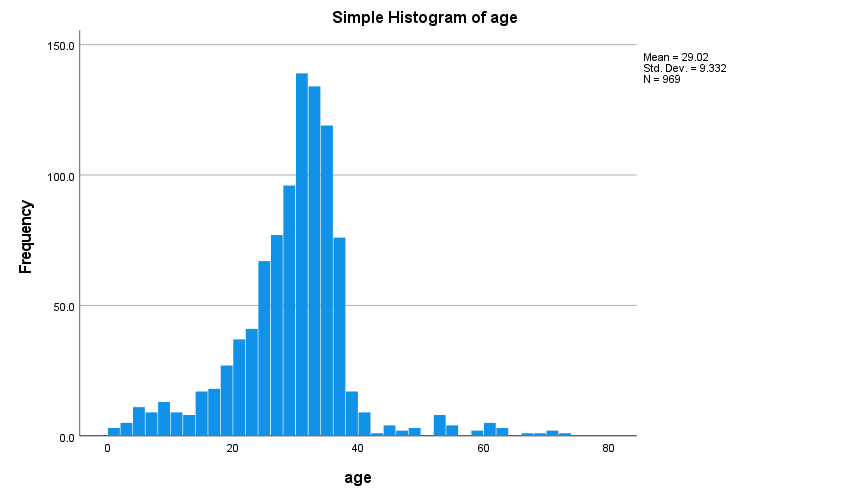
From Figure 1, it is clear that the majority of the affected population ranged from 20-40 years. Only a few patients had more than 60 years. Therefore, the disease has a disproportionate impact on the working-age population.
The disease was most prevalent among the White Non-Hispanic population. Figure 3 shows a graph of the ethnic distribution of the surveyed respondents.
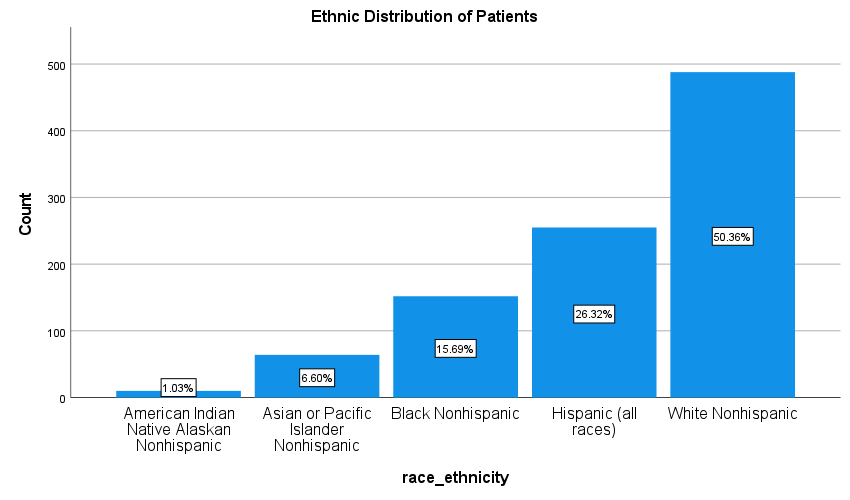
Figure 3 shows that slightly more than half of the patients belonged to the White Non-Hispanic racial group. In addition, only a minority (1.03%) of the patients were Native Americans. This distribution mirrored the composition of the national population.
Despite the large difference in disease prevalence by ethnicity, the mean age of the patients did not differ significantly based on their racial background. Figure 4 shows the average age of the patients by gender.
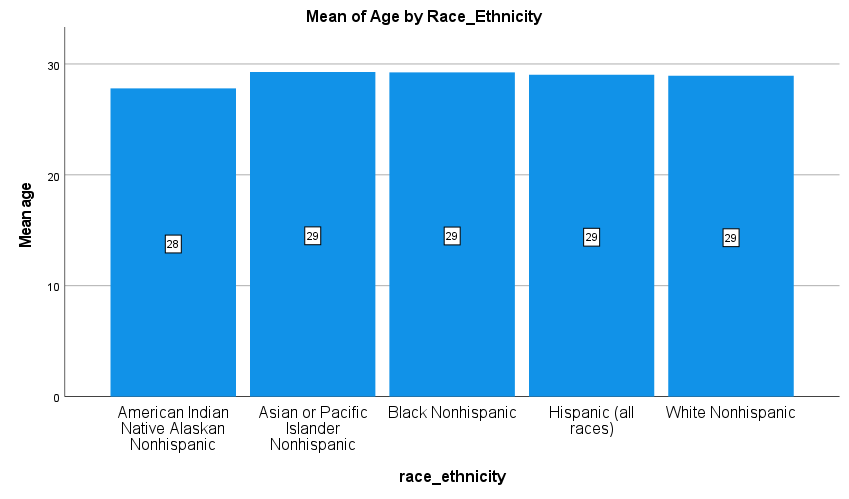
While the prevalence rate was higher among the White Non-Hispanics, the average age of patients was equal for all racial groups. Consequently, the patients’ age did not have significant difference based on their ethnic extraction.
In summary, the disease is most prevalent among women. In addition, White Non-Hispanics are more predisposed to the ailment compared to other racial groups. Moreover, the disease affects the working-age population aged 20-40 years more than any other group. Therefore, this information should be used to develop interventions to curb the further spread of the disease.
Trends over Time
Cases of this disease were more common in the summer months (May to August). Table 2 shows the frequency distribution of the months that most patients were diagnosed with the disease.
Table 2: Frequency Distribution of Onset Month
The cases peaked during the month of July before declining steadily. A simple line graph illustrates the general trend of disease in the course of a year (see Figure 5).
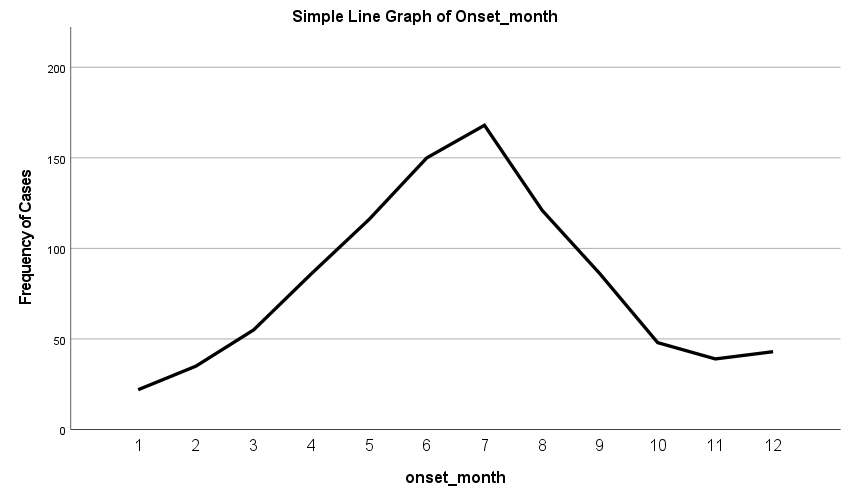
From Figure 5, it is clear that the region experienced a surge in cases starting from May before subsiding in September. Therefore, stakeholders in the health sector should roll out preventive measures before the onset of the surge, which is around April of every year.
The infection rates declined over the last three years to 2020. Table 3 shows the distribution of cases in each year starting from the year 2016.
Table 3: Distribution of Cases by Year
The infection rates peaked in 2018 when 282 patients caught the disease. However, the infection rates declined steadily thereafter to the lowest levels in the period (see Figure 6).
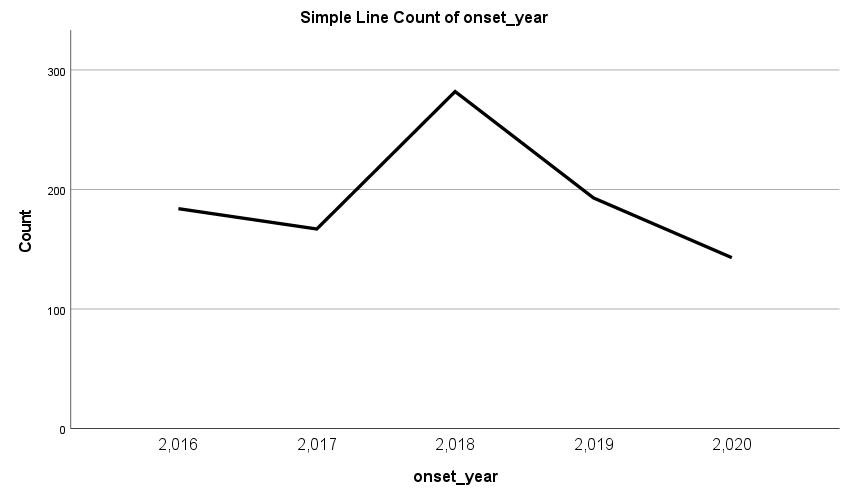
Based on Figure 6, the clear declining trend after the year 2018 could have been caused by the prevention efforts undertaken after the rise in infection rate in the previous years.
The monthly rate of infection had a close correlation with the cases reported in the health care institutions. Table 4 shows the distribution of the cases reported each month per year.
Table 4: Distribution of reported cases by month
Table 4 shows that the frequency of cases reported in started increased steadily after the fourth month. This trend continued until August, when the reported cases declined. Figure 7 shows the general trend of total reported cases each month.
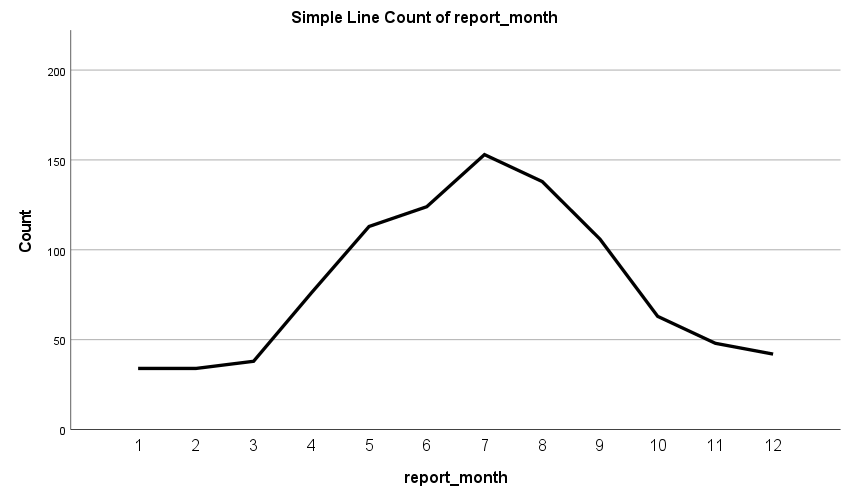
Figure 7 shows that the distribution of reported cases mirrors that of the number of infections, as illustrated in Figure 5. Therefore, most patients did not take long to report cases of infection after suspecting an infection.
The number of cases reported per year increased in 2018 but declined thereafter. As seen in Figure 8, the trend was similar to the infection rate depicted in Figure 6.
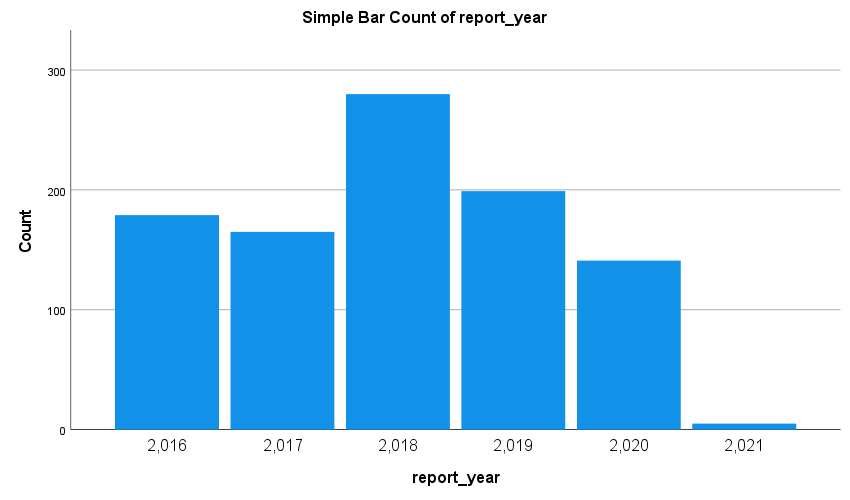
The close similarity between the number of infections and the number of reported cases indicates that most patients reported the disease incidence immediately after its onset. Therefore, most patients sought medical attention well before the symptoms became severe. As a result, the rate of infection declined soon after reaching its peak. Consequently, the medical personnel should continue the timely intervention to reduce the prevalence rate.