Introduction
Digital marketing requires precision in messages that need to be conveyed and statistics that are used as a basis for any corrections to the chosen strategy. Available data may overwhelm marketing managers, who consider irrelevant factors that adversely affect their decisions (Kingsnorth, 2019). Google Merchandise Store makes it possible to perceive a variety of statistics regarding its website’s visitors, each of which must be assessed carefully before creating a feasible marketing plan.
Analysis
Social media is a common path for firms to engage their customers. Social media page engagement, including posts regarding a company’s products or services, content, and view statistics, allows businesses to comprehend what interests their customers the most (Cao et al., 2020). In the case of Google’s store, there is a deficiency in user endorsement of its products, as most posts on Twitter contain irrelevant data that does not lead to any sales.
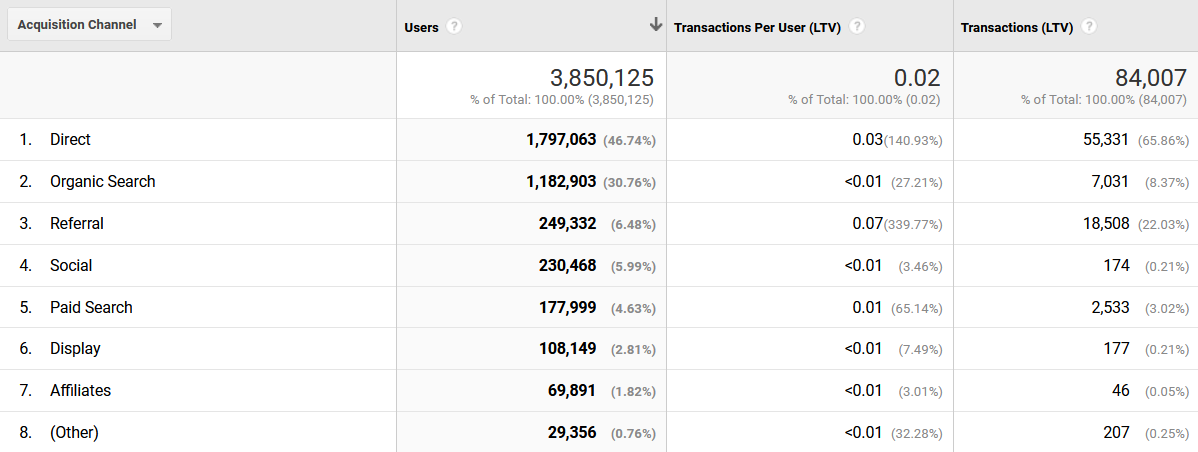
It is possible that Google does not use this social media platform as a means of promotion, as the average likes-per-tweet ratio was 2.65 in 2022. It is vital to understand that the conversion rate of Google Merchandise Store, as seen in Figure 1, reveals that a small percentage of visitors intend to purchase. With only 0.02 transactions per user, the firm fails to capture its visitors’ attention.
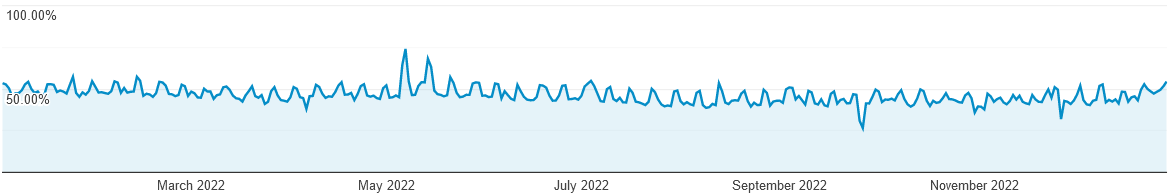
The website’s design is solid and allows the firm to retain a significant portion of visitors past the landing page. However, it does not perform better than other e-commerce platforms. As seen in Figure 2, Google Merchandise Store has an average bounce rate of 45.51%, slightly above the industry average of 43% (Chaudhary & Chowdhury, 2019). This notion indicates that further improvements to the store’s design and navigation can lead to better results.
Recommendations
Google Merchandise Store has to consider a shift in its marketing strategy. Its transaction rate, especially from social media visitors, is subpar, and user engagement on Twitter is low. A low lead-to-customer conversion rate indicates a misuse of marketing channels that drive traffic to the store. Depending on the marketing channel, this parameter can be improved via targeted advertising, high user engagement, and leveraging a company’s points of sale (Cao et al., 2020). For example, Google can encourage its customers to express their sentiments toward the products through Twitter or Facebook.
Creating an online community that actively discusses the firm’s apparel or souvenirs can create an additional appeal for others to visit the store. Another possible change is related to the website’s landing page, which needs to direct visitors toward goods that interest them more. For example, the main page may take a user’s data to adjust to show the content they may find more engaging than the default store page.
Conclusion
In conclusion, Google Merchandise Store is currently stagnating due to the lack of marketing efforts. The firm does not engage its users actively and is rarely mentioned on social media. Simultaneously, 45% of visitors leave the website after opening it. It is possible to improve this parameter by changing the store’s landing page to take users’ preferences into consideration. Moreover, encouraging the existing customer base to leave reviews online can assist with creating an online community that will promote Google’s merchandise on social media.
References
Audience overview. (n.d.). Google Analytics. Web.
Cao, T., Wang, S., Qiao, C., & Kotler, M. (2020). Marketing strategy in the digital age: Applying Kotler’s strategies to digital marketing. World Scientific.
Chaudhary, N., & Chowdhury, D. R. (2019). Data preprocessing for evaluation of recommendation models in e-commerce. Data, 4(1). Web.
Kingsnorth, S. (2019). Digital marketing strategy: An integrated approach to online marketing (2nd ed.). Kogan Page Publishers.
Lifetime value. (n.d.). Google Analytics. Web.