Summary
The main goal of the Google Merchandise Store, an e-commerce site, is to increase the revenue and profitability of Alphabet Inc., Google’s parent company. Through the analysis of Google Merchandise Store data (March 2020-February 2021) obtained using Google Analytics (Google, 2021b), a number of objectives were identified that needed to be achieved in order for this overall goal to be met. Since the data depict traffic to the site and user patterns, low-performance areas identified in this report should be prioritized to secure maximum returns.
Objectives
Since the primary goal is to increase revenue and profitability, it will be sensible to determine the associations between the revenue figures of Google Merchandise Store and the other variables available in the Google analytics dataset (Ahmed et al., 2017). The independent variables represent key performance indicators (KPIs) for sales and marketing strongly correlated with revenue (Hung et al., 2020). In order to determine the impact of each KPI on monthly revenue, regression analysis was performed.
A regression test (with monthly Revenue as the dependent variable) provided the values listed in Table 1 below:
Based on the significance values, only the first six independent variables significantly impact revenue. From the data, we observe that three underperforming areas of the website, which include cart abandonment rate, average order size, and new visitors to the site, must be prioritized to enhance revenue generation (Google, 2021a). These KPIs will help minimize drop-offs, increase sales volume, and generate more traffic that will likely increase conversions. The SMART objectives proposed and their rationales are explained below.
Objective 1 – Reduce cart abandonment rate by 10% over the next 6 months amongst 18 to 24-year-olds
The Cart abandonment rate is an indicator of unfavorable checkout behavior and uncompleted transactions impacting Google Merchandise Store’s revenue. It represents the proportion of users who initiate a conversion process (add to basket) but fail to make a purchase (Akhtar, 2020). This objective will correct the factors causing users to abandon shopping carts, which include unanticipated costs (shipping and other fees), order totals not available upfront, and payment options not functioning. These errors will be fixed over a six-month period to optimize monthly sales and revenue. To realize this objective, the demographic with a lower conversion rate (visitors aged 18-24 years) will be targeted.
Objective 2 – Increase average order size by 20% over the next 12 months amongst 18 to 24-year-olds
From Google Analytics data, the average value of each transaction significantly impacts revenue. It indicates that customers are not enticed to spend more when buying (Koks, 2017). A low average order size or value (AOV) is likely the result of a drop in conversion rate. Therefore, factors that affect conversions, including problems with the checkout process, will be addressed to improve revenue per visitor. It may well be that lower AOV is the result of buyers from all traffic sources being keen on purchasing a particular item as opposed to shopping around. Using February 2021 AOV as the baseline, targeted email, social media, and search marketing will be optimized for better returns.
Objective 3 – Increase new visitors to the site by 30% over the next 6 months amongst 18 to 24-year-olds
Traffic to the website is key to enhancing revenue generation. Analyzing organic and paid searches, referrals, and direct visits will give the category used by most visitors. Google Merchandise Store is mostly frequented using organic results, implying that a majority of users come via unpaid search (Cheng, 2020). Thus, the visitors have a particular need, and if a satisfying solution is provided, it is plausible that they will convert. Optimizing keywords and following up referrals to enhance exposure are some of the ways new visitors to the site will be increased. These measures will help reduce bounce rates and improve user volume.
Data Analysis and Interpretation
Cart Abandonment Rate
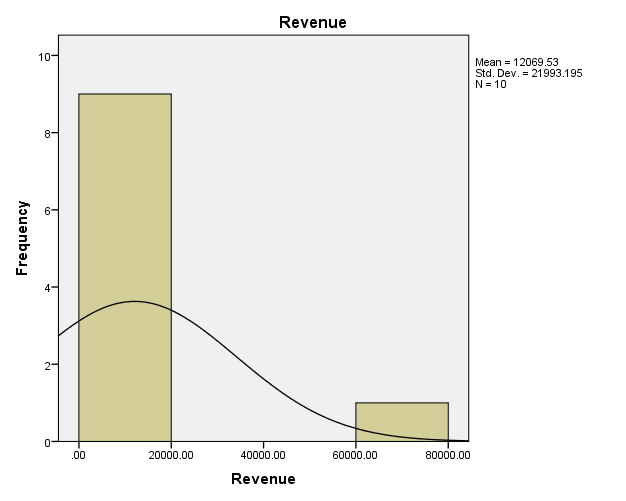
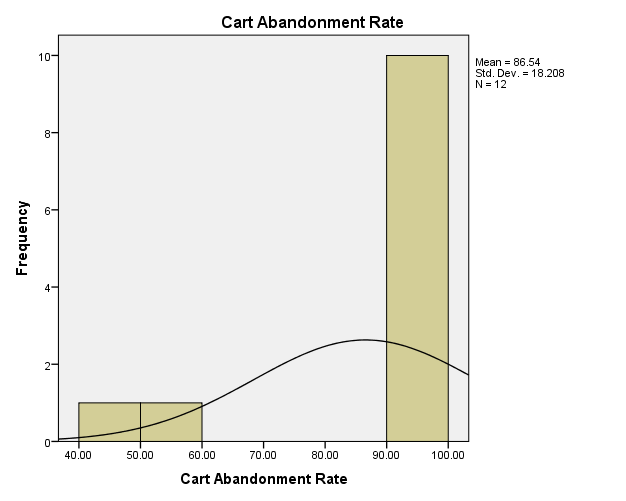
On average, 90.30% (SD = 13.47) of buyers leave their carts without completing the purchase. Over the 12-month period, the highest abandonment was recorded in April 2020 (CAR = 98.29) and the lowest was in January 2021 (CAR = 52.51). The frequency distribution shows that the abandonment rate is right-skewed, as uncompleted sales were recorded in most months (Figure 1a). Revenue collected was skewed to the left, implying that CAR impacted sales revenue negatively (Figure 1b).
The results raise a question about the abandonment or drop-off points. A thorough check of the instances when customers abandon the purchase process will help understand which processes need to be corrected (Bolt Financial, 2021). From the Google Analytics Demo Account, of the 9423 visitors that were added to the cart, about 59.8% completed the process (Google, 2021b). The bounce rate, which is the proportion of single-page sessions, is negatively correlated with the abandonment rate (r = -0.44797). This relationship suggests that the pages match customer expectations (average pages visited/session = 4) but do not convert. The website has an average bounce rate of 46.97% (Mar 2020-Feb 2021), which is quite high. As a digital merchandise store, the goal should be to increase the number of customers viewing more than one page. To reduce the bounce rate, it is crucial to improve Google Merchandise Store’s user experience for all traffic sources. Website design and appearance, site speed, and simplicity are key areas that need improvement to achieve a lower bounce rate and CAR of 80% within the next six months.
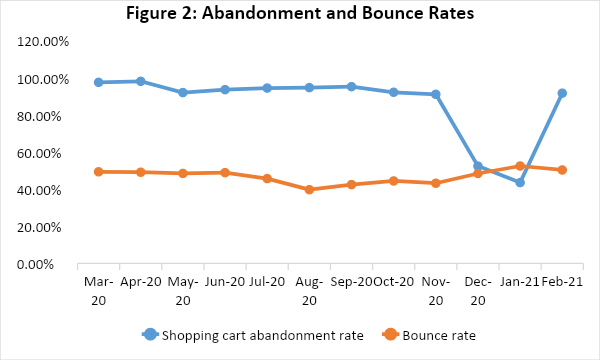
Looking at the trends in CAR and bounce rates, the two metrics remained relatively steady from March to November 2020, suggesting that single-page visits correlate with the number of visitors adding to the cart but leaving before transacting (Figure 2). The CAR value declined between November 2020 and January 2021, consistent with the high number of transactions completed by new and repeat visitors during this period. Therefore, discounts and free delivery can help reduce CAR and bounce rates to boost revenue.
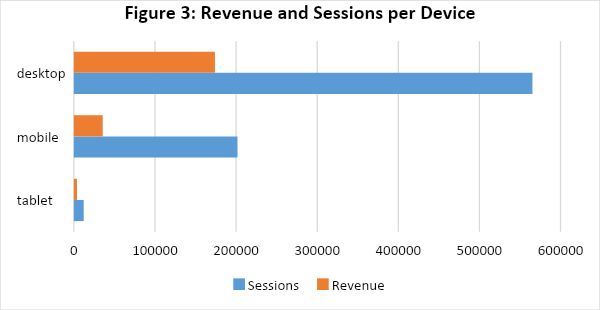
Next, we examine if CAR is correlated with average order size – the mean price of products added to the cart. Again, CAR is negatively correlated with average order size (r = -0.81416), suggesting that increasing this variable would offset the abandonment rate and grow revenue. The analysis of the different segments can indicate the device with the most abandonment rate. The number of sessions was highest in the desktop segment, followed by mobile, which indicates that apps for smartphones and tablets are unavailable. In the three segments, the number of sessions was negatively correlated with revenue, possibly due to the high abandonment rate. This trend is an indicator that more carts are left when shopping via desktop than through mobile or tablet, suggesting that the website is not well optimized for people shopping via their personal computers. The reasons for cart abandonment, including the complicated checkout process, site errors, and the lack of integrated payment options, will be addressed to reduce CAR (Bolt Financial, 2021). Considering the rising use of mobile devices in e-commerce, apps compatible with smartphone systems should be developed to increase visits and sessions by users.
Looking further, we have an average of 45,966 new visitors, making 92 transactions over the period analyzed. This trend suggests that a high dropout rate occurs at the payment stage. By increasing the number of prospects completing the entire purchase process, a lower cart abandonment rate will be achieved. The site should give all information related to price and delivery costs on the item pages to avoid shoppers abandoning the cart at the transaction point. Discounts for new customers adding a product to the cart can reduce the current CAR rate (Google, 2021c). Re-engaging new visitors who have dropped out through e-mail marketing can also reduce cart abandonment in subsequent visits.
The abandonment rate is negatively correlated with average page views per visit (r = -0.14), which shows that most users viewing product details leave before adding these items to the cart. This conclusion suggests that product descriptions are not being persuasive enough, technical, or sufficient. A malfunction at the site could also be preventing visitors from adding viewed products (Akhtar, 2020). On the other hand, the high average bounce rate (46.97%) implies visitors may be comparing prices but lack an incentive to close the deal. Therefore, competitive pricing and discounts can reduce the number of users exiting the site after viewing one page or adding products to the carts.
Average Order Size
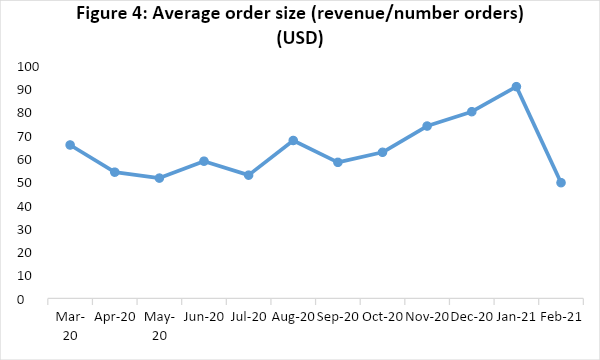
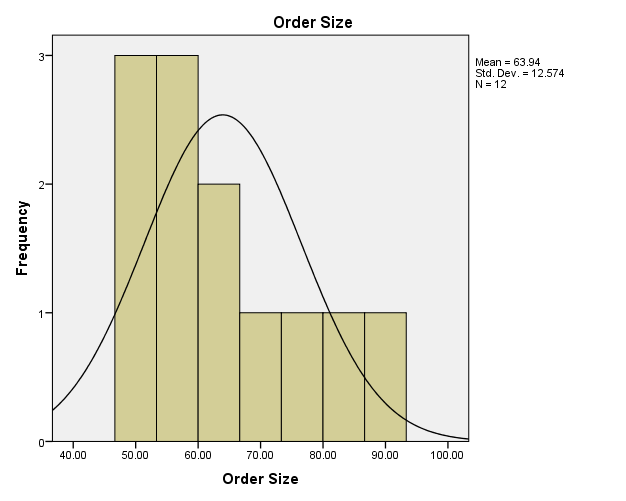
From the Google analytics data, the average order size (AOS) was $63.94 (SD = 12.57) over the 12-month period. A frequency distribution shows a normal (bell curve), as most of the values are closer to the mean (Figure 5). Correlation analysis shows that AOS is positively correlated with revenue (r = 0.83), suggesting that an increase in the average order size will translate into more returns for Google Merchandise Store. This metric captures the mean price of all products added to a cart (Yieldify, 2021). Analyzing AOS would show the value lost due to abandoned carts, which was found to significantly impact revenue earned (p = 0.001).
The AOS fluctuated between $49.68 and $90.92 between Mar 2020 and Feb 2021, with the highest value being obtained in Jan 2021 (Figure 4). The number of orders peaked between November 2020 and January 2021 before dropping in February. This trend implies seasonality in bulk buying trends at the store. The unusually high volume of orders size before and after Christmas and the New Year festivities is critical to the store’s strategic planning. Discount thresholds for specific product categories should be adopted during this period to increase AOS and revenue.
The AOS is the value of the conversion, which measures the percentage of sessions resulting in a purchase. The average value size is positively correlated with both new visitor and returning buyer transactions (r = 0.81; r = 0.98), implying that adding more products to the cart increases the likelihood of conversion. Therefore, the site needs to recommend additional products of interest that customers can put in the cart to improve AOS. The positive correlation also suggests that the pricing strategy and product mix are appropriate. However, first-time purchase offers can increase the number of completed transactions by new visitors, translating into higher AOS.
From the Google Analytics data, the abandonment rate is negatively correlated with the average order size (r = -0.81). This relationship implies that increasing the AOS metric would offset abandonment and increase revenue. Discount thresholds for customers visiting Google Merchandise Store can incentivize them to spend more to be eligible for discounted delivery fees or other benefits (Guo et al., 2020). The challenge is that these offers may not be visible to most users. One strategy is website personalization to help display messages about offers and discounts to the visitor at the right time in order to increase AOS.
Since most visitors exit at the payment stage, getting more users to complete the process will lead to higher average order size. Reducing the abandonment rate by 10% to 80% means that 20% of visitors will finish the entire checkout process. The current average VOS of $63.94 per user would increase to $76.73, while revenue would rise from $17,759.96 to $21311.95 per month.
Considering OAS per device, the highest product quantity or volume is sold through desktops. With an average revenue of $173,963, this segment is a preferred channel by users, and should be optimized to move more product units (Yieldify, 2021). Further, the positive correlation between OAS and returning visitor transactions (r = 0.98) indicates that Google Merchandise Store’s product lists is creating interest in other items. However, complementary products should be suggested to buyers to increase the average order size. Further, quantity discounts could be an incentive for shoppers to buy more of the same product in subsequent visits.
New Visitors to the Site
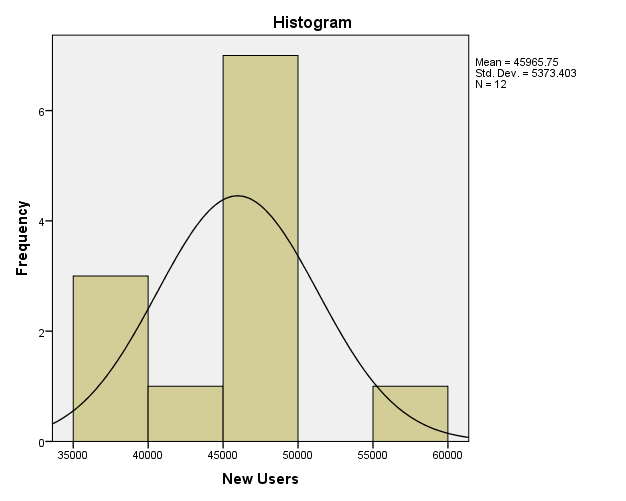
In order to generate more traffic to the site, the analysis of new users is critical. On average, 45,966 customers (SD = 5,373) visited the website for the first time. The high standard deviation suggests the seasonality of the visits, as the highest number (56,568 users) was reported in December 2020. The data points exhibit a normal distribution about the mean, which means that there are a few outliers (Figure 6). The strong positive correlation with the total page views (r = 0.70) suggests that new visitors come to the product pages to look for specific products. Given the high abandonment rate, users leave the site without any purchase because they fail to find such items at once. Therefore, the store needs to optimize search terms to generate more traffic.
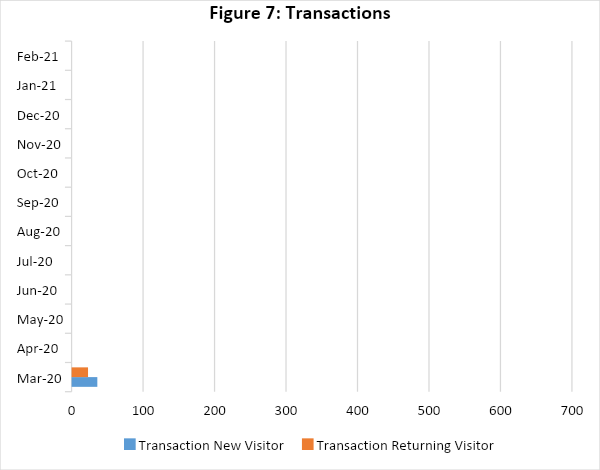
Examining how well the store is doing in attracting new users will be based on transaction numbers. The transactions averaged 92 for new visitors compared to 113 for returning users (Figure 7). Based on the graph below, the months of December 2020 and January 2021 had the highest transactions for both new and returning visitors, suggesting seasonality patterns in purchase behavior. Therefore, strategic marketing efforts should target new users visiting the site in December and January. Optimizing the website for desktop users and developing apps for mobile devices can also increase traffic. Social media marketing can also enhance the number of new visitors to the site.
The characteristics of the users are crucial to devising a segmentation strategy. From the Google Analytics data, on average, 26.13% of the visitors were male, while females comprised 16.9% of the customers. Marketing activities tailored to the pain points or motivating factors for men and women are needed to increase traffic. The focus should be on attracting new users, reducing CAR, and increasing the average order value in the next six months.
The results also show that new visitors are more likely to transact (except in the peak months of February, January, and December) than returning users. Repeat customers probably want to see if there are new products being launched or offers. The site needs to capture the attention of visitors through an on-site search option to allow new users to go to the product pages directly. Additionally, optimized search terms and SEO can enhance the experience of first-time users (Chaffey & Smith, 2017). This strategy will generate new traffic and increase the time spent on the site, which is associated with the number of transactions made by new users (r = 0.096).
References
Ahmed, H., Jilani, T. A., Haider, W., Abbasi, M. A., Nand, S., & Kamran, S. (2017). Establishing standard rules for choosing the best KPIs for an e-commerce business based on google analytics and machine learning technique. International Journal of Advanced Computer Science and Applications, 8(5), 562-567.
Akhtar, A. (2020). How to track shopping cart abandonment with Google Analytics.
Bolt Financial. (2021). The ultimate cart abandonment guide: Calculating the cart abandonment rate. Web.
Chaffey, D., & Smith, P. R. (2017). Digital marketing excellence: Planning, optimizing, and integrating online marketing (5th ed.). Routledge.
Cheng, A. (2020). What is Google Analytics?
Google. (2021a). Analytics help – Demo account.
Google. (2021b). Google official merchandise store.
Google. (2021c). Enhance e-commerce reports.
Guo, Y., Hu, X., Zou, Y., Li, S., Cheng, W., Li, Z. (2020). Maximizing E-tailers’ sales volume through the shipping-fee discount and product recommendation system. Discrete Dynamics in Nature and Society, 1(7349162), 1-14.
Hung, Y., Wang, Y., & Chang, R. (2020). Investigation of the effective use of ensemble learning algorithms for cyber data analytics – The prediction of the customer revenue on the Google Merchandise Store (Gstore). The 4th International Conference on E-Society, E-Education and E-Technology, 76-82.
Koks, P. (2017). 33 Google Analytics insights from enhanced e-commerce and segmentation. Web.
Yieldify. (2021). Increase average order value: Ecommerce AOV optimization to boost the bottom line.