The choice of the countries for the paper was directed by the following information. Canada is a member of OECD that ranks fifth among oil exporters in the world (“The World Factbook” par. 1-3). However, Canada’s export is relatively diversified and is dominated by various types of petroleum (crude oil corresponds to 18%) and automotive products (cars’ share amounts to 10%) (“Canada” par. 1). Norway is another OECD member that relies heavily on the oil trade (46% of its export) since the discovery of the country’s natural resources in the 1960s (“Norway” par. 1-3). The United Kingdom (UK) is an OECD country that avoids exporting natural resources (“UK” par. 3). The UK export is dominated by machinery (for example, turbines), chemicals (for example, medicines), and cars (9%) (“United Kingdom” par. 1-4). Saudi Arabia is not an OECD country; it relies on oil exports that constitute 90% of the country’s exports, 80% of budget revenues (“Saudi Arabia” par. 3). The data that describes the economic development countries (GDP and population) was obtained from the interactive tool “Penn World Table” developed with the help of Robert Feenstra, Robert Inklaar, and Marcel P. Timmer. It does not have the data on Saudi Arabia before 1969, which defines the timeframes of the presented charts.
Charts and Ranking of the Countries
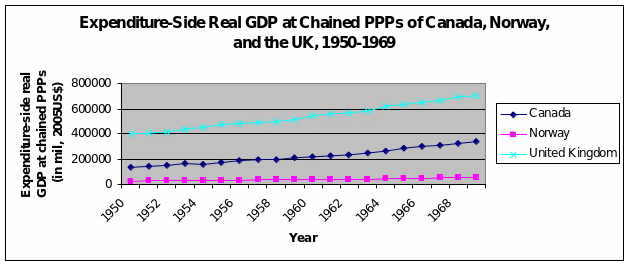
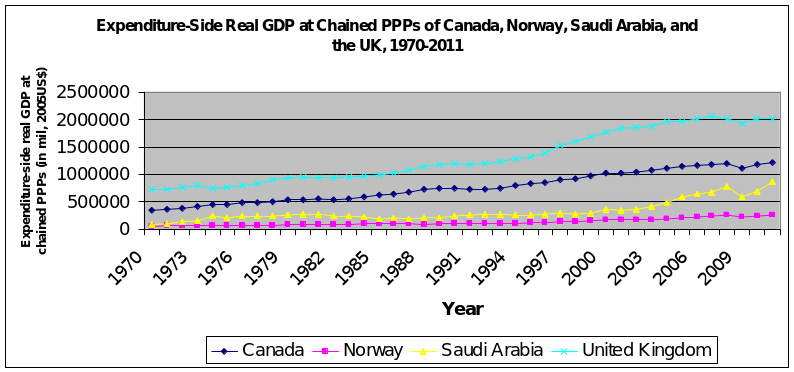
GDP Dynamics. From fig. 1 and fig. 2, it is evident, that the GDPs of Canada and the UK have been growing at a relatively steady but accelerating pace while that of Norway appears to be growing much slower. Saudi Arabia exhibits an increase in GDP since the beginning of this century.
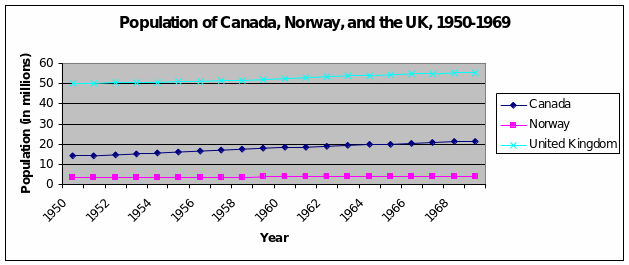
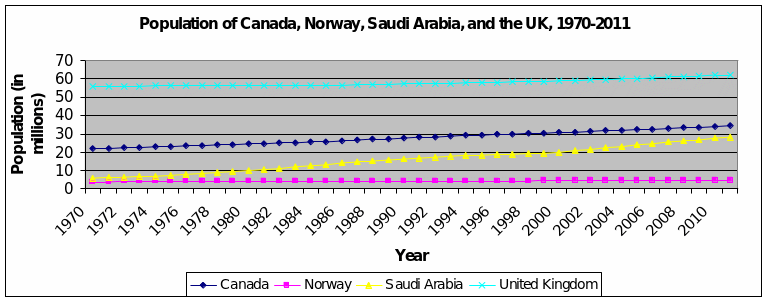
Size. From fig. 3 and fig. 4, it is evident that the UK has the largest population followed by Canada, Saudi Arabia, and Norway. The populations of the UK and Canada have been growing steadily while Saudi Arabia has exhibited faster rates. Norway’s increase in population appears to be much slower when compared to the other countries. Still, the ranks of the countries’ sizes do not differ for the periods before and after 1973.
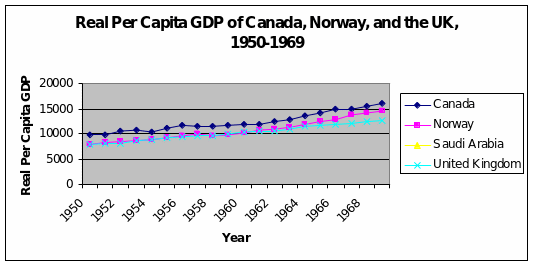
Standard of Living. From fig. 5, it is evident that the real per capita growth of the countries has been exhibiting more complex changes, which is why the data was split into three periods. Fig. 6 demonstrates the period of 1950-1969 and has no information concerning Saudi Arabia. It is evident that the real per capita GDP indices have been growing steadily with Canada exhibiting the best results followed by Norway and UK.

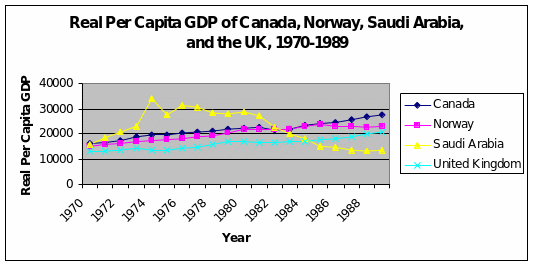
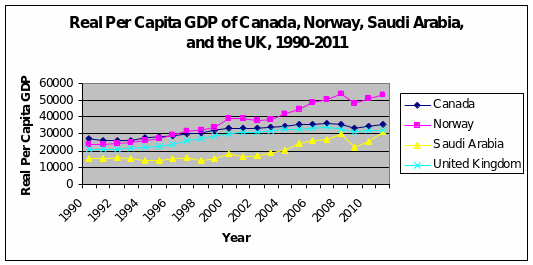
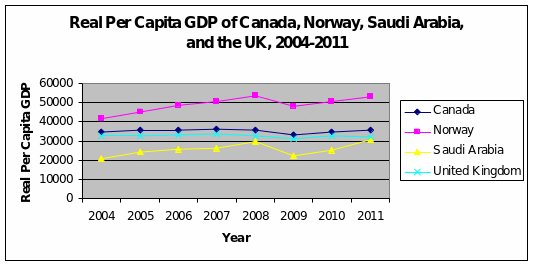
In 1970, Saudi Arabia was showing a similar GDP per capita, but then it experienced a sharp increase in it (beginning with 1972) that was followed by a similarly sharp decrease in the 1980s. At the end of the 1980s, Canada was demonstrating the highest rates of GDP per capita once again, followed by Norway, the UK, and Saudi Arabia as can be seen in fig. 7. Fig. 8 demonstrates that Saudi Arabia GDP reached that of the UK in 2011; Norway’s GDP is slightly greater. The most noticeable increase in GDP per capita is exhibited by Norway since the end of the 1990s; the difference between Canada and Norway is very noticeable.
Extensive Growth and Intensive Growth. The collected data can provide only limited insight in the extensiveness and intensiveness of the country’s growth, but some conclusions can be made. From the information presented above, it can be suggested that Saudi Arabia has been experiencing the highest rates of extensive growth in size and exports, but it did not significantly affect the GDP (see fig. 2) and GDP per capita. In fact, the latter naturally decreased due to the increase in population and slow rates of GDP growth. It can be concluded that the growth of the country was not intensive before the 2000s, but it is changing. This change corresponds to the modernization reforms carried out by King Abdallah (“Saudi Arabia” par. 1).
The population of the UK is noticeably larger than that of any other of the presented countries. Its increase throughout these decades is steady but slow, which does not indicate the prevalence of extensive development trough workforce. Fig. 2, however, shows significant rates of increase in GDP, and similar (although less prominent) tendency can be seen in GDP per capita (fig. 8). It appears that the UK is developing intensively rather than extensively.
Canada exhibits steady growth both in population and GDP. In general, the GDP increase of the country mimics that of the UK, but exceeds it; the population has been growing at a greater pace than that of the UK (added 20 million compared to 12 in the UK). Therefore, it can be presumed, that Canada combines extensive and intensive growth; it is a natural resource exporting country, but its level of technological advancement is also notable (“The World Factbook” par. 3). It is likely that its extensive growth is higher than that of the UK.
The miracle of intensive growth is demonstrated by Norway. Its population has increased by two million only, but its GDP per capita has skyrocketed (increased seven times). Admittedly, since the 1960s the extensive growth of Norway capital occurred due to resources exports. Still, the relationship between the slowly growing labor force and the rates of the increase in GDP indicate that the money is used intensively (“Norway” par. 1).
GDP as a Measure of the Level of Economic Development
If the real per capita GDP is regarded as the measure of the level of economic development, Saudi Arabia appears to have lagged behind the rest of the countries until the year 2011 when it practically reaches the level of the development of the UK and Canada. The two latter countries are very similar in their level of development, but they lag behind Norway. Given their last positive GPD per capita change (984 for Canada and 1322 for the UK), they are 19 and 15 years behind Norway.
Abundance of Natural Resources and a High Standard of Living
From the charts, it appears that the abundance of natural resources may lead to a high standard of living when it is managed properly. The fact that Canada exhibits slightly higher GDP per capita appears to testify to this idea; the development of oil-exporting Norway is also an argument for it. However, Saudi Arabia’s sluggish development that has intensified only with new reforms demonstrates that the development of natural resources needs to be correlated with intensive economic development.
“Staples Thesis” and “Resource Curse”
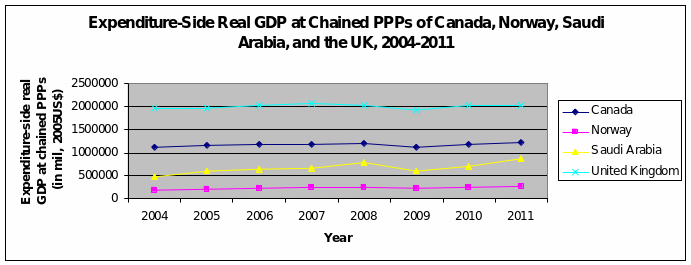
As stated by Watkins, “expanding exports and satisfactory economic growth have been correlated” by “Staples Thesis” (157). The greater rates of GDP development in the resource-exporting countries (when compared to the UK) appear to testify to this. At the same time, the significant lagging of Saudi Arabia seems to be another case of systematic failure “to achieve strong export-led growth” by resource-exporting countries (Sachs and Warner 837). It is also noteworthy that the oil-exporting economies suffered a greater decrease during the recession of 2008 (seen fig. 2, fig. 8, fig. 9, and fig. 10). From the point of view of GDP per capita, the decrease demonstrated by the UK appears to be almost nonexistent when compared to other countries (see fig. 10). Therefore, the presented data provides evidence to the idea that the dependence on resource export makes an economy less stable.
Works Cited
“Canada.” The Observatory of Economic Complexity. MIT Media Lab, 2015. Web.
Feenstra, Robert C., Robert Inklaar, and Marcel P. Timmer. “The Next Generation of the Penn World Table.” University of Groningen. University of Groningen, 2015. Web.
“Norway.” CIA. CIA, 2015. Web.
Sachs, Jeffrey D., and Andrew M. Warner. “The Curse of Natural Resources“. European Economic Review 45.4-6 (2001): 827-838. Elsevier. Web.
“Saudi Arabia.” CIA. CIA, 2015. Web.
“The World Factbook: Canada.” CIA. CIA, 2015. Web.
“UK.” CIA. CIA, 2015. Web.
“United Kingdom.” The Observatory of Economic Complexity. MIT Media Lab, 2015. Web.
Watkins, Melville H. “A Staple Theory Of Economic Growth”. The Canadian Journal of Economics and Political Science 29.2 (1963): 141. Elsevier. Web.