Introduction
The topic selected for this report is “Investigation of the relationship between the number of Starbucks’s stores per capita and Canada’s ‘GDP per Capita’.” Starbucks Coffee Company (Starbucks) is a leading coffee brand that has the largest chain of stores. It is based in Seattle, Washington and its shares are registered on Nasdaq Global Select Market (Starbucks, 2017). It has 24,000 stores in 70 markets globally. The company was established in 1971, and it is now the leading coffee retailing brand worldwide in terms of sales and number of stores that it operates in global markets. Its products include coffee, handcrafted beverages, merchandise, fresh food, tea, and ready-to-drink (RTD) (“Starbucks Company Profile” 2018).
The company started its operations in Canada in 1987, and it experienced similar growth over the years (“Our Canadian Story” 2018). Starbucks has more than 1,400 company-operated and licensed locations across Canada. Although the company enjoyed phenomenal growth since its inception, the financial crisis during 2007-08 forced the company to close down thousands of its stores and revise its strategy to improve its product offerings and management of stores to avoid financial losses in its primary U.S. market. Similarly, the company also closed down many stores in Canada in 2009 and after 2012 as the economy slowed down. It is clear that companies’ performance is highly affected by the economic growth of the country in which they operate. Gross Domestic Product (GDP), which is the total value of goods and services produced and consumed by an economy, is an important indicator of economic growth (Brezina, 2012). On the basis of the company’s history, it is clear that its business and financial performance depends on the economic growth of countries in which it operates. As global economies revived in the last ten years or so, the company’s management successfully turnaround its business, and it reported consistent growth in that period.
Therefore, it would be interesting to investigate Starbucks’s business development measured by the number of stores that it opened in the last 13 years (2005-2017) in Canada. Furthermore, the estimation of correlation between Starbucks’s performance and ‘GDP per Capita’ of Canada is useful to forecast its future performance. A recent report by Trefis Team (2016) provides discusess the business strategy of Starbucks in the recent years. It indicates that the company’s strategy is to increase the number of stores operating in different markets. It wants to improve its market penetration and keep its operating costs down by opening drive-thrus or express stores in both urban and non-urban areas. It is important to investigate the relationship between business performance and GDP because these results can be generalized to other companies. Furthermore, it will also help in predicting changes in the business performance due to changes in economic conditions. It is important for a company’s managers to predict the vulnerability of its business to changes in macroeconomic factors such as economic growth that could create unsystematic or uncontrollable risks. The research question investigated in this report is given in the following.
Is there a correlation between the number of ‘Starbucks per Capita’ and ‘GDP per Capita’?
The research question set in this study is answered on the basis of the results of the correlation matrix and regression model that are implemented to determine the value of the coefficient between the two variables identified for this study. The dependent variable is ‘Starbucks per Capita,’ and the independent variable is ‘GDP per Capita.’ Both variables are measured on the basis of the total population of Canada. Furthermore, the regression model implemented in this study also considers “Year’ as another independent variable.
The report is structured in different sections that helps in investigating the relationship between the number of ‘Starbucks per Capita’ and ‘GDP per Capita’ of Canada. The first section of the report provides the topic of the current study and its main research question. Moreover, it gives the background of the study by highlighting its relevance and importance. The second section provides a comprehensive review of previous studies that also investigated the relationship between business performance and GDP. The third section provides a discussion of the theory that could be used to elaborate the relationship between the two variables. The fourth section provides findings of descriptive statistics, correlation matrix, and regression analysis along with their interpretation. Finally, the report gives conclusions regarding the relationship investigated in this study and also highlights the possible areas for further research based on the limitations of the current study.
Literature Review
There have been many studies that have investigated the business performance of companies globally and factors affecting it. Most of these studies have considered macroeconomic factors affecting corporate performance. Since the current research examines the relationship between the business performance of Starbucks and ‘GDP per Capita’ of Canada, therefore this section of the report covers previous studies that have also performed a similar analysis.
A study by Fidrmuc and Korhonen (2010) examines the impact of economic performance on business cycles. It is indicated that economies that face a financial crisis tend to have a slow economic development which, in turn, affect the performance of firms. Therefore, there is a significant impact of economic development on business cycle frequencies. Furthermore, the key literature by den Berg (2017) explains that economic development is the outcome of many factors including population growth, number of businesses, firms’ performance, and governmental policies, etc. The increase in economic activity creates new opportunities for individuals to earn higher incomes, which contributes to the business development of companies as more customers buy their products and services.
On the other hand, a study conducted by Schneider (2015) indicates that the performance of a business is significantly dependent on the economic conditions of the country in which it operates. In this regard, it could be exemplified that companies, which operate in countries with higher GDP such as China and the United States of America can generate more profit (Leamer and Storper 2014). In this regard, it becomes evident that Canada’s strong ‘GDP per Capita’ significantly influence Starbucks’s business performance.
A study conducted by Marano et al. (2016) reveals the impact of a country’s GDP on business performance and corporate strategies. It concludes that high ‘GDP per Capita’ reflects that the economic condition of the country’s residents is stable and they have more money for spending on buying products and services. In this way, Starbucks is also affected by the economic growth of Canada as it has been reported that the company achieved larger market share over the years due to the rise in the country’s ‘GDP per Capita’.
A study by Wojcik (2016) supports the above statement by articulating that there are specific strategies of businesses that are influenced by the economic growth or high ‘GDP per Capita’ of the country. It is observed that retail firms have to increase the number of stores per capita in countries with strong ‘GDP per Capita’ (Wojcik 2016). This particular strategy of companies can be further understood by reviewing the study of Novales, Fernández, and Ruiz (2014) in which the researchers highlight that growing GDP of a country indicates that it has a vast pool of buyers. In this regard, companies operating in this country are also required to establish more retailing stores to fulfill the requirements of the market.
Furthermore, increasing the store per capita escalates the economic value and performance of businesses (Fraser 2013). A company, which has a large number of stores in any region, can generate more profit per annum as compared to other firms. Moreover, the availability of stores in various markets also suggests that the company has a higher market share and is capable of attracting a large number of customers (Fraser 2013). In this way, it could be articulated that there is a strong relationship between ‘GDP per Capita’ and business performance.
A study by Bjørnskov (2015) presents a contrasting overview regarding the number of store per capita in a country with high ‘GDP per Capita’. The study illustrates that functioning in a country with high ‘GDP per Capita’ can be complicated for businesses as it increases the burden on them to set more stores per capita and invest more on attracting customers as the market with higher GDP is relatively more competitive (Bjørnskov 2015). In such condition, it could be stated that the economic growth may have a negative impact on business strategies and performance.
A study by Issah (2017) examines the role of macroeconomic factors on the business performance of companies measured by financial indicators. The study included real GDP as one of the measures of firms’ performance and carried out a multiple regression analysis to find a negative relationship between return on assets and real GDP. It also indicates that firms’ performance increase when the level of economic activity in a country increases. However, real GDP has a significant, negative impact on it.
However, a study by Zhou and Wu (2014) highlights that the economic growth has more positive outcome on the business performance as it provides a platform for the company to earn more profit by setting up more stores per capita. It also improves the efficacy of the company to cater more customers by adopting technological innovation, which further enhances the business performance (Zhou and Wu 2014).
The literature above indicates that the economic growth has a positive impact on business strategies and performance. Thus, it could be tested in this study whether there is a strong correlation between Starbucks’s stores per capita and ‘GDP per Capita’ of Canada or not.
Setting-up Hypothesis
The discussion of previous studies in this section forms the basis for establishing research hypotheses that are tested through statistical testing of data. These are null and alternative hypotheses given below that are aimed at investigating the correlation between the number of Starbucks’s stores per capita and ‘GDP per Capita’ of Canada.
- H0: There is no correlation between Starbucks’s stores per capita and ‘GDP per Capita’ of Canada.
- H1: There is a positive correlation between Starbucks’s stores per capita and ‘GDP per Capita’ of Canada.
Theoretical Analysis
The relationship between business performance and economic growth could be explained by one of the models referred to as the Solow-Swan model that is set within the framework of neo-classical economic theory. The model elaborates that economic growth of a country depends on three factors including capital accumulation, availability of labor, and increased productivity (Novales, Fernández and Ruiz 2014). It could be used to explain the success of Starbucks in Canada as the company benefited from the growing number of immigrants coming to Canada that not only increased the size of the country’s population but also allowed the company to creates jobs. The company also accumulated earnings over the years that it used for expanding its network of stores. The New Growth Theory explains that the profit-generating motive of firms mainly leads to the economic growth of a country. It also states that technological advancement and adoption by businesses is crucial for economic development (McTaggart, Findlay and Parkin 2013). It is noted that Starbucks made significant changes to its strategy and integrated new information management systems to improve management of its stores and employees. Both model and theory suggest that there is a significant relationship between economic growth and business strategies aimed at improving the business performance.
Empirical Analysis
The empirical analysis performed in this study is based on the data of the two variables identified as ‘Starbucks per Capita’ and ‘GDP per Capita’. The data for the first variable is collected from Statista, Worldometers, and World Bank’s websites. The number of Starbucks’s stores located in Canada from 2005 to 2017 was obtained from Statista (Statista 2018b). The number of stores was divided by the country’s population to determine the values of the dependent variable ‘Starbucks per Capita’. The data of the country’s population was obtained from the World Bank’s website and Worldometers (Worldometers 2018, The World Bank 2018). Furthermore, the date of ‘GDP per Capita’ of Canada was collected from Statista and the World Bank’s website (Statista 2018a, The World Bank 2018). It could be stated that the data for this study is collected from reliable websites, which increased the internal validity of the research outcomes of the analysis part. The generalizability of the research outcomes is limited because the data used in the current study is only limited to the company’s operations in Canada. However, it is suggested that the same research approach can be adopted in another study to investigate the relationship between business performance and economic growth by using a different dataset.
Descriptive Statistics
The descriptive statistics calculated in this section are listed in Table 1 along with their values for Starbucks and Canada.
Table 1: Descriptive Statistics.
In total, 13 years’ data was collected for both variables. The mean value of ‘Starbucks per Capita’ is 0.0000321, which implies that there are 32 stores of the company per one million individuals. It could be stated that this number is small. However, the interpretation of this finding depends on the geographical location of stores and the distribution of population in Canada. These are important to consider before making any claim regarding the company’s business position in Canada. The data also indicates that the number of stores of ‘Starbucks per Capita’ increased during 2005-2017. However, a slowdown in this is observed in 2015 and 2016. The mean value of ‘GDP per Capita’ is $457,32.32, which implies that Canada is one of the leading economies in the world. However, the country’s ‘GDP per Capita’ also declined in 2015 and 2016.
It somewhat shows that the values of both variables changed in the same direction. The low value of standard error implies that the selected sample sufficiently represents the data population that consists of the data of Starbucks and Canada’s ‘GDP per Capita’ since the company started its operations in Canada in 1987. The number of Starbucks’s stores increased when the country’s ‘GDP per Capita’ also increased. The median value of both variables is close to the mean value that means that there was consistency in data. The standard deviation of both variables was low based on their observed values. Furthermore, the skewness of both variables was negative, which means that the histogram of these variables was skewed leftwards of the mean value. Moreover, the range of the selected variables was large because of the large difference in their minimum and maximum values. The minimum number of stores per capita was recorded in 2005, and its maximum number was in 2014. On the other hand, the lowest value of ‘GDP per Capita’ was in 2005, and its highest value was recorded in 2012. One of the conditions of the linear model implemented in this study is the normal distribution of data. It is determined by creating histograms of the two variables’ values given below.
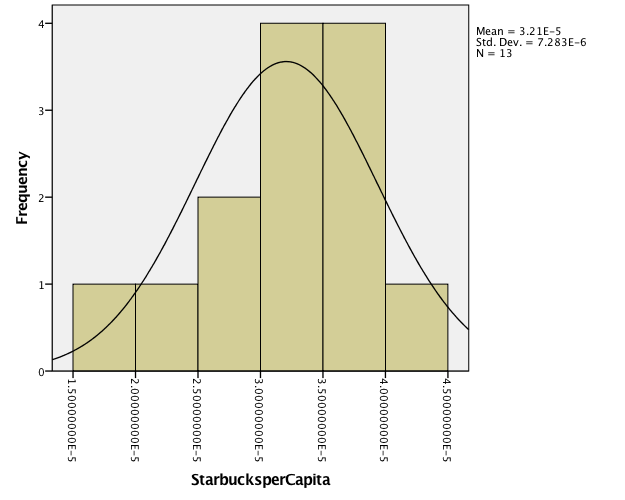
Figure 1 shows that the normal distribution curve is bell-shaped, which means that the condition of a normal distribution is met and the linear model is justified for using in this study.
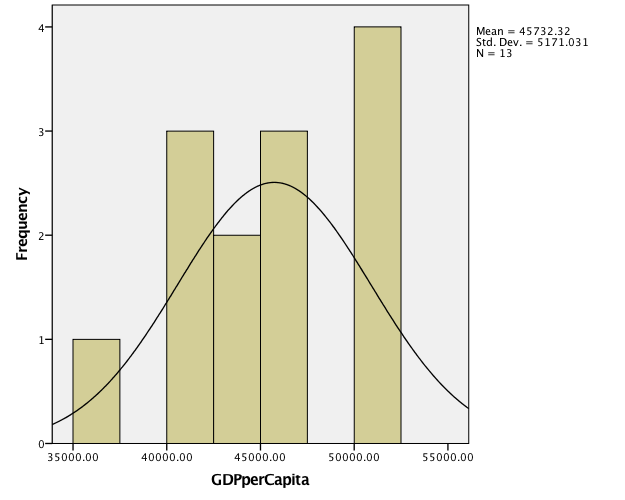
Figure 2 also shows that the normal distribution curve of ‘GDP per Capita’ is bell-shaped, which means that the condition of a normal distribution is satisfied, and the linear model is justified for determining the relationship between the two variables selected for this study.
Correlation Matrix
The coefficient of the correlation (r) between two variables is calculated by using the following formula.
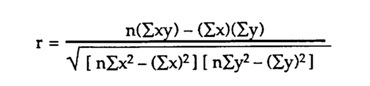
Where n = number of observations, x = independent variable, and y = dependent variable.
The correlation matrix is developed in this study, and its results are provided in the following table.
Table 2: Correlation matrix.
Table 2 shows that the coefficient of correlation between ‘Starbucks per Capita’ and ‘GDP per Capita’ has a positive value of 0.5945. The positive correlation between the two variables implies that the values of both variables change in the same direction. It means that if the country is experiencing growth and its ‘GDP per Capita’ is increasing, then businesses are also likely to report growth. The analysis of data shows that Starbucks continued to open new stores as the Canadian economy grew. However, the company closed down many stores due to the slowdown in the economy in 2009 and after 2012. The coefficient value is 0.5945, which means that the relationship between ‘Starbucks per Capita’ and ‘GDP per Capita’ is moderate. It can be stated that 1% change in the country’s ‘GDP per Capita’ generates 0.5945% change in the number of Starbucks’s stores in Canada. Table 2 also indicates the correlation between the two variables is significant at the 0.05 level. It also suggests that there could be other factors included in a study to investigate the relationship between the number of stores per capita and ‘GDP per Capita’ that would improve the prediction of this relationship.
Scatterplot of ‘Starbucks per Capita’ and ‘GDP per Capita’
The scatterplot given in Figure 3 depicts that there is a positive relationship between ‘Starbucks per Capita’ and ‘GDP per Capita’ as the linear regression line is upward sloping. It also shows the linear equation that could be used to forecast the value of the dependent variable, i.e., ‘Starbucks per Capita’ by changing values of the independent variable, i.e., ‘GDP per Capita’.
The linear equation obtained from Figure 3 is given below.
y = 0.00000000008x – 0.0000006
Where R² = 0.35338
The regression equation shows that the coefficient value is very small 0.00000000008, and the value of R² is 0.35338, which means that the linear model only explains 35.338% of the total variations in the selected dataset of the number of Starbucks’s stores per capita in Canada. The next step of the analysis needs to improve the predictive capability of the model, which is explained in the next sub-section of this report.
Regression Analysis
A linear regression model is implemented in this study to determine the relationship between the dependent variable, i.e., ‘Starbucks per Capita’ and the independent variable, i.e., ‘GDP per Capita’. In this model, an additional variable, i.e., ‘Year’ is also added. The reason for this is that it would improve the outcome of the regression analysis in terms of better prediction of the value of the coefficient of the relationship between the two key variables. The results of the multiple regression model are provided in the following table.
Table 3: Summary Output.
It could be noted from Table 3 that the value of R² has improved significantly from 0.35338 to 0.9399. It means that this regression model has a better capability of predicting the relationship between dependent and independent variables included in the model. The model explains almost 94% of the total variations observed in 13 data entries. Moreover, Table 3 indicates that the value of the standard error is very low that suggests that the outcomes of the model implemented in this study suitably represents the relationship between the two variables.
Table 4: ANOVA.
Table 4 indicates that the total variations in the dataset were small. Moreover, the regression model explains most of the variations recorded in these values. The value of significance F is less than the standard error term of 5% as the confidence level assumed for this study is 95%. It implies that the results of the regression model are reliable and representative of the relationship investigated in this report.
Table 5: Coefficients.
Table 5 is generated from the regression model implemented in this study. It indicates that the coefficient of the constant, β0 is -0.003144574, which represents the sum of residuals not explained by the model. The first coefficient of the slope, β1 between ‘Starbucks per Capita’ and ‘GDP per Capita’ is 3.49826E-10. Since the coefficient value is positive, therefore it could be indicated that the relationship between these two variables is positive. It means that when the value of the independent variable increases, the value of the dependent variables also increase. The second coefficient of the slope, β2 between ‘Starbucks per Capita’ and Year is also positive. However, its value is greater than the first coefficient, β1, which means that there is a stronger relationship between ‘Starbucks per Capita’ and Year than ‘Starbucks per Capita’ and ‘GDP per Capita’.
This finding is supported by the analysis of p-value of both relationships. It is noted that the p-value of ‘GDP per Capita’ is 0.0152, which is more than the standard error term of 5%. It means that the relationship between ‘Starbucks per Capita’ and ‘GDP per Capita’ is found to be insignificant. It is not significant even if the confidence level of 90% is considered. It is inconsistent with the finding of the correlation matrix as the correlation between the two variables is found to be significant without the variable of ‘Year.’ On the other hand, the p-value of ‘GDP per Capita’ is 1.77262E-06, which is less than the standard error term of 5%. It means that the relationship between ‘Starbucks per Capita’ and Year is found to be significant. These results are discussed in the following to provide results regarding the validation of the hypotheses set out in this study for testing the relationship between the two variables. Based on the findings of the regression model, the following linear equation is formed to estimate the impact of explanatory variables on the dependent variable.
‘Starbucks per Capita’ = -0.003144574 + 3.49826E-10 x ‘GDP per Capita’ + 1.57167E-06 x Year
This equation can be used to forecast the number of Starbucks stores in the coming years depending on the estimation of ‘GDP per Capita’. The forecasted value of ‘Starbucks per Capita’ is determined to be 0.00004318 in 2018 based on the average growth of ‘GDP per Capita’ ($46,094.7). The residuals of the regression model are provided in the following for the last 13 years.
Table 6: Coefficients.
The sum and mean value of residuals is nil, which also satisfies the assumption of the regression model.
Discussion of Findings
The findings of the current study are discussed in a way that a comprehensive answer to the research question stating “Is there a correlation between the number of ‘Starbucks per Capita’ and ‘GDP per Capita’?” is provided for better understanding of the research approach adopted in this study and the results obtained from statistical testing of the data collected for the identified variables in this report. The current study aims to investigate the relationship between the number of Starbucks’s stores per capita, which is calculated as the number of Starbucks divided by the total population of Canada, and ‘GDP per Capita’. The study draws its methodology from previous studies that also conducted a similar study of the relationship between the two variables selected for the current study. The trend analysis of the values of the two variables indicates Starbucks underwent major financial problems because of the financial crisis during 2007-2008. The company’s management decided to close down a large number of its stores globally.
A similar trend was noted in 2009 as the number of Starbucks’s stores in Canada declined because the management decided to close down the company’s stores to reduce its operating losses. The strategy change followed by its strict adherence allowed the company to turnaround its position in the coffee market. It could be noted that the number of Starbucks continued to increase till 2014 as it again faced challenges due to the slowdown in Canada’s economic progress. Therefore, it is clear that there exists a relationship between the historical growth of Starbucks in Canada and GDP. It could also be explained by the neo-classical theory of economic growth, which implies that Starbucks invested in expanding its chain of stores throughout Canada as the economy grew. When Canada’s economy improves, businesses like Starbucks take advantage of the increasing demand for their products and services. They are also able to manage their operations in a better way by controlling their costs or distributing them over a larger number of sales locations. It is clear that Starbucks’ management was efficient to take full advantage of the opportunities that the growing economy of Canada offered to it.
The statistical testing of the data, i.e., correlation matrix confirmed that there is a positive relationship between the dependent variable, ‘Starbucks per Capita’ and the independent variable, i.e., ‘GDP per Capita’. The value of correlation coefficient implied a reasonable relationship between the two variables, which means that several other factors could have been included in the analysis to predict better changes in the number of stores operated by Starbucks in Canada. The correlation matrix also shows that the correlation between the two variables is significant at the confidence level of 95%. The positive correlation is consistent with the findings of previous studies including Zhou and Wu (2014), Frase (2013), and Novales, Fernández, and Ruiz (2014) as they also found businesses to experience growth when there is an improvement in the economic development of the country in which they operate. However, this finding is different from those presented in the study by Bjørnskov (2015).
The key part of the analysis performed in this report comprises of the results drawn from the multiple regression model, which also included another variable representing time. It improved the goodness of fit as the value of R-squared substantially improved from the value of 0.35338 found in the previous linear model. The coefficient of the slope between ‘Starbucks per Capita’ and ‘GDP per Capita’ is positive, which also confirms the results of the correlation matrix. However, this model does not find this relationship to be significant, which contradicts the results of the correlation matrix. The findings of the regression analysis are consistent with previous studies including Marano et al. (2016) and Leamer and Storper (2014) that also used statistical analysis to determine the relationship between business performance and economic growth.
On the basis of the findings of both correlation matrix and regression analysis, the answer to the research question set out in the current study is that there is a positive correlation between the number of stores of ‘Starbucks per Capita’ and ‘GDP per Capita’ of Canada. The results of the present study are consistent with those of previous studies that are discussed in the literature review section of this report. It implies that the results of this study are reliable and relevant. Starbucks is the largest coffee retailer globally and its business strategy to increase the number of stores in different markets is derived from the scale of its operations that it wants to achieve in growing economies across the world. Starbucks is a good example of companies that use the number of their physical stores as an indicator of their growth. They attract new customers through their physical stores in countries with rising GDP per capita.
Hypothesis Validation
Both correlation matrix and regression analysis indicate that the coefficient of relationship between ‘Starbucks per Capita’ and ‘GDP per Capita’ is positive. However, it is not found to be significant based on the comparison of the p-value. Therefore, the null hypothesis, which states that there is no significant positive relationship ‘Starbucks per Capita’ and ‘GDP per Capita’ is accepted. On the other hand, the alternative hypothesis, which states that there is a significant positive relationship ‘Starbucks per Capita’ and ‘GDP per Capita’ is rejected. Although the objective of the current study is not to investigate the relationship between ‘Starbucks per Capita’ and ‘Year’, it is also analyzed in this study to improve the results of the regression model. It is found that the coefficient of relationship between ‘Starbucks per Capita’ and ‘Year’ is positive. Moreover, it is found to be significant based on the comparison of the p-value. Therefore, the null hypothesis, which states that there is no significant positive relationship ‘Starbucks per Capita’ and ‘Year’ is rejected. Furthermore, the alternative hypothesis, which states that there is a significant positive relationship ‘Starbucks per Capita’ and ‘Year’ is accepted.
Conclusion
The study investigates the relationship between the business performance of Starbucks and economic growth of Canada. The study implemented in this report is quantitative, and statistical tests performed in this study include calculation of descriptive statistics, correlation matrix, and regression analysis. The study adopts the deductive approach by providing a theoretical analysis of economic growth and its impact on business performance and critical discussion of previous studies that have also investigated the relationship between the two variables including ‘Starbucks per Capita’l (dependent variable) and ‘GDP per Capita’ (independent variable). The two hypotheses are established that are put into testing on the basis of the statistical tests performed in this study.
Both correlation matrix and regression analysis generated a positive coefficient of the relationship between ‘Starbucks per Capita’l and ‘GDP per Capita’. However, there are conflicting results related to the significance of this relationship as the correlation matrix indicates that there is a significant relationship between ‘Starbucks per Capita’l and ‘GDP per Capita’. On the other hand, the regression analysis, which added another variable representing time in the analysis, shows that there is an insignificant between ‘Starbucks per Capita’l and ‘GDP per Capita’. The validation of hypotheses is carried out on the basis of the results of the regression model, and it is concluded that the null hypothesis is rejected and the alternative hypothesis, which states that there is a positive relationship between ‘Starbucks per Capita’l and ‘GDP per Capita’ is accepted.
Limitations of Current Research and Recommendations
There are few limitations of the current study and methodology adopted to carry out the analysis. The first limitation is the limited sample size, which could have been extended by collecting data of Starbucks and Canada’s economic growth from the time the company started its business in Canada. The second limitation of the methodology is that it somewhat lacks descriptive (qualitative) aspect of research. It could have been enhanced by performing informational analysis of the company’s reports to highlight and discuss factors that affected its business in Canada and also review strategic changes made by the management to deal with the challenges faced by the company in the last 13 years. The third limitation is that there is no comparative analysis carried out in this report, which means that there is low generalizability of results obtained from statistical testing of data.
This limitation could be overcome in a future study by including other companies in the sample, for example, McDonald’s or KFC that are leading international food companies operating in Canada. There are other microeconomic and macroeconomic factors such as governmental policies, inflation, FDI, and consumer spending, etc. that also affect the performance of companies operating in a country. Therefore, any future study could include these factors in the model to investigate the relationship between business performance and economic growth. Finally, it needs to be highlighted that the relationship between business performance and economic growth is two-way, which means that economic growth creates opportunities for businesses to develop that eventually contributes to the additional economic development in the future. Therefore, the same analysis could be done by considering ‘GDP per Capita’ as the dependent variable and the ‘Starbucks per Capita’ as the independent variable.
References
Bjørnskov, C. 2015. “Does Economic Freedom Really Kill? On the Association Between ‘Neoliberal’ Policies and Homicide Rates.” European Journal of Political Economy 37 (1): 207-219.
Brezina, Corona. 2012. Understanding the Gross Domestic Product and the Gross National Product. New York: The Rosen Publishing Group.
den Berg, Hendrik Van. 2017. Economic Growth and Development. Hackensack: World Scientific Publishing Company.
Fidrmuc, Jarko, and Iikka Korhonen. 2010. “The Impact of the Global Financial Crisis on Business Cycles in Asian Emerging Economies.” Journal of Asian Economics 21 (3): 293-303.
Fraser, Cynthia. 2013. Business Statistics for Competitive Advantage with Excel 2013: Basics, Model Building, Simulation, and Cases. New York: Springer Press.
Issah, Mohammed. 2017. “Role of Macroeconomic Variables on Firms’ Performance: Evidence from the UK.” Cogent Economics & Finance 5 (1): Web.
Leamer, Edward E., and Michael Storper. 2014. The Economic Geography of the Internet Age. In Location of International Business Activities. London: Palgrave Macmillan.
Marano, Valentina., Jean_Luc Arregle, Michael. A. Hitt, Ettore Spadafora, and Marc van Essen. 2016. “Home Country Institutions and the Internationalization-Performance Relationship: A Meta-Analytic Review.” Journal of Management 42 (5): 1075-1110.
McTaggart, Douglas, Christopher Findlay, and Michael Parkin. 2013. Economics. Frenchs Forrest: Pearson Higher Education AU.
Novales, Alfonso, Esther Fernández, and Jesús Ruiz. 2014. Economic Growth: Theory and Numerical Solution Methods. New York: Springer.
“Our Canadian Story.” 2018. Starbucks.ca.
Schneider, F. 2015. “Size and Development of the Shadow Economy of 31 European and 5 Other OECD Countries from 2003 to 2014: Different Developments?” Journal of Self-Governance & Management Economics 3 (4): 10-14.
Starbucks. 2017. “Starbucks – SEC Filing 10-K.” Starbucks.com.
“Starbucks Company Profile.” 2018. Starbucks.com.
Statista. 2018a. “Canada: Gross Domestic Product (GDP) per Capita in Current Prices from 2012 to 2022 (In U.S. Dollars).” Statista.com.
“Number of Starbucks Stores in Canada from 2005 to 2017.” 2018b. Statista.com.
The World Bank. 2018. “Canada.” WorldBank.org.
Trefis Team. 2016. “Let’s Look At Starbucks’ Growth Strategy.” Forbes.com.
Wojcik, D. 2016. The New Oxford handbook of Economic Geography. Oxford: Oxford University Press.
Worldometers. 2018. “Canada Population (LIVE).” Worldometers.info.
Zhou, L., and A. Wu. 2014. ” Earliness of Internationalization and Performance Outcomes: Exploring the Moderating Effects of Venture Age and International Commitment.” Journal of World Business 49 (1): 132-142.