Introduction
Significance of the Study
One of the most influential and large impact factors in wireless body area networks is the efficiency of energy consumption. This essay seeks to present an extensive study of energy consumption technologies in WBANs. This is achieved through, concerted focus on power-efficient models and battery-driven media access control layer protocols.
Research Gap
In a wireless Body Area Network, the implanted and wearable sensors/actuator devices are powered by batteries that have only limited energy capacity. The advances in battery technologies have been much slower than the recent advances achieved in the wireless communication and networks. Su and Zhang (2009) asserts that the battery capacity has further been limited by the WBAN nature constraints in size, weight and (for some implanted devices) accessibility aspects.
At the same time, due to life threatening situations, the reliability and timely delivery of vital body parameters is a critical requirement in patient monitoring (p. 424). Hence, both efficient and effective designs to prolong the lifetime of the sensor devices while guaranteeing the reliability and timely message delivery is the key design challenge in Wireless Body Area Networks.
In WBAN, it is well known that the radio transceiver requires more energy compared to all other components of the WBAN. Hence, designing energy efficient MAC layer protocols remains the main challenge in Wireless Body Area monitoring Networks (Su and Zhang, 2009, p. 424).The main constraints of WBANs are the power consumption since power supply is very limited.
Introduction to WBAN
A study conducted by the US Bureau of Census statistics revealed that, the population of elderly people is predicted to double to 70 million people by the year 2025 (in the US). A direct application of these statistics shows that, the world elderly population is expected to double itself to 761 million by year 2025 from the 375 million estimated in 1990. Further statistics by the US Bureau reveal that, healthcare expenditure in the US will triple by year 2020 to a projected $5.4 trillion from the $1.8 trillion spent in year 2004 (Ullah et al., 2010, p. 2). The overall healthcare system is indeed in an impending crisis. According to Ullah et al. (2010) one possible direction is Wireless Body Area Networks (WBANs), aimed towards providing such solutions. This makes WBANs the pinnacle of providing economical solutions to the challenges that healthcare systems face (p. 2).
The healthcare sector is increasingly investing in WBANs technology for more efficient and effective healthcare service delivery. WBANs’ wireless vital signs monitoring is one of the main areas experiencing the quickest growth in modern healthcare. This is as a result of its potential for slowing down unsustainable increase in healthcare spending, caused by a high number of people living with chronic conditions that require constant clinical management.
Latre, Braem, Moerman, Blondia and Demeester (2010) assert that WBANs consist of a set of tiny portable communication devices, two types of which can be distinguished: sensors and actuators (p. 2). The sensors, e.g. as pulse oximeter or accelerometer sensor, are either external or internal. The internal sensors are called implantable medical devices (IMDs). These have been partially or totally produced into the human body, either surgically or medically. The latter have proven to be remarkably successful in the treatment of many diseases. Wireless Body Area Networks are used to monitor IMDs, providing services such as management of chronic disease, and medical diagnostics.
These allow, automatic collection of data from the patient, integration of the data into the patient’s medical records, processing of the data and issuing a recommendation when necessary. As opposed to the sensors, which are collecting data, the actuators (or actors) take specific actions according to the data received from either the sensors or through interaction with the user. This could be combined with glucose level sensors and a Smartphone, serving as a sink for the sensors’ data. The actuator would then administer the correct dose of insulin and inject it to the diabetic patient (Latre et al., 2010, p.2)
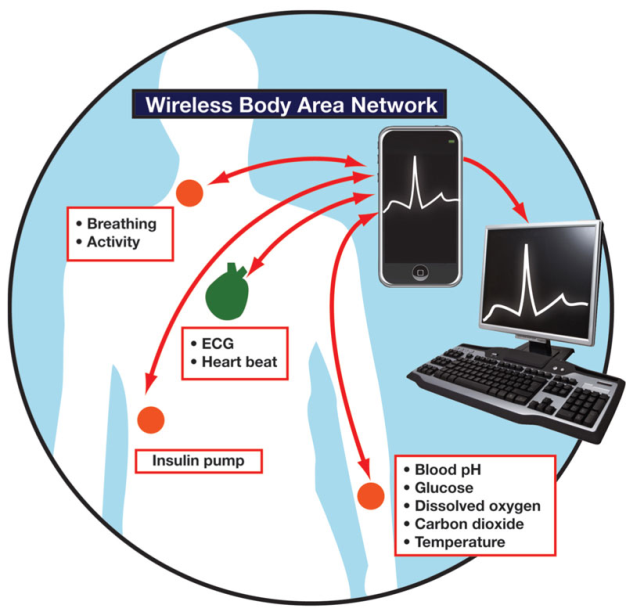
The whole system collects relevant data, takes the appropriate actions and updates the patient’s medical records to the main server – all in real time. Continuous monitoring of patients life signs, and analyzing signal patterns that enable early detection of dangerous medical conditions result in a more effective treatment and minimization of hospital stays. In addition, the long-term life sign data could improve the patient’s diagnosis when ill.
Much of the worldwide deaths are attributed to cardiovascular disease, making it a serious cause of death globally. Every day many people die out of an arrhythmogenic event, which is generally preceded by irregular heartbeat, accompanied later on by a heart attack. WBANs can monitor irregular heartbeats before they turn into deadly heart attacks. Rather than staying at home or hospital for observation, WBAN enables long term monitoring of patients health parameters as the patient engages in normal daily life activities (Ullah et al., 2010, p. 3).
Moreover, in Latre et al (2010) study, the authors articulate how other implants can be used in other areas, for example to restore control over paralyzed limbs, bowel muscle control, maintain regular heart rhythm, and many other functions. These implants improve the quality of life for many patients. Emergence of wireless on-body network or a Wireless Body Area Network would enable us to fully exploit m-Health (p. 1).
The body area channel is very different from other wireless channels, in the sense that the antenna-human body interaction is an integral part of the channel. Propagation in WBAN is indeed confined within a limited range around the human body where transmitters and receivers are almost co located to each other. Body area networks address a technology segment not currently covered by existing connectivity standards, and that is for two reasons.
First reason is that each of the miniature sensors and actuators nodes of a WBAN should have its own energy supply for autonomous operations. Therefore, in order to provide longer monitoring time frame, the energy consumption of these miniature sensors is optimized so that the battery does not need to be changed often. The second reason is that the nodes should be intelligent enough to perform their tasks and communicate with each other. Consequently, WBAN’s main objectives can be formulated as following:
- To provide an infrastructure for intelligent, miniaturized, low power, invasive and non-invasive sensor nodes, allowing them to monitor body function and the surrounding environment.
- To supply a communication channel between noninvasive/wearable devices and a base station.
- To ensure a broad range of data rates at lower power consumption rate.
- To guarantee that wireless communication Quality of Service (QoS) can be quantitatively pre-defined, while explicitly assuming that the range to be covered is limited to the immediate environment around and within a person’s body.
In this essay, we deal mainly with the issue of energy consumption in Wireless Body Area Networks. The essay analyzes energy consumption in WBANs in three major aspects, each of which is assigned a solitary chapter. Firstly, we are going to look into Power models in the WBANS, while focusing on Beacon-mode and Carrier sense multiple accesses with collision avoidance (CSMA/CA) mode access schemes (Cheng and Huang, 2008, p. 2).
Secondly, we’ll examine a device introduced by Yan, Zhong and Jha (2007) known as the wireless device driver which is an energy-efficient computing model for low-duty cycle peripherals (p. 1). Finally, we will observe power saving Media Access Control (MAC) layer protocols. Four different protocols of different techniques are introduced, while considering various aspects of their design and implementation, such as electrochemical battery properties, time-varying wireless fading channels, and packet queuing characteristics, different types of data, communication reliability, and throughput (Su and Zhang, 2009, p.1).
In analysis of power consumption in the model for beacon-mode and CSMA/CA-mode access schemes used in WBANs, we take into account two types of network nodes collisions. The first type is a conventional one – collisions from intra-network nodes. The other, not so obvious type, relates to collisions caused by nodes from different moving WBAN groups. The analysis of these types in the relevant chapter is followed by discussion of a hybrid-mode access scheme with two multi-WBAN groups’ advantages: over 60% power consumption in beacon-mode, and double node capacity in CSMA/CA-mode at a manageable power consumption level (Cheng and Huang, 2008, p. 1).
When covering the wireless device driver – an energy-efficient computing model of a WBAN network topology, we’ll see that it’s method of operation is such that, many low-duty peripheral nodes communicate with a more powerful central device. In our essay, the model will be compared to two WBAN technologies, Bluetooth and ZigBee, in terms of cost of design, performance/effectiveness, and energy efficiency.
The comparison is continued by an in-depth review of techniques that ensure efficiency in energy consumption while meeting connection latency requirements. We’ll begin by low-level inspection of the impact on energy consumption of several tunable parameters of the wireless device driver. Then continue by higher level inspection of the connection latency VS energy consumption trade-off impact on address dynamic resource management. Finally, we end the chapter by proposing an upper level energy-efficient power down policy and adaptive connection latency management technique, which was recently invented (Yan et al., 2007, p. 1).
As stated earlier, an analysis, of energy consumption in low-power MAC layer protocols, designed and implemented in WBANs is carried out in the essay.The essay will contemplate and compare four different techniques.
The first is oriented towards beacon-enabled ZigBee, Preamble Based Time Division Multiple Access (PB-TDMA), and Sensor-MAC (S-MAC) controlled in-body and on-body sensors. This technique introduced by Ullah, An and Kwak (2009) uses traffic-based wakeup mechanism for WBANs and achieves power efficient and reliable communication via exploiting the traffic patterns of the body sensor nodes (BSNs) to accommodate the entire BSN traffic. Logical connection between different BSNs is enabled through working on different frequency bands by a method called bridging function. The latter integrates all BSNs working on different bands into a complete BSN (p. 336).
The second technique introduced by Omeni, Wong, Burdett and Toumazou (2008) fits WBANs with an architecture, where the by the body-worn node (slave) periodically sends sensor readings to a central node (master). The nodes in this network are not deployed in an ad hoc fashion, but rather join the network in a centrally controllable way. Communications of such networks are usually single-hop. The sensor nodes are asleep until the centrally assigned time slot arrives. No collision of a node within a cluster can occur. A clear channel assessment algorithm is applied to manage collisions with nearby transmitters. Time slot overlaps are handled by wakeup fallback time. This technique has significant energy reductions when compared to more general purpose network MAC protocols such as Bluetooth or Zigbee (p. 252).
The third technique introduced by Marinkovic, Popovic, Spagnol, Faul and Marnane (2009) is best for devices measuring physiological signals such as EEG and ECG over fixed topology WBANs.Power consumption and battery life are estimated by duty cycle calculations and validated through measurements. The results show that the protocol is energy efficient for both streaming communication and short transmissions of data bursts (p. 915).
The fourth technique is a cross-layer based and battery-aware MAC layer set of protocols for WBANs. Here we consider the battery internal properties, time-varying and wireless fading channels and packet queuing characteristics. As a result we achieve prolonged the battery lifespan of the wireless sensor nodes, while guaranteeing reliable and timely message delivery, which is critically important for WBANs. The obtained results, both analytical and simulation show that the proposed schemes can reduce energy consumption significantly in wireless body-area monitoring networks (Su and Zhang, 2009, p. 424).
Literature Review
According to the discussed above, energy efficiency is a major challenge in WBANs design. Long- duration networks are essential in medical applications. For example, an endoscopy capsule needs approximately 12 hours to transmit images from the internal organs of the inner body, while a heart patient may need daily or monthly ECG monitoring (Cheng and Huang, 2008, p. 1). Many factors, such as collision, overheating, over-emitting, packet overhead, etc. can cause inefficient energy consumption in WBANs. These factors can be classified into categories, such as network topology, communication protocols, and power schemes and so on.
Various studies of different aspects of WBANs have been carried out in numerous literatures to eradicate, or at least minimize, these shortcomings towards increasing the lifetime duration of a WBAN. Several of these literatures have been chosen for this essay. Each of the chosen papers and a summarized indication of their relevancy to the essay are as mentioned.
WBANs SURVEY
In this survey by Ullah et al (2010), the authors discuss the fundamental mechanisms of WBANs including architecture and topology, wireless implant communication, low-power Medium Access Control (MAC) and routing protocols. A comprehensive study of the proposed technologies for WBAN at Physical, MAC, and Network layers is presented and many useful solutions are discussed for each layer (p. 1).
This study is considered relevant to the essay due to the fact that in the system architecture of the PHY layer different methodologies of wireless communication are reviewed, along with a conclusion. The study proposes low-power MAC protocol for WBAN followed by important suggestions. For the Network layer, the possible network topologies for WBAN are discussed, taking into account the required energy efficiency and reliability. A classification of existing routing strategies is given for future research directions.
Finally, numerous WBAN applications are highlighted. These applications include in-body applications and on-body applications. Examples of in-body applications are monitoring and program changes for pacemakers and implantable cardiac defibrillators, control of bladder function and restoration of limb movement. On-body medical applications include monitoring ECG, blood pressure, temperature, and respiration (Ullah et al., 2010, p. 25).
A survey on wireless body area networks
According to a survey on WBANs carried out by Latre et al. (2010), the network consists of various sensors attached on patient’s clothes, body or implanted under the skin. The survey focuses on patient monitoring applications with special interest (p. 3).
This study focuses on three main heterogeneous devices used within WBANs, these are; Wireless sensor nodes, wireless actuators nodes and wireless personal devices (PD). The survey considers three domains of energy consumption: sensing, wireless communication, and data processing by the specific absorption rate (SAR) (Latre et al., 2010, p. 4). This survey is most relevant to this essay due to its analysis of the three energy consumption sources stated
Moreover, Latre et al (2010) considers factors in WBANs that cannot be compromised even for energy efficiency; these factors are quality of service, reliability, usability, security and privacy (p. 4). The survey discusses open research issues in current and past research on WBAN on main challenges like, the restricted energy consumption in wireless body area networks.
Power Model for Wireless Body Area Network
An analytical study on power consumption in WBANs was carried out by Cheng and Huang (2008). According to the authors, WBAN consists of a central processing node (CPN) and wireless sensor nodes (WSNs). Each WSN constantly transmits monitored signals from body to CPN while the CPN forwards these signals to the hospital. During the long-term monitoring and transmitting data, low power WSNs becomes a crucial issue in WBANs. On the contrary, the power efficiency of CPN is less important than that of WSNs. CPN in WBAN can be implemented in a smart phone or notebook with plug-in power or much larger battery than WSNs. Thus, the major issue in WBANs is how to save the power of WSNs (p. 1).
This Cheng and Huang’s study is relevant to this essay especially due to the fact that in their study they identified the sources of power consumption in a conventional sensor network, to include idle listening, control messages, collision, packet forwarding and overhearing. In their study, however, Cheng and Huang reasonably decide to ignore some of this energy inefficiency sources in WBANs. According to their paper, low power MAC layer for ad-hoc routing networks is not necessary, since WBANs can be formed by a single-hop star network. As a result, packet forwarding is ignored. The study considers Low Rate Wireless Personal Area Network (LR-WPAN), which is a candidate of WBAN with a transmission range of 3-10 meters, to cover the human’s body via single hop star topology.
Over hearing and idle listening are ignored for the imbalanced traffic load of WBANs. Imbalanced traffic load in WBANs occurs where WSNs continuously transmits vital signals to CPN, while CPN transmits only a few controlled packets to WSNs. Since overhearing and idle listening are associated to receivers only, whereas WSN is designed as a transmitter, idle listening and overhearing are ignored in low power WSN design. Also, energy consumed on control messages can be ignored when the data volume is larger than the control message. Their study considers collision as the only major source of energy efficiency to be investigated. Thus, the study focuses on beacon-mode and CSMA/CA mode access schemes to achieve energy efficiency (Cheng and Huang, 2008, p. 2).
A study carried out by Yan et al (2007) investigates an energy-efficient computing model called wireless device driver, for communication between low-duty peripherals, sensors and other I/O devices employed in a WBAN, and a more powerful central device. They present an extensive comparative study of two popular WBAN technologies, Bluetooth and ZigBee in terms of design cost, performance, and energy efficiency. The study discusses the impact of tunable parameters of the wireless device driver on connection latency and energy consumption for both Bluetooth and ZigBee.
Dynamic resource management in higher-level protocols is addressed by investigating the trade-off between connection latency and energy consumption. An energy-efficient power down policy that utilizes the interval between consecutive connection requests for energy reduction is proposed.
The study analyses an adaptive connection latency management technique. The technique adjusts various tunable parameters dynamically to achieve minimum connection latency without changing the energy consumption level. This study was especially considered and applied in this essay due to the exceptional measurements and experimental results of the proposed techniques, which appeared to be very effective in reducing energy consumption, while meeting connection latency requirements (Yan et al., 2007, p. 1).
A study by Ullah et al. (2009) analyzes the behavior of several power-efficient MAC protocols including a beacon-enabled protocol for on-body sensor networks. It classifies the entire traffic in BSN as normal, on-demand, and emergency.
Traffic based Wakeup Mechanism is proposed for BSNs which exploits the traffic patterns of the BNs to accommodate the entire traffic classification. A Bridging function that integrated all the body area network (BAN) nodes working on different Physical layers (PHYs) into a complete BSN is introduced.
The study is relevant in this essay since it proposes a wakeup mechanism, backed by the Bridging function, providing a complete solution towards power-efficient and reliable communication in a BSN (Ullah et al., 2009, p. 343).
According to this study by An et al. (2010), MAC layer is the most suitable level to address the energy efficiency. The fundamental task in MAC protocol is to maximize energy efficiency through avoiding collisions and preventing simultaneous transmissions, while preserving maximum throughput, minimum latency and communication reliability in WBANs (An et al., 2010, p. 739).
This study by Omeni et al (2008) proposes an energy efficient MAC protocol designed specifically for WBANs. The study considers wireless sensor nodes in WBANs, attached to the human body, monitoring vital signs such as body temperature. Unlike in traditional wireless sensor networks, the nodes in this network are not deployed in an ad-hoc fashion.
The network applies a master-slave architecture, whereby the body-worn slave node periodically sends the collected data to a central master node. The network is centrally managed and all communications are in single-hop fashion. To achieve energy efficiency, all sensor nodes remain in standby/sleep mode until the relevant, centrally assigned, time slot arrives. Once a node joins a network, there is no risk of collision since communication is initiated by the central node and addressed uniquely to a slave node. To handle time slot overlaps, the wakeup fallback time concept is introduced.
Application of single-hop communication and centrally controlled sleep/wakeup times results in significant improvement in energy efficiency in this application compared to more “flexible” network MAC protocols such as Zigbee. As duty cycle is reduced, the overall energy consumption approaches the standby power (Omeni et al., 2008, p. 251).
This study was considered and applied in this essay due to the study’s primary design goal which is low power consumption in WBANs. This objective is achieved via a focus on collision avoidance and other primary sources of energy wastage and the use of centrally controlled time slotting for sensor nodes. Through application of this protocol, many of the traditional problems that plague wireless sensor networks have been eliminated or significantly minimized. Idle listening and over-hearing are not an issue in this protocol since traffic is managed centrally. Such factors have immensely improved energy efficiency in WBANs (Omeni et al., 2008, p. 251).
Battery-Dynamics Driven TDMA MAC Protocols for Wireless Body-Area Monitoring Networks in Healthcare Applications
This analytical study on power consumption in WBANs was carried out by Su and Zhang (2009). According to their study, due to advances in system integrations, sensors can be applied in different body locations. However, implanted and wearable devices can cover all needs that include, interacting with the user and communicating. Thus, sensor devices usually communicate with a wearable or near body co coordinator. The coordinator analyses the collected data and transmits it to the hospital network via the internet. Coordinators batteries are not as restricted to size and shape as those in implanted and wearable devices.
However, batteries in implanted and wearable devices have a very limited energy capacity and require practical diminution, as much as possible, of their usage. This study is especially relevant to this essay due to its competent consideration in efficient utilization of battery capacity in sensor nodes to prolong the life time of sensor nodes, along with guaranteeing reliability and timely message delivery as the most crucial goal in WBANs design (Su and Zhang, 2009, p. 424).
A study by Marinkovic et al. (2009) is applied in this essay since it proposes an energy efficient medium access control (MAC) protocol for WBANs. According to their study, advancement in storage and wireless technologies have increased the number of recording devices with the ability of monitoring patients outside a clinical setting. These devices stream data from the patient to the central storage device.
Due to high power consumption of data transmission, the low battery life places a strict limit on many further processes the device could perform.The study suggests solutions to synchronization problems in TDMA. It evaluates the duty cycle of transmitters, consequently predicting battery life. These will reduce transmission, storage and workload on the medical staff and put the sensors in a more suitable position to perform more signal analysis. The protocol proposed by the study capitalizes on the static nature of WBANs to implement TDMA strategy with minimal overhead and idle listening (Marinkovic et al., 2009, p. 915).
Credibility Issues
To ensure authenticity of all data applied in this study; all primary and secondary sources have been derived from or authenticated by Institute of Electrical and Electronics Engineers (IEEE). All studies applied in this essay were vetted and selected after satisfying preset criteria which are:
- Studies considered must be reviewed and approved by the supervisor of this essay Dr. Zeev Weissman, as well as the Departmental Master’s degree committee of the Open University of Israel within the relevant field.
- Studies considered must be relevant to the main issues of the essay: energy consumption in wireless body area networks.
- Studies considered must be written in a clear, non-offensive and scientific manner, as the academic ethics demands.
- The referenced studies must be up to date (2008-present). However, other studies applied for either enquiry or comparison purposes are not asserted to these restrictions.
- The studies must contain concrete theoretical or practical experiments to support the proposed or working hypothesis.
Power Model for Beacon-Mode and Csma/CA-Mode
Introduction
WBAN is a short distance wireless transmission for near or inner body applications which has become an emerging wireless system in recent years. Although conventional cabling monitors can achieve the same objective, one major drawback of cable monitors is limiting patients’ movements and activities. On the contrary, WBAN can monitor patients and collect appropriate measurements without these limitations.
However, WBANs are not without shortcomings. Due to limited energy supply in WBANs, the key design challenge of WBAN is low power, which is essential for long-duration measurement. Thus, the low power mechanism that involves MAC, baseband chip and wireless front-end designs have become critical in WBANs. Although the WBAN is a subset of wireless sensor network, many features of WBAN make the low power strategy of MAC design different from the conventional sensor network (Cheng and Huang, 2008, p. 1).
Acording to Ullah et al. (2010) Generally MAC protocols are grouped into contention-based and schedule-based MAC protocols. CSMA/CA protocol is categorized as a contention-based MAC layer protocols. CSMA/CA nodes contend for the channel to transmit data. If the channel is busy, a node defers its transmission until it becomes idle. Contention-based protocols are scalable with no strict time synchronization constraint. However, they incur significant protocol overhead. As opposed to contention-based protocols, in schedule-based protocols such as the TDMA protocol, the channel is divided into time slots of fixed or variable duration. These slots are assigned to nodes and each node transmits during its own slot period. These protocols are energy conserving protocols (p. 10).
The most important attribute of a good MAC protocol for WBAN is energy efficiency. In some applications, the device should support a battery lifetime of months or years without interventions, while others may require a battery life of tens of hours due to the nature of the applications. For example, pacemakers have a lifetime of more than 5 years while swallow able camera pills have a lifetime of 12 hrs. Power-efficient and flexible duty cycling techniques are required to solve the idle listening, overhearing and packet collisions problems.
Moreover, low duty cycle nodes should not receive frequent synchronization/control packets (beacon frames) if they have no data to send or receive. The MAC layer protocolsof WBAN should satisfy the MAC transparency requirements, i.e., to operate on multiple physical layerbands, such as Mobile Information and Communication Systems (MICS), Industrial Scientific and Medical (ISM) and Wireless Medical Telemetry Service (WMTS), simultaneously (Ullah et al., 2010, p. 10).
Since most of the traffic in WBAN is correlated, a single physiological fluctuation triggers many sensors at the same time. In this case, a CSMA/CA protocol encounters heavy collisions and extra energy consumption. In CSMA/CA protocol the nodes are required to perform the, so called, Clear Channel Assessment (CCA) before transmission, that is to determine whether the wireless medium is ready and able to receive data, so that the transmitter may start sending it. Using CCA in an ordinary wireless network is, at some point, security vulnerability due to a Denial of Service (DoS) attacks, such as Queensland attack, which makes it appear that the airwaves are busy, stalling the whole system.
Although WBANs are less likely to suffer from such attacks, stillthey have another factor that prevents from the CCA from guaranteed in the MICS band.This is the tissue heating of the human body, which causes the path loss inside the human body to be much higher than in free space. In the Contention-based mechanism, nodes contend for the channel to transmit data regardless of any predefined schedule; making the CSMA/CA protocol the best example of such mechanism (Ullah et al., 2010, p. 11).
In a survey by Ullah et al. (2010), an IEEE 802.15.4 MAC protocol is proposed. This protocol has two operational modes: a beacon-enabled mode and a non-beacon enabled mode. In a beacon-enabled mode, the network is controlled by a coordinator, which regularly transmits beacons for device synchronization and association control. The channel is bounded by a superframe structure which consists of both active and inactive periods.
The active period contains the following three components: a beacon, a Contention Access Period (CAP), and a Contention Free Period (CFP). The coordinator interacts with nodes during the active period and sleeps during inactive period. There are no more than seven Guaranteed Time Slots (GTS) in the CFP period to support time critical traffic. In the beacon-enabled mode, a slotted CSMA/CA protocol is used in the CAP period while in the non-beacon enabled mode, un slotted CSMA/CA protocol is used. Some of the main reasons of selecting IEEE 802.15.4 for WBAN are low power communication and support of low data rate WBAN applications.
The study investigates the performance of the non-beacon IEEE 802.15.4 protocol for low upload/download rates (mostly per hour). It concludes that implementing the protocol results in 10-15 years sensor lifetime for low data rate.The study also analyzes the behavior of slotted and un-slotted CSMA/CA mechanisms and concludes that the un-slotted mechanism performs better than the slotted one in terms of throughput and latency, yet at the expense of high cost of power consumption (Ullah et al., 2010, p. 14).
In super frame structures where each super frame consists of a beacon, with an active period, and an inactive period. Ullah et al. (2010) asserts that the beacon is used to indicate the length of the frame period and helps in estimating the channel information. The sensor nodes receive the beacons periodically and subsequently transmit data in the active period. No data transmission takes place in the inactive period (p. 14).
This chapter is based on a study carried out by Cheng and Huang (2008) on power models in Wireless Body Area Networks. In their study, an analytical power consumption model for beacon-mode and slottedCSMA/CA mode access schemes is developed for a WBAN. The study considers conventional collision from intra-network nodes, while it also investigates the collision caused by the nodes from different moving WBAN groups. The analysis identifies the need of having a hybrid-mode access scheme with at least 63.4% power consumption of beacon-mode, and double WBAN user capacity of slotted CSMA/CA-mode, to support multi-WBAN groups at a manageable power consumption level (Cheng and Huang, 2008, p. 1).
Other relevant studies that challenge and support the main study are identified and discussed in the chapter in a bid of coming up with a logical and practical conclusion regarding the power model under discussion.
In Depth Review
Power Model for Wireless Body Area Network
According to the study by Cheng and Huang (2008), WBAN is a sensor network that continuously monitors vital signals for further diagnosis. A WBAN consists of a CPN and several WSNs. Each WSN continuously transmits monitored signals from body to CPN while the CPN forwards these signals to hospitals or clinics. During the long term monitoring and transmitting of data, low power WSN becomes a crucial issue in WBAN. The power efficiency of CPN is less important than WSN. This is because CPN in WBANs can be implemented in a smart phone or notebook with plug-in power or much larger battery than WSNs.
Hence, how to achieve power efficiency in WSNs is the major issue in WBAN designs. Low power MAC is one of the solutions to decrease power consumption of the sensor nodes. Some low power MACs are proposed for conventional sensor networks. However, these approaches are seen as sub optimized solutions since this study considers collision as the only major cause of energy consumption in WBANs out of all other sources. All other sources of energy consumption in WBANs are ignored by this study (Cheng and Huang, 2008, p. 2).
Several other sources of energy consumption in a WBAN ignored by the study, for example overhearing, idle listening, control messages, and packet forwarding.Here’s a brief description of the above. Overhearing means that, a node wastes energy to receive packets that do not belong to the nodes. These packets must be dropped and thus energy is wasted. Idle listening, occurs when the receiver listens to the channel for possible transmission but the transmission does not happen.
Thus, the power for the channel listening is wasted. Control messages means messages which do not carry data but control other messages. Packet forwarding happens when a router spends energy to forward packet for other nodes. The only source considered by the study is collision. Collision takes place when more than one packet transmits data at the same time. The collided packets have to be retransmitted, while this consumes extra energy (Cheng and Huang, 2008, p. 2).
According to Cheng and Huang (2008) the four mentioned sources of energy consumption in WBANs are ignored for these reasons: Packet forwarding is ignored because the transmission range of LR-WPAN (a WBAN candidate) can be as short as 3 to10 meters to cover the human body. As a result, WBANs that can be established as a single-hop star topology, revoking the need inmultiple hops solution such as routing. Overhearing and idle listening are ignored because of traffic load in WBANs. WBAN has an imbalanced traffic load, since WSNs continuously transmit vital signals to CPN, while CPN transmits only few control packets to WSNs.
Since overhearing and idle listening are associated to receiver only and WSN is mainly used as a transmitter, overhearing and idle listening can be ignored in low power WSN design. The energy spent on control messages can be ignored when data volume is much larger than the control message (p. 2).This study shows that power waste through packet collision is the only common issue in MAC designs of conventional sensor network and WBAN. In addition, a new source of collision due to the mobility of WBAN is required to be considered while two unsynchronized WBANs encounter each other (Cheng and Huang, 2008, p. 1).
Cheng and Huang (2008) assert that Collisions in WBAN are divided as intra and inter network collisions (IANC and IRNC, respectively). In a conventional sensor network, scheduling and contention-based access methods are the two major medium access strategies that resolve IANC. In Scheduling-based protocol, the transmission time of different nodes in the same network are interleaved to avoid collision by using the beacon message.
As opposed to scheduling-based access, the contention-based protocol, like the slotted CSMA/CA, avoids collisions by using detection-back off- transmission procedure. If a node senses a busy channel, it performs the back off-detection procedure until an idle channel is available and thus collision in the intra network is avoided (Cheng and Huang, 2008, p. 2). However, the collisions in WBAN come from not only the intra networks but also inter networks. The IRNC frequently happens due to the moving nature of WBANs. Since WBAN moves with the patient wherever he goes, nodes in different WBANs may collide with each other when people carrying WBANs walk side by side.
Since nodes in a WBAN do not synchronize with each other, slotted CSMA/CA needs to solve both IANC and IRNC. Moreover, the beacon mode, which solves the IANC case issue by sending beacon messages, still needs to handle the IRNC case issue. The power consumption, due to IRNC and IANC issues, is the main problem of the low power WBAN study. Due to this reason, the study focuses on IRNC and IANC in its power model derivation (Cheng and Huang, 2008, p. 2).
In the process of a (new) hybrid power model derivation, Cheng and Huang (2008) carry out a comparative analysis between beacon mode and slotted CSMA/CA mode.The WBAN power model considers a fully connected network with several simple-star WBANs with a number of WSNs per WBAN. The WSNs continuously transmit the monitored signals to CPN. In practice, these could, for instance, be a collection of heart signals for specific disease monitoring. The hybrid WSN power model is formulated by three steps. The first is calculating the energy consumption per packet for both slotted CSMA/CA mode and beacon mode.
Next, the power consumption is related to the throughput. While the last step is introducing a hybrid access mode power model, conducting a simple case study and predicting the performance of WBAN. It is important to say at this point that this several calculations of Cheng and Huang’s (2008) study that appear below were significantly completed by the author with more detailed explanations, mathematical manipulations, approximations, elimination of inaccuracies, etc.
The following tables of symbols are common to all the calculations below:
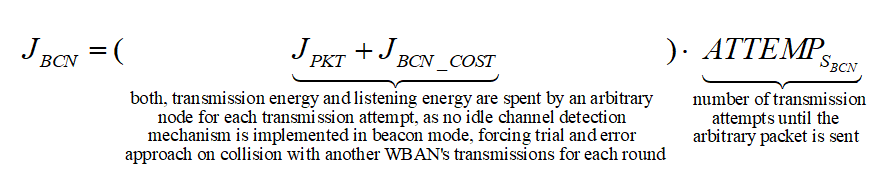
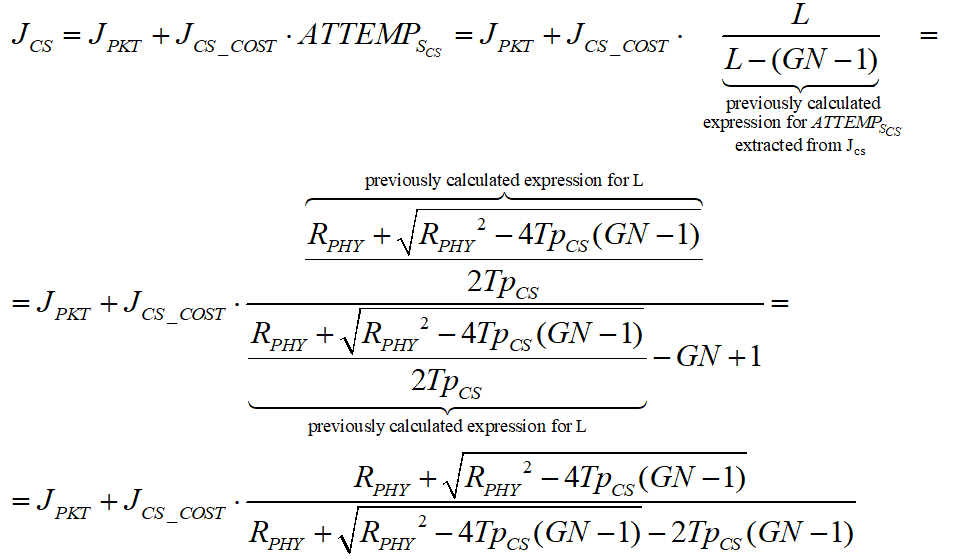
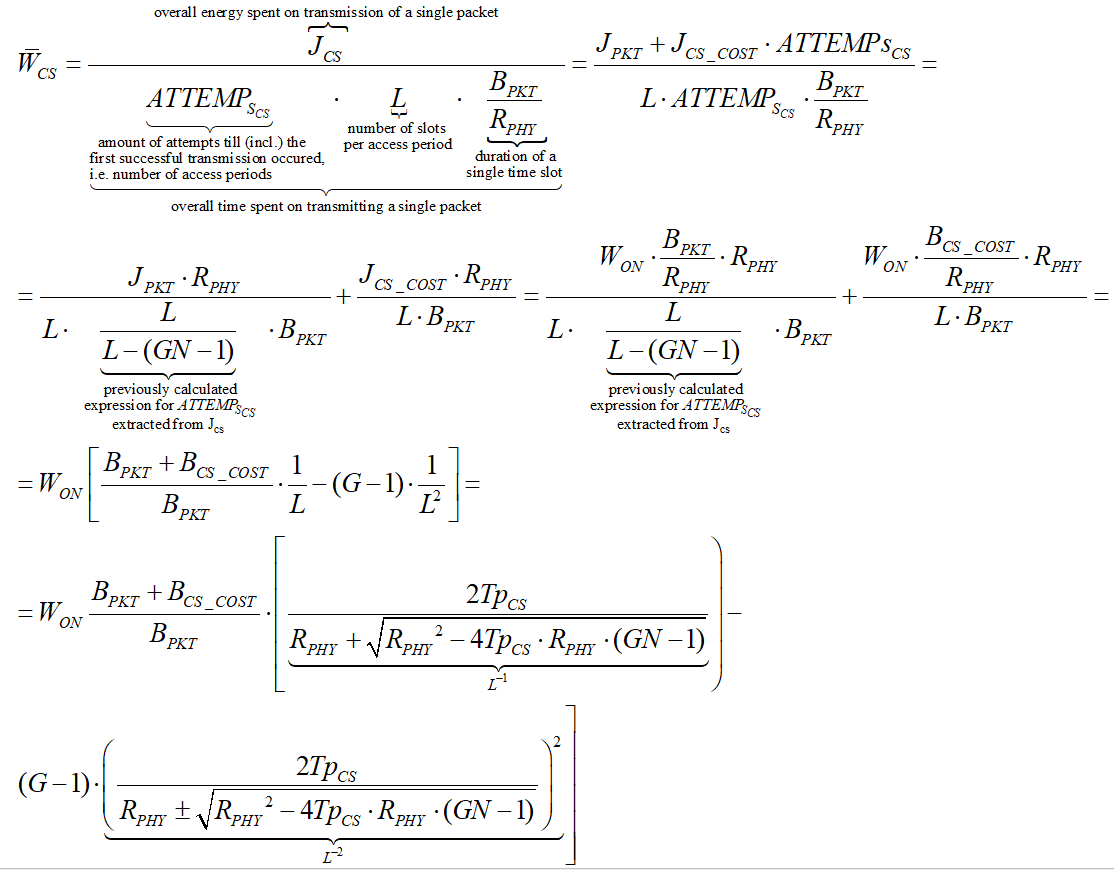
First, Cheng and Huang (2008) estimate the energy consumption per packet for slotted CSMA/CA and beacon modes. For slotted CSMA/CA mode the duration of single access period is equal to one contention period. Also, slotted CSMA/CA may need more than one attempt and backoff mechanisms to void collision. Consequently, each node repeatedly detects an idle channel until found, transmitting when it occurs. If the channel is busy, the node backs-off to the next contention period (Cheng and Huang, 2008, p. 2). Hence, the energy spent on transmission of an arbitrary single packet by an arbitrary single node can be expressed by the following expression:
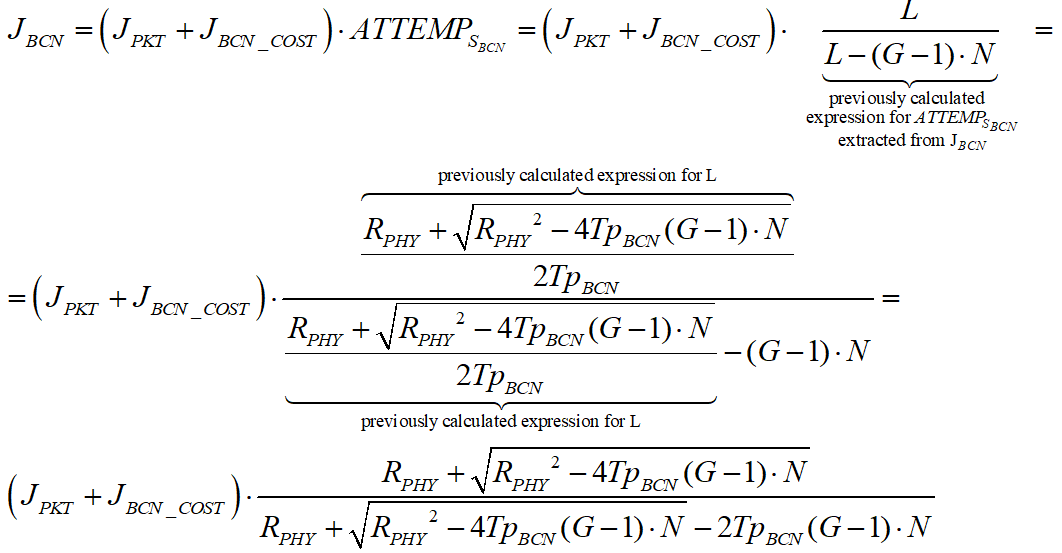
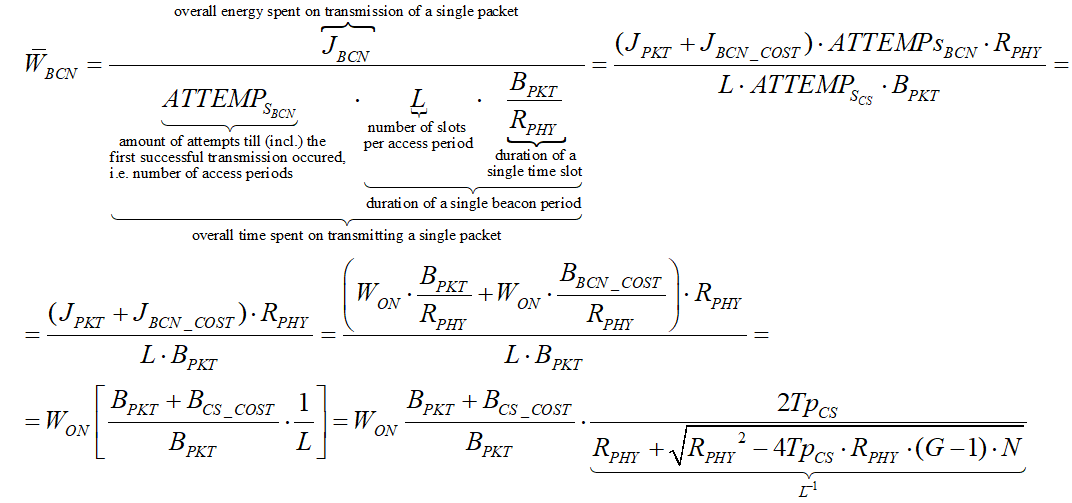
As for the beacon mode, IANCs are resolved by allocating separated time slots to different WSNs. Since this is the case, there’s no energy spent on trying to get an idle channel. Instead, there is a cost of listening to the channel. The access period slots are equally (uniformly) assigned for each node. Thus, IANCs cannot occur at all, while IRNC could only occur if several nodes from different networks have been assigned the same slot. The expression for energy per packet is:
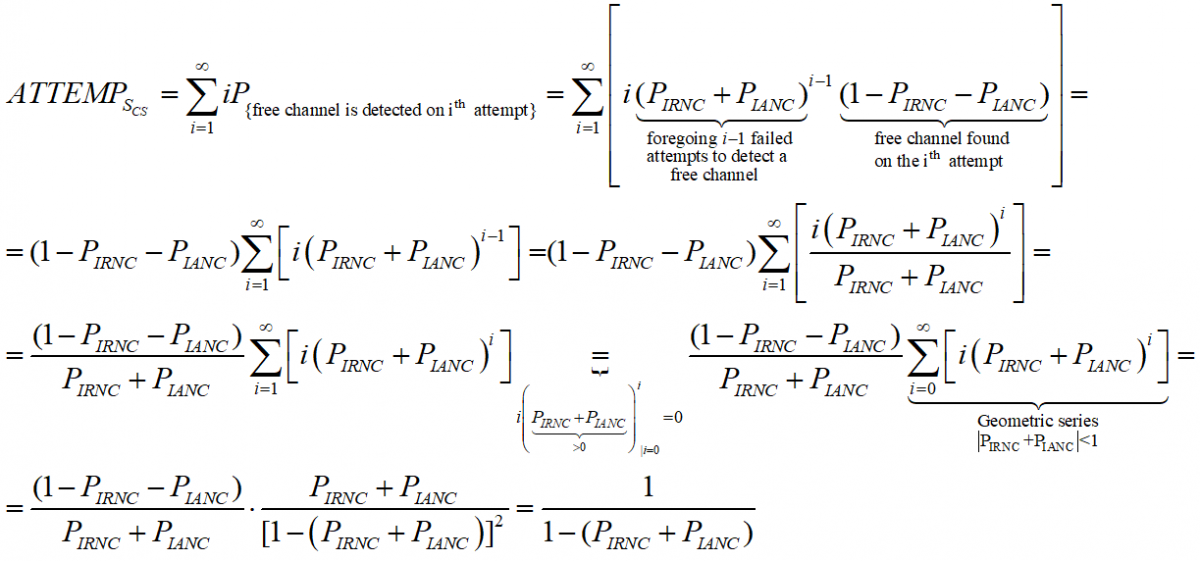
Being an expectation of contention periods before successful transmission ATTEMPscs can be decomposed, using the probabilistic expectation formula on the number of finding attempts of a free channel (until detected), as following:
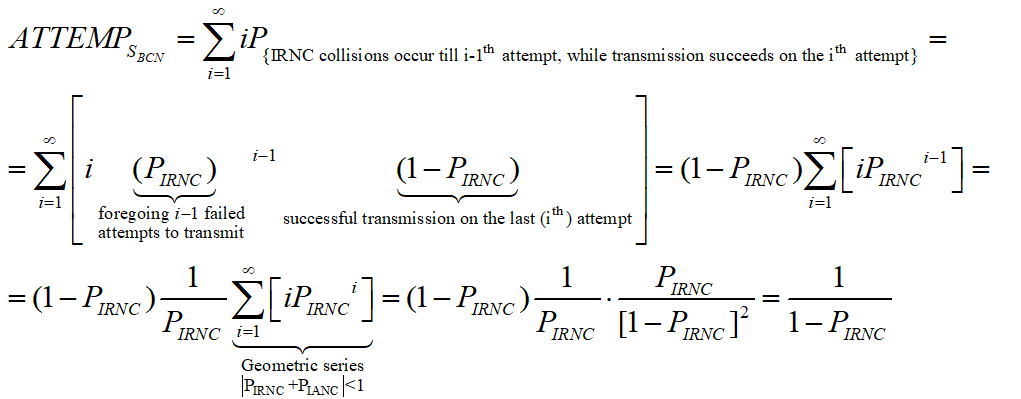
While ATTEMPsBCN can be decomposed as:
The authors apply probability theory again to express the probability of intra and inter network collision via the number of WBANs, number of WSNs and access period length. An IANC is an intra network collision, i.e. a collision that is caused by at least two nodes ofasingle network, transmitting on the same time slot.Hence, when looking at an arbitrary node of a WBAN, the probability of having an IANC could be calculated as follows:
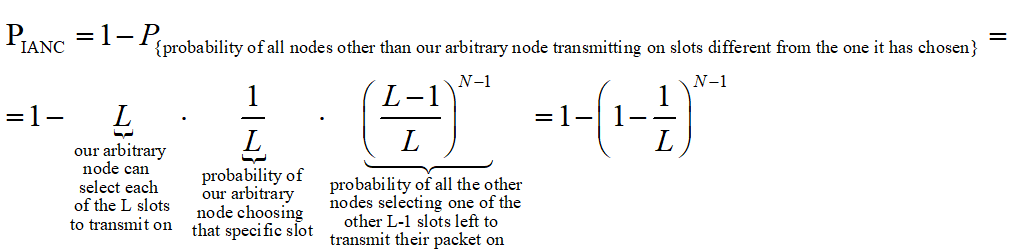
As opposed to IANC, an IRNC collision occurs between nodes of different WBANs. Same as before, we’re looking at an arbitrary node of a single WBAN. The probability of this node to collide with a node of another WBAN, transmitting at the same time, thus causing IRNC to occur is:
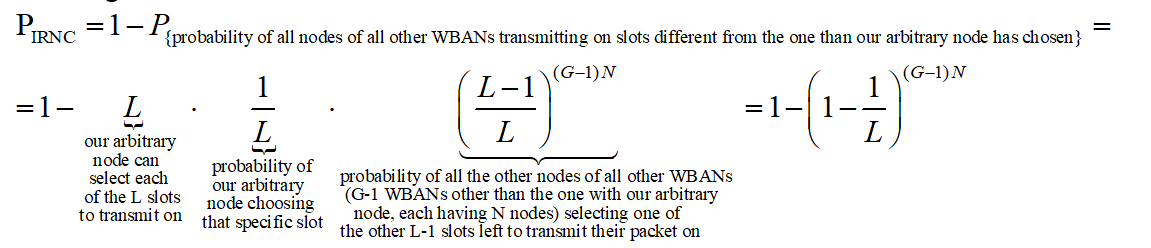
As the expressions we got for PIANC approx and PIRNC approx are algebraically cumbersome, we would like to simplify them, while still having sufficient accuracy. The methods (implicitly) implied from the results of Cheng and Huang (2008) are the following: First, considering the nature of PIANC and PIRNC as functions of L , we compute PIANC approx and PIRNC approx , which are linear approximation of the above. Then, with regards to the fact that the number of slots per access period is ordinarilyvery large, we compute the expressions for PIRNC approx by finding the limit value of the algebraic expressions of PIANC approx and PIRNC approx ,where L → ∞.
Having the two functions:
 and
and 
We make the substitution x=1/L and define the functions:
 and
and 
Based on Tailor’s theorem, the linear approximation of these functions at x=0 is:
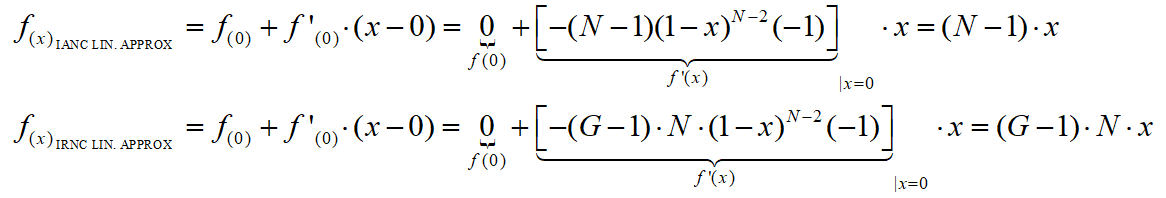
We assume the number of slots in access period and the length of beacon period large enough to consider L>>1, practically taking L → ∞ in our calculations. Thus, the linear approximation of f(x) IANC APPROX and f(x) IRNC APPROX we made for x=0 are suitable for linear approximation of PIANC for large L . Back-substitution of L=1/x provides:
 and
and 
Since our approximation for PIANC and PIRNC are accurate enough, we should from now on, for the sake of simplicity, use the notations PIANC and PIRNC instead of PIANC approx and PIRNC approx .
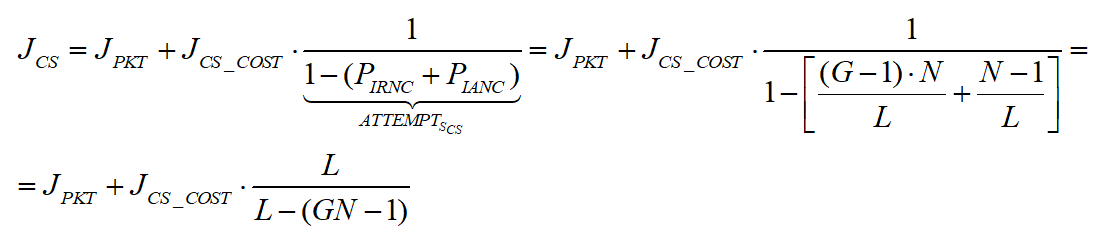
Placing our results so far in the expression of JCS and JBCD, we get the following expression for the overall energy consumed by a single node a single packet in the slotted CSMA:
And in the beacon mode:
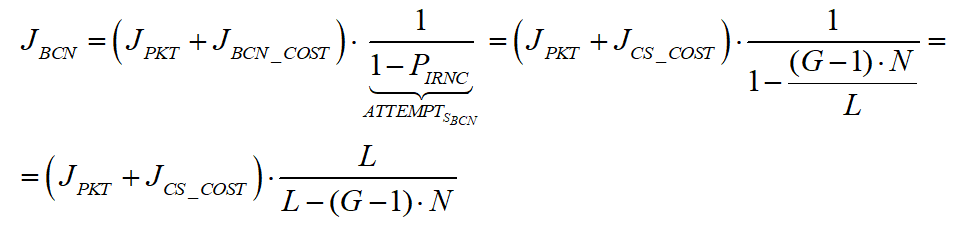
As expected, we’ve received the estimated energy consumption per packet.
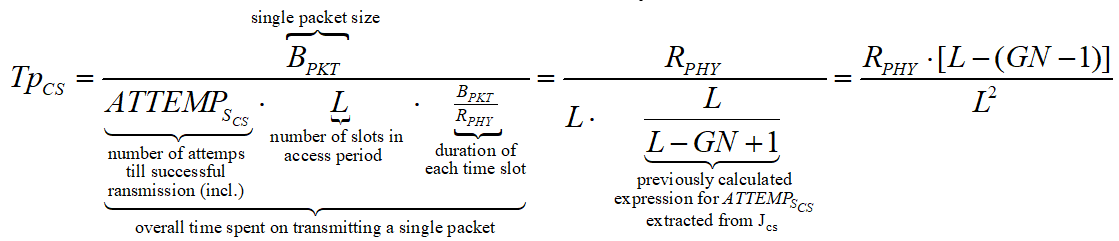
We shall now relate the received energy consumption with the throughput of WBAN, for both slotted CSMA/CA and beacon mode. We assume that all packets are of fixed and equal size (Cheng and Huang, 2008, p. 3).The throughput is, by definition, the amount of data (successfully) transmitted per time unit. Consequently, in our case, it is the size of a packet (in data units) per overall transmission time. De defined RRHY is the minimal physical layer transmission rate that allows packet to be transmitted during a single time slot (Cheng and Huang, 2008, p. 3). Hence, the duration of slot in time units is BPKT/RRHY.
For slotted CSMA/CA we defined ATTEMPsCS as the number of attempts till a successful transmission (including). Each unsuccessful transmission causes the node to wait till the next contention period, taking L time slots. Also, once a node has detected a free channel, it has enough information to send for the whole contention period (Cheng and Huang, 2008, p. 2). Thus, the last successful transmission also takes L time slots and the number of successful transmissions per time unit of is:
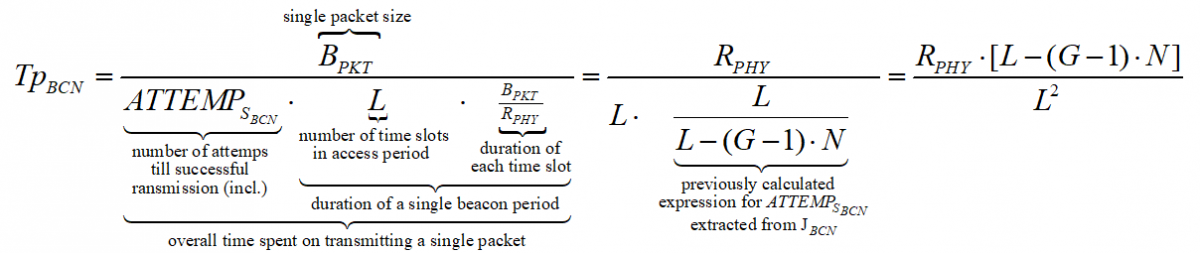
For beacon mode the throughput is computer in about the same way. We defined ATTEMPsCS as the number of attempts till a WSN transmits without inter network collision occurs. This time, due to the distribution of WSNs’ transmission by timeslots, only a single unsuccessful transmission can occur during an access period of L time units (one for each slot). If an inter network collision occurs, the node must wait for next period to come.
If transmission succeeds, the node only sends its data during a single slot, leaving a certain amount of time till the end of the period. Nevertheless, this period of time is relatively small comparing to the overall amount of time passed while attempting to send and can thus be neglected in the calculations. The throughput in beacon mode is then expressed as:
A few algebraic manipulations, based on the quadratic formula, on the equations above provide the following tradeoff between TpBCN, G, and N for the CSMA/CA case:
While for the beacon case we get:
When substituting it in the expressions we previously got for JCS and JBCD with large (thus, positive) values of L, for slotted CSMA/CA we get:
And , we receive:
These are the relation of power consumption to throughputexpressions that we were planning to compute.
Looking at the computations above we can reach several conclusions. First one deals with a tradeoff between the number of WBANs and the data throughput. The inequalities ![]() and
and ![]() indicate that if the throughput is not allowed to drop below a certain required level (e.g. by sphere of application), we are limited with the maximal number of WBANs in use. The second conclusion is that more slots in access period leads to smaller energy consumption and less collisions. We reach this conclusion by looking at the two possible solutions of
indicate that if the throughput is not allowed to drop below a certain required level (e.g. by sphere of application), we are limited with the maximal number of WBANs in use. The second conclusion is that more slots in access period leads to smaller energy consumption and less collisions. We reach this conclusion by looking at the two possible solutions of
 and
and  . For small L we expect high TpCS and TpBCN . However, high throughputalso means more frequent transmission rate of the WSNs, i.e. larger ATTEMPS cs and ATTEMPS bcn. This would cause an increase of collision chance, as we can see from
 ![]() and
and ![]() . Higher collision rate would decrease the number of successful transmissions and make the throughput lower than expected (Cheng and Huang, 2008, p. 3). On the other hand,
. Higher collision rate would decrease the number of successful transmissions and make the throughput lower than expected (Cheng and Huang, 2008, p. 3). On the other hand, ![]() and
and ![]() imply that for large L the energy consumption will decrease, reaffirming by this the latter conclusion that an access periodwith many slots appears beneficial.
imply that for large L the energy consumption will decrease, reaffirming by this the latter conclusion that an access periodwith many slots appears beneficial.
In order to compare slotted CSMA/CA and beacon mode with the new hybrid model (to be described later on) we could use another designation – average power consumption, defined as energy divided by transmission time, per packet. We assume that energy is only consumed when transmitting and receiving packets in both modes, while no power is consumed during idle (sleep) periods (Cheng and Huang, 2008, p. 3). We make another assumption at this point, and that is the fact that for both modes energy is only consumed by the WSNs during transmission (TX) and receiving (RX) periods, while none is consumed during the idle (OFF) period (Cheng and Huang, 2008, p. 3). Energy is defined as power per time unit. In our case, BPKT/RPHY identifies the time required for the physical channel to send a single packet. Accordingly, JRKT , JCS_COST and JBCN_COST can be expressed as ![]() ,
, ![]() ,
, ![]() , respectively. We can now infer the average power consumption for slotted CSMA/CA, while doing the above substitutions:
, respectively. We can now infer the average power consumption for slotted CSMA/CA, while doing the above substitutions:
For beacon mode the average power consumption is:
We shall now use the expressions above for WCS and WBCN to compare the slotted CSMA/CA mode and the beacon mode. Figure 2.1 below shows the results of measuring the power consumption of an arbitrary WSN in all the three access modes (including Hybrid). Here we’re dealing with fixed number of WSNs and varying number of WBANs, while the graph shows lower power consumption for slotted CSMA/CA mode than for beacon mode.
This is because the slotted CSMA/CA mode adopts channel detection to avoid collision. In slotted CSMA/CA a WSN will not try to detect a free channel through the entire time of packet receiving, while in beacon mode the WSN listens to the channel during each beacon period (Cheng and Huang, 2008, p. 4).
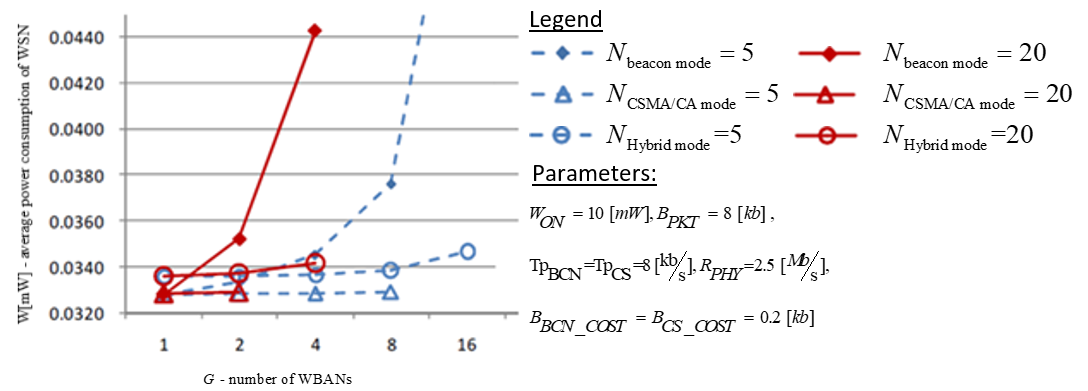
According to Cheng and Huang’s measurements in figure 2.1, the detection procedure listens to the channel for only ![]() of packet receiving time.Henceforward, in this mode of work the slotted CSMA has an advantage over the beacon mode. In other cases, however, the beacon mode overcomes slotted CSMA/CA mode, as it can be seen on the histogram on figure 2.2 below.
of packet receiving time.Henceforward, in this mode of work the slotted CSMA has an advantage over the beacon mode. In other cases, however, the beacon mode overcomes slotted CSMA/CA mode, as it can be seen on the histogram on figure 2.2 below.
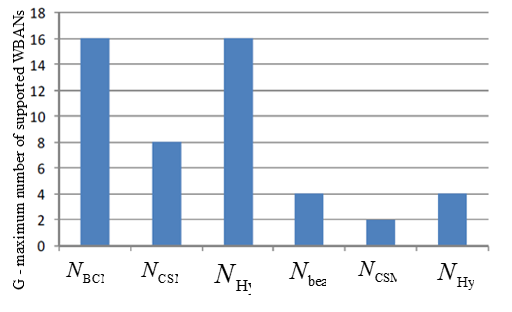
The graph in this case visualizes that beacon mode supports more WBANs (WBAN groups) than slotted CSMA/CA. So, from the overall WBAN user capacitypoint of view, the beacon mode is advantageous over slotted CSMA/CA. Body signals monitors may fail due to the insufficient throughput of WSN when the number of users is higher than the limit. This might happen when lots of people who are carrying WBANs walk close together (Cheng and Huang, 2008, p. 4).
We see that neither of these methods is perfect, as one has lower power consumption than the other, yet the other may be required to meet high user capacity criterion. A new access method that would combine the advantages of both former methods and provide high user capacity as well as low power consumption is suggested by Cheng and Huang by the name of Hybrid model.
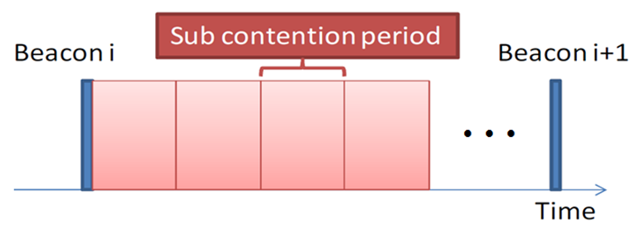
The Hybrid mode adopts beacon mode, in order to deal with the IANCs, and slotted CSMA/CA’s channel detection to handle IRNCs. In beacon mode all the WBAN nodes are assigned non-overlapping sub contention periods, as it illustrated in Figure 4 below, eliminating the collision from the intra network. Apart from the sub contention periods assignment, WSN in the Hybrid mode also performs the channel detection, within its own sub contention period.
This deals with the IRNCs.Figure2shows that the Hybrid mode consumes more power than the slotted CSMA/CA mode. It is true, because it adopts (and wastes energy on) both beacon and channel detection. However, when compared to the beacon mode, the Hybrid mode, in certain multi-WBAN scenarios, has as low as 63.4% power consumption. As for the number of WBANs (user capacity), Figure 2 illustrates that the Hybrid mode doubles the values of slotted CSMA/CA mode.
Conclusion
We can now conclude the comparison of the three modes. The provided analytical model of power consumption and throughput, along with the study results received by Cheng and Huang(2008) show that neither the beacon-based nor the detection-based modes effectively supports low power consumption and high capacity (in terms of WSN nodes) altogether (Cheng and Huang, 2008, p. 4). At the same time, the Hybrid mode proposed by Cheng and Huang (2008) provides higher capacity than the other two modes, while its power consumption is still well managed (p.4).
Centralized Computing Model
Introduction
Wireless body-area networks (WBANs) have revolutionized the way mobile and wearable computers communicate with their users and I/O devices. In a study by Yan, Zhong and Jha, they investigate an energy-efficient computing model, called wireless device driver, for low-duty peripherals, sensors and other I/O devices employed in a WBAN to communicate with a more powerful central device. The study compares two popular WBAN technologies, 802.15.1 (Bluetooth) and 802.15.4 (ZigBee), in terms of design cost, performance, and energy efficiency (Yan, Zhong and Jha, 2010, 1).
Existing implementations of WBAN utilize Zigbee or IEEE 802.15.4 as enabling technology. The IEEE 802.15.4 standard supports both random and scheduled access protocols. (Anand Gopalan, Park, 2010, 740). In a study by Latre et al, a star network configuration of the IEEE 802.15.4 standard at 2.4 GHz was considered for a WBAN. The main consideration in this work was the long-term power consumption of devices.
The results show that IEEE 802.15.4 provides a limited answer for medical sensor networking when configured in non-beacon mode with low data rate asymmetric traffic. Beacon mode can also be used, but with even more severe restrictions on data rate and crystal tolerance. The conclusion of the study was that, although 802.15.4 can provide QoS, the technology is not scalable in terms of power consumption and cannot be used as a single solution for all WBAN applications. The IEEE 802.15.4 is not the best solution for supporting communication in WBANs. Although it can be used for a quick (and easy) implementation, the results are rather poor. IEEE 802.15.4 was not designed to support WBANs. Specialized MAC protocols are needed (Latre et al, 2010, 9).
This is why some implementations of WBANs use Bluetooth (IEEE 802.15.1). This was developed as a cable replacement and does not support (or only very limited) multi-hop communication. It has a complex protocol stack and high energy consumption compared to IEEE 802.15.4 (Latre et al, 2010, 9). It is therefore not suited to be used in a WBAN. Most current implementations of WBANs use IEEE 802.15.4 or ZigBee as enabling technology.
However, Bluetooth is another alternative MAC protocol for low cost and low power wireless personal area network. For example, in the piconet mode of the Bluetooth protocol, there are up to 7 slave devices and 1 master device. The communications between the slave devices and master device is based on TDMA scheduling. The master device defines the time slot assignments. The Bluetooth protocol with piconet is essentially the same as the standard TDMA scheme (Su and Zhang, 2009, 425).
In the study by Yan, Zhong and Jha, the impact of tunable parameters of the wireless device driver on connection latency and energy consumption for both Bluetooth and ZigBee are also analyzed in the study. The authors address dynamic resource management in higher-level protocols after investigating the trade-off between connection latency and energy consumption.
Furthermore, they propose an energy-efficient power down policy that utilizes the interval between consecutive connection requests for energy reduction; an adaptive connection latency management technique that adjusts various tunable parameters dynamically to achieve minimum connection latency without changing the energy consumption level. Every conclusion achieved is backed by measurements and experimental results that show that these techniques are very effective in reducing energy consumption while meeting connection latency requirements (Yan, Zhong and Jha, 2010, 1).
This chapter is based on Yan, Zhong and Jha: Energy Comparison and Optimization of Wireless Body-Area Network Technologies. Other relevant studies that challenge or support the main study are identified and discussed in the chapter in a bid of coming up with a logical and practical conclusion regarding the power efficient models under discussion.
In Depth Review Energy Comparison and Optimization of Wireless Body-Area Network Technologies
According to Yan, Zhong and Jha, a body-area network (BAN) is a computer network used for communications among computing and I/O devices within the physical reach of a human user or personal operating space. In recent years, there has been a significant increase in applications based on wireless BAN (WBAN) technologies for example, IEEE Standards 802.15.1/Bluetooth and 802.15.4/ZigBee, especially in WBANs. The study considers computer-to-computer models adopted for wireless peripheral devices in many WBANs, in which WBAN members have their own operating system (OS) to control wireless communication.
For example, an Intel personal server that uses Bluetooth to communicate with existing computing infrastructure, an IBM Linux Watch that supports Bluetooth. Since both devices run Linux, the computer-to-computer model is suitable for scenarios in which multitasking is required, e.g., when sensing and communication are performed in parallel. However, for smaller-scale applications, such as sensors and other information-capturing devices in a WBAN, a simpler computer-to-device model may be more suitable, especially in terms of energy efficiency and design cost, without the presence of an OS (Yan, Zhong and Jha, 2010, 1).
In the computer-to-device model, a mobile computer serves as the center or host of a WBAN, other WBAN members serve the host as peripherals or slaves. The host OS treats its wireless peripherals similar to wired peripheral devices. Wireless peripherals are, for example, wireless desktops, a mouse and keyboard et.c. However, such devices normally have proprietary and ad hoc designs (Yan, Zhong and Jha, 2010, 1).
The study investigates a computer-to device model as an energy-efficient computing model for a wireless device driver for low duty-cycle peripherals, sensors and other I/O devices in a WBAN. The model is considered of great interest to the BANs because of its ability to wirelessly interconnect body-worn computers, sensors and other I/O devices which poses a significant energy efficiency challenge.
First, the study analyses design issues and application scenarios of the computer-to-device model. Secondly, the study presents case studies for two popular WBAN technologies; Bluetooth and ZigBee, to investigate the effect of tunable parameters in the wireless device driver on connection latency and energy consumption. Based on the case studies, they address dynamic resource management, including power management and adaptive connection latency management, in higher-level protocols by investigating the trade-off between energy consumption and connection latency (Yan, Zhong and Jha, 2010, 1).
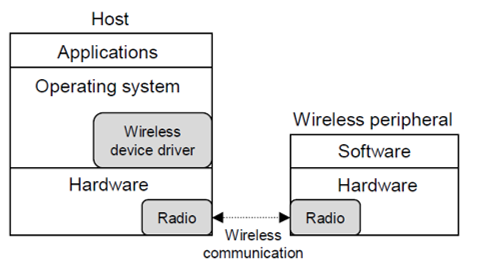
According to the study, all control operations of a wireless peripheral device are performed by a code specific to the device called the wireless device driver. Figure: 3.1 represent the architecture of the proposed computing model for wireless device drivers in WBANs. In WBANs, the host is typically a mobile system, such as a handheld computer, a mobile phone, or a personal server. A host can control multiple wireless peripheral devices. While computing model for wireless device drivers has much more hardware resources available to it than the peripherals, the wireless device driver is part of its OS.
The driver relies on wireless communication protocols for a reliable connection with the peripheral. It functions as an interface between the peripheral and host applications that need the peripheral. For example, the wireless device driver sends control commands to the peripheral upon an application request. The software on the wireless peripheral collects data, e.g., from sensor readings, and sends them through wireless communication to the host.
The wireless device driver then retrieves the data; hence host applications can access the data through the OS. The model is also applicable to the case when two hosts collect the readings from the same sensor. The sensor can serve the hosts as a wireless peripheral device in a time-divided fashion. However, the model does not support multitasking (Yan, Zhong and Jha, 2010, 2).
The proposed model is subtle from other sophisticated computer-to-computer models. The computer-to-device model is interrupt-driven without control of the OS. It has lower hardware requirements and design complexity. However, in the computer-to-computer model, the OS on wireless peripheral device controls its exchange of data with the host or other devices hence the devices functions as a computer.
This model is suitable for scenarios in which multitasking is required. For example, in a wireless sensor network (WSN) for forest fire detection, a large number of sensor nodes are randomly deployed in a fire-prone forest to detect fires. The sensor nodes relay the exact origin of the fire to the end users. Meanwhile, they monitor the possibility of fire at their own locations. In this case, sensing and communication have to be done at the same time. However, for WBANs, low duty-cycle peripherals and sensors are deployed within the range of an individual and multitasking may not be necessary. Embedding an OS in wireless peripheral devices increases design cost (Yan, Zhong and Jha, 2010, 2).
In the design issues of the wireless driver, the wireless connection between the host and peripheral devices is enabled through communication protocols at different levels. Lower-level protocols, such as Bluetooth and ZigBee stacks, are responsible for a secure and reliable data exchange channel. The wireless device driver, however, needs to implement a higher-level protocol that interprets the data, when the peripheral conveys some information in the form of a data stream to the host.
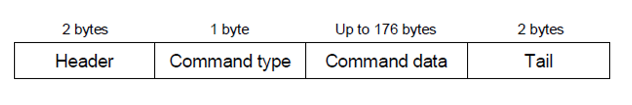
The study uses a simple byte-based communication protocol for the wireless device driver. The protocol is based on commands executed between the wireless device driver and its peripheral devices. It specifies the format of the communication command, as shown in Figure: 3.2. The communication command is demarcated by a header and a tail. Its type is specified by command type. Type I command is the information command, which updates the internal memory of the wireless device for display. It contains up to 176 bytes of command data, which specify not only the text to be displayed but also how it should be displayed (Yan, Zhong and Jha, 2010, 2).
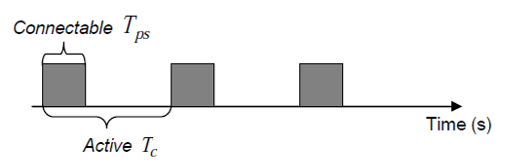
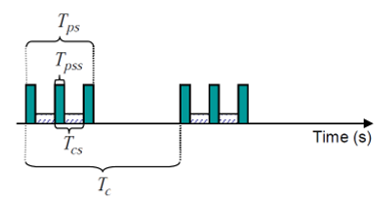
Due to energy efficiency reasons, the wireless peripheral switches its state between connectable and idle continuously and hence is not always available for connection as illustrated in Fig. 3.3. This is called an active session in this work. The radio becomes connectable for Tps seconds every Tc second. When the radio on the device is in the idle state, it does not respond to any connection request from the host, which leads to longer connection latency, potentially as long as Tc – Tps we define connectable ratio as
γ = Tps/Tc. If γ = 1 that is Tps = Tc, then the radio is always connectable, and thus the connection latency is minimized. However, the average power consumption of the wireless peripheral device in the active session is given by Equation (1).
Map of symbol relevant to equation 1
Pconnectable – Represents the power consumtion when the radio is available for connection.
- Represents the power consumption when the radio is in an idle state (not available for connection).
- Represents the number of seconds the radio is connected ( Tps /Tc ).
Equation 1:
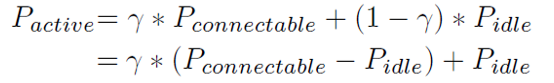
The study found that, while increasing r reducesthe connection latency, it increases Pactive . This shows that, Tps/Tc has a significant impact on the connection latency and energy consumption. For obtaining energy-efficient wireless communication, the study considers a trade-off between connection latency and power consumption by tuning parameters Tps ∧Tc (Yan, Zhong and Jha, 2010, 2).
In application scenarios, the study found that the Wireless device drivers can not only be employed in computer peripherals, such as wireless keyboard, mouse, and headset for human-computer interaction, but also to control the light, lock, and curtain equipped with a wireless radio. However, the study was more interested in its applications to WBANs for wearable/mobile pervasive computing, including health monitoring.
In a health monitoring system, patient information, e.g., temperature and blood glucose level can be measured by body-worn sensors. A handheld or mobile phone acting as the host collects health information through the wireless device driver. Applications running on the host can access the information from the wireless device driver. They can forward the information to medical professionals through Internet connectivity on the host (Yan, Zhong and Jha, 2010, 3).
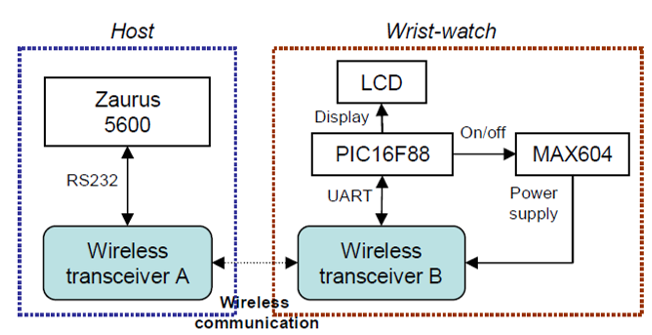
Another scenario is where a wearable pervasive computing is using a wireless wrist-watch as the secondary user interface between a handheld and its body sensor network. While the watch can be viewed as a complete computer system, the Cache Watch runs as a dumb interface device without an OS. In this scenario, the Cache Watch concept illustrates the computer-to-device model presented in the study. Figure: 4.4 show the hardware platform of a host and wrist-watch using a wireless transceiver for implementing the wireless device driver. The study uses Zaurus Linux as the host. Wireless transceiver A is attached to the linux using an adapter.
The Zaurus controls wireless transceiver A via an interface with 9600bps baud rate. The wrist-watch can display text messages, which may have different latency tolerances. Without an OS, it is a wireless peripheral device instead of a standalone computer. The watch is powered by a 3.6V supply with three AAA batteries. It is controlled by a microcontroller, PIC16F88. PIC16F88 drives the LCD directly for displaying information and controls wireless transceiver B through a UART interface with a 9600bps connection. It reads data from the UART and interprets them based on a wireless communication protocol. MAX604, a voltage regulator controlled by PIC16F88, provides the power supply for wireless transceiver B.
The wireless device driver is written in C++. It is responsible for the configuration and control of wireless transceiver B on the watch. It also collects data from this transceiver and relays them to the corresponding application on the host (Yan, Zhong and Jha, 2010, 3).
In the experimental setup, the study evaluates the wireless device driver based on several factors: connection latency L, energy consumption EA of wireless transceiver A attached to the Zaurus, and energy consumption EB of wireless transceiver B attached to the wrist-watch. Connection latency is the interval between wireless transceiver A initiating a connection request and receiving an acknowledgment from wireless transceiver B. The wristwatch typically seeks connection with the Zaurus when the user requests it. The time it takes to establish a connection is an important part of user experience. A C++ program is used to generate 15 connection requests randomly and measure the corresponding connection latencies.
The study measures power with an Agilent 34401A digital multimeter connected to a Windows-based PC via a GPIB cable. The authors obtain the power consumption by measuring current through a R=0.1Ω sense resistor connected in series with the power supply to the wireless transceiver. The C++ program on the PC is used to sample the voltage drop VR across the resistor at 220Hz. The program calculates the current I through the resistor based on I= VR/R . It then calculates the power consumption P using (Yan, Zhong and Jha, 2010, 3). where P=VI, ∧ V is 3.3V
Bluetooth
The study applies the Bluetooth module as a wireless transceiver. The Promi-ESD class II Bluetooth module can be configured and controlled by typical AT commands through a UART interface. Two Promi-ESD modules are used as wireless transceivers A and B, as shown in figure: 3.4. Wireless communication using Bluetooth is connection-oriented. A Bluetooth device allows other devices to connect to it by entering the page scan mode. As shown in Figure: 3.5, page scan is conducted in short bursts, Tpss seconds every Tcs second. This session is called the page scan session. However, the connectable session is conducted for Tps seconds every Tcs second. To establish a connection, the Zaurus first sends a connection request to the attached Promi-ESD A using the AT connection command (ATD) via the RS232 interface.
The Promi-ESD A then enters the page mode, in which it transmits an ID packet directed at the intended Promi-ESD B attached to the wristwatch. After it gets an acknowledgment from Promi-ESD B, it responds with frequency hop synchronization (FHS) packet. On reception of the FHS packet, Promi-ESD B enters the connection state. Once the connection is established, Promi-ESD A sends a “CONNECT” message to the Zaurus. The delay between the Zaurus sending a connection request and receiving a “CONNECT” message is the connection latency L for the Bluetooth-based system used in this work (Yan, Zhong and Jha, 2010, 3).
Map of symbol relevant to equation 2
- Ppage – scan – Represents the power consumption of a promised module when it enters pages scan.
- Pstandly -Represents the power consumption of a promi-ESD module when it is in standby mode.
The power consumption of the connectable session is presented in this equation 2;

The Tpss = 80ms and Tcs = 640ms, in the above equation while the Pconnectable and Pidle are 43mW and 23mW, respectively. In tunable parameters, the wrist-watch using a Promi-ESD module are identified as Tpss, Tcs , Tps , and Tc . Tpss and Tcs
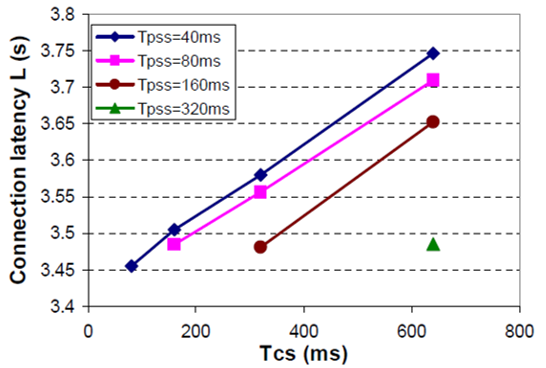
These parameters can be changed by adjusting the S-registers on the Promi- ESD module, S41 and S42, respectively, through the AT command ATS41=42 = . The default values are Tpss = 80ms and Tcs = 640ms. The study discusses the impact specific Bluetooth tunable parameters Tpss and Tcs on connection latency. Let Promi- ESD B be in the connectable session continuously, that is Tps = Tc . Connection latency L determines how long it takes the Zaurus to establish a connection with the watch. Figure: 3.6 illustrate L under different values of Tpss and Tcs . The study observes that for a given value of Tpss . L decreases as Tcs reduces. For example, this is illustrated in figure: 3.6 where Tcs= 40ms (Yan, Zhong and Jha, 2010, 4).
Figure: 3.6. Illustrates the connection latency under different values of Tpss and Tcs while on the blue tooth based system.
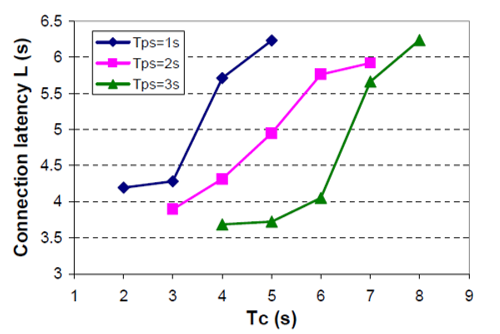
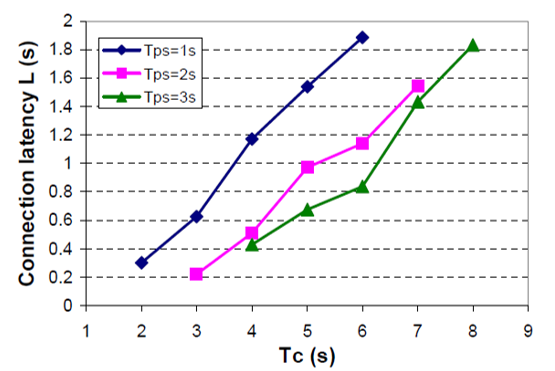
Next, the study discusses how tunable parameters,Tps and Tcs affect connection latency and energy consumption. Tpss and Tcs are set to their default values, 80ms and 640ms, respectively. Figure: 3.8 show L under different values of Tps and Tcs . It is observed that for a given value of Tps , e.g., Tps = 2s, L decreases as Tc decreases.
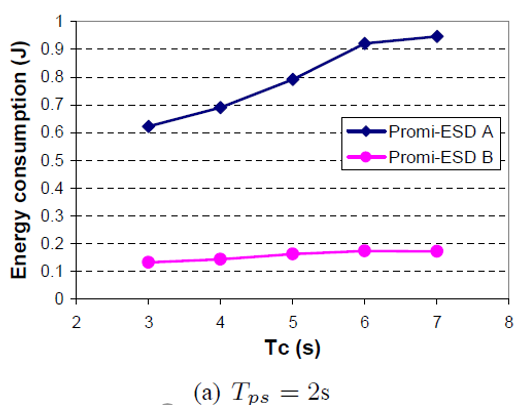
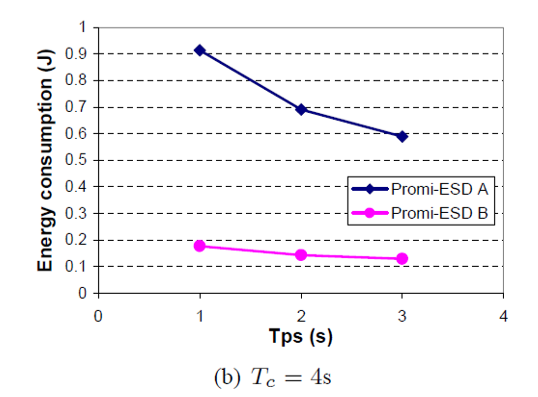
Ea Corresponding to Tc = 3s is smaller by 34.2% with respect to EA under Tc = 7s, as shown in figure: 3.8. Eb corresponding to Tc = 3s is smaller by 23.3% with respect to Eb under Tc = 7s.
Eb decreases as Tc decreases, even though the power consumption of Promi- ESD B increases. This is due to the large reduction in L. For a given value of Tc , for example, where Tc = 4s, L decreases as Tps increases.
Ea under Tps = 3s is smaller by 35.4% with respect to Ea under Tps =1s. Ea Under Tps =3s is smaller 34.0% with respect to Ea under Tps = 1s (Yan, Zhong and Jha, 2010, 4).
Zigbee
The study analyzes Zigbee by using it as a wireless transceiver. The Crossbow MICAz is used as the ZigBee module. It uses the Chipcon CC2420 RF transceiver. It conforms to 802.15.4 and runs in beacon mode under the control of Tiny OS. The data rate is 250kbps when operating at 2.4GHz. It can be controlled through a UART interface on its 51-pin expansion connector. Two MICAz modules are used as wireless transceivers A and B, as shown in figure: 3.4. As opposed to Bluetooth, MICAz has no connection establishment mechanism.
It sends data to the recipient by using the address of a specific MICAz or a broadcast address specified in the packet header. In this work, the Zaurus first instructs the attached MICAz A to send a packet to confirm that the radio on MICAz B is turned on. If the packet is received by MICAz B, the radio stays in the on state for the connection and an acknowledgment packet is sent back. On reception of the acknowledgment, MICAz A sends a message “CONNECT” back to the Zaurus. The delay between the Zaurus sending a confirmation request and receiving a “CONNECT” message is the connection latency L for the ZigBee-based system used in this work. For energy efficiency, the radio on MICAz A is turned on for Tps seconds every Tc seconds. When the radio is turned off, MICAz A is not connectable. The wakeup and shutdown latency of the radio is negligible (less than 1ms).
Pconnectable and Pidle as illustrated in equation(1), are 84mW and 15mW, respectively.
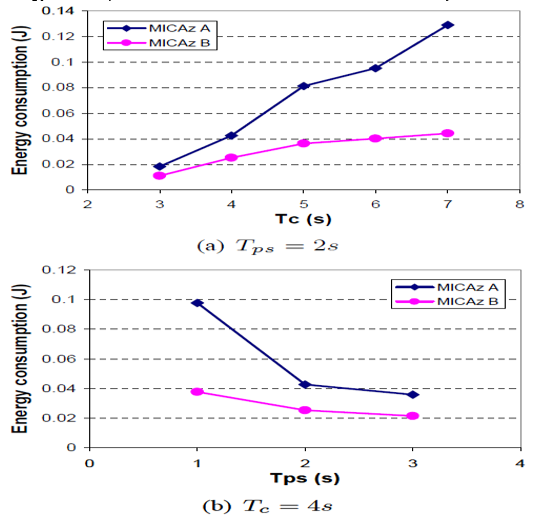
The study analyzes a wrist-watch that uses the MICAz module; the tunable parameters are Tps and Tc it discusses how both affect connection latency and energy consumption. Figure: 4.0 shows connection latency L under different values of Tps and Tc . It can be seen that for a given value of Tps , e.g., Tps = 2s. L decreases as Tc decreases. Energy consumption EA of MICAz A corresponding to Tc = 3s is smaller by 85.7% with respect to EA under Tc = 7s. , as shown in Figure: 4.1. Energy consumption EB of MICAz B corresponding to Tc = 3s is smaller by 75.1% with respect to EB under Tc = 7s. For a given value of Tc , e.g., Tc = 4s L decreases as Tps increases. EA for Tps = 3s is smaller by 63.4% with respect to EA under Tps – 1s . EB for Tps = 3s drops by 43.2% with respect to EB under Tps = 1s . The reason is that although the power consumption of MICAz B increases the higher reduction in l results in a reduction in. Therefore, L and decrease as increases
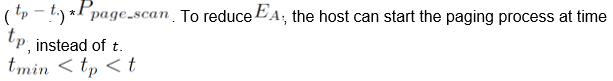
Yan, Zho and Jha propose a dynamic resource management system that can be employed in both systems through a higher level protocol. The technique is categorized into two: Energy efficiency power down policy and Adaptive connection latency management. In energy efficiency power down policy, the host disconnects from the wireless peripheral device, if the device still remains in active session up to the next connection request a lot of energy is wasted. This is why the device needs to be set in power –down mode to reduce wastage of energy. Assuming the interval between the two consecutive connection requests is Δt and the transition time overhead for being.
Powered down and woken up are δd and δu , respectively. The transition energy overhead for being powered down and woken up is ξd and ξu, respectively. If these conditions can be achieved, the peripheral device can be able to be powered down. Equation 3 represents the conditions:
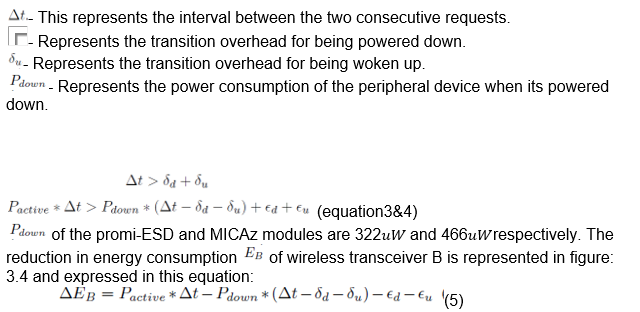
A type 2 command known as the management command is implemented to enable the host to power down the peripheral device during run time. The command data have information about the next connection schedule from the host to the wireless peripheral device. After receiving the connection schedule, the host (Zaurus) can power down the peripheral device (Promi-ESD/MICAz B) using the management command. The Microchip on the wrist-watch is programmed to wake up peripheral device before the next connection request arrives. If the next connection schedule is unknown, some prediction mechanism can be employed to predict the value of Δt . The study employs AVG (w) prediction, which computes an exponentially moving average of past connection request arrival times as illustrated in equation 6: ti = wti – 1 + mi – 1/ w + 1
Where w decay is factor, ti and mi denotes the predicted and measured values of the connection initiation time for the Ith connection respectively. However, any inaccuracy in the prediction may affect the connection latency and energy consumption of modules on the host and wrist-watch. The study considers one such connection request; the study assumes the host initiates the connection request at time t . The predicted connection schedule is for time tp . The study assumes (tmin=δd+δu) while it analyses these four scenarios as follows.
If the prediction is accurate there is no impact on connection latency L and energy consumption Eb of wireless transceiver B.
If tp is larger than t , the device is still in the power-down mode when the host initiates the connection request. Thus, with respect to the case when the prediction is accurate, l increases by. Energy consumption Ea of wireless transceiver-A increases by
The device wakes up at time tp, before the host sends the connection request. L and Ea may remain unchanged. However, Eb increases by.
The device will not be powered down. L and Ea may remain unchanged. Eb Increases by:

Figs. 4.2 and 4.3 show the effectiveness of the power-down policies on the systems using Bluetooth and ZigBee, respectively. Each of Tests 1-5 initiates 15 connection requests from the host randomly. Two policies are investigated for the wireless device driver: no power-down policy and power down policy with unknown connection request schedule. For the Bluetooth-based system, Eb reduces by 25.0% under power-down policy with respect to no power-down policy while the connection latency increases by 19.8%. Similarly, for the Zig Bee-based system, Eb is reduced by 30.7% under power-down policy with respect to no power-down policy, while the connection latency increases by 26.7%.
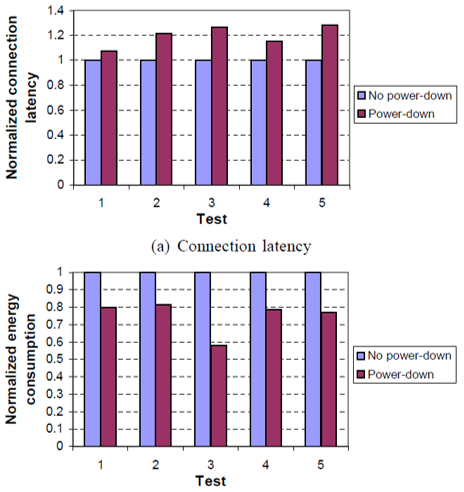
In the second category adaptive connection latency management, tunable parameters affect both connection latency and energy consumption. Two types of commands are implemented to adjust tunable parameters dynamically. A configuration command is implemented to adjust the timing parameters Tps and Tc during run time. The commands data specifies the values Tps and Tc. The second command is known as Bluetooth specific configuration command is implemented to specify the values of Tpss and Tcs; for the Bluetooth based system. The values must be slot-based (one slot equals 625 us) according to the specification of the Promi-ESD module. The time overhead of the commands depends on current values of tunable parameters. For example, in the ZigBee-based system, it takes 0.3s on an average to switch from Tps=1s and Tc=2s to Tps=2s and Tc=3s . In the Bluetooth-based system, under Tps=1s and Tc=2s , it takes 3.5 s on an average to switch from Tpss=40 ms and Tc=80 ms to Tpss=80 ms and Tc=160 ms . Given the same values of γ and τ (Bluetooth-specific), Promi-ESD and MICAz have the same level of power consumption as presented in Equations (1) and (2).
Table I shows the connection latency under different systems and parameters. For the same system with the same values of γ or τ different tunable parameters result in different values of connection latency. For example, when γ=1/3 on Promi- ESD B in the Bluetooth-based system, the connection latency under Tps=1s and Tc=3s reduces by 5.8% compared to Tps=3s and Tc=9s . When γ=1/2 on MICAz B in the ZigBee-based system, the connection latency under Tps=1s and Tc=2s reduces by 64.1% compared to Tps=3s and Tc=6s . Therefore, given the level of power consumption of the wireless peripheral device, the tunable parameters can be adjusted dynamically to achieve minimum connection latency (Yan, Zhong and Jha, 2010, 6).
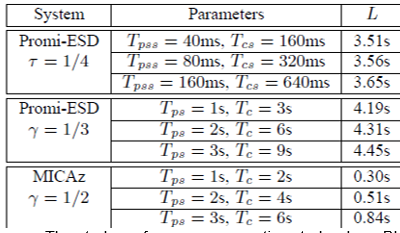
The study performs a comparative study where Bluetooth and zigbee are compared in terms of connection latency and energy consumption for the same tunable parameters Tps and Tc of the wireless device driver.
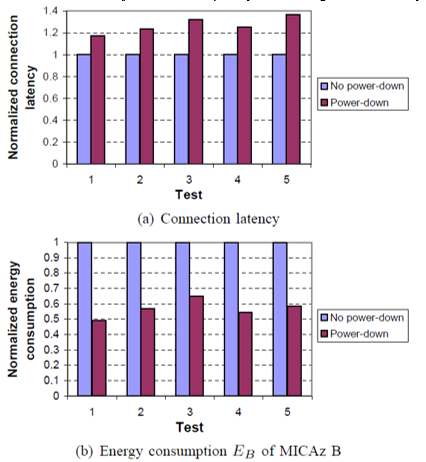
Connection latency is important for users experience in WBANs. Figure: 4.4 shows a comparison of the normalized connection latency for the Bluetooth based and the zigbee based systems with the same values of Tps and Tc .
Tpss And Tcs of the promi-ESD remain the default value (Tpss=80ms and Tcs=640ms). The study observes that the MICAz module establishes a connection between the Zaurus and wrist-watch much faster than the Promi-ESD module. For example, when Tps=2s and Tc=4s the promi-ESD module takes 4.3s to establish a connection while the MICAz module takes 0.5s.
For the different values of Tps and Tc shown in Figure: 4.4, the connection latency using the MICAz module is on an average 87.0% smaller with respect to the Promi-ESD module. Thus, the MICAz module has a faster connection establishment mechanism compared to the Promi- ESD module with the same values of Tps and Tc (Yan, Zhong and Jha 7).
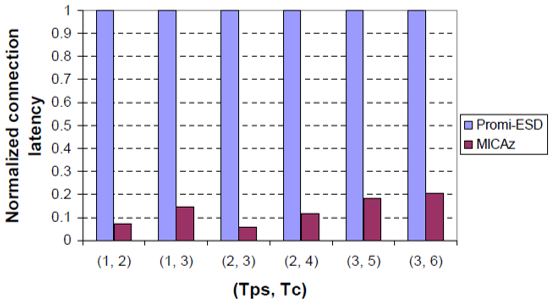
Figure: 4.5 shows the normalized power consumption of the Bluetooth and ZigBee modules when they are in an active session with the same values of Tps and Tc . It can be seen that the Promi-ESD module consumes less power than the MICAz module. For example, the power consumption of the Promi-ESD module in an active session is 33.2mW, when Tps=2s and Tc=4s . However, the power consumption of the MICAz module is 49.5mW, which is 49.1% larger compared to the Promi-ESD module. For the different values of Tps and Tc shown in Fig. 14, the power consumption of the MICAz module in an active session is 43.7% larger on an average with respect to the Promi-ESD module. Thus, with the same values of Tps and Tc , the Promi-ESD module is more power-efficient than the MICAz module (Yan, Zhong and Jha, 2010, 7).
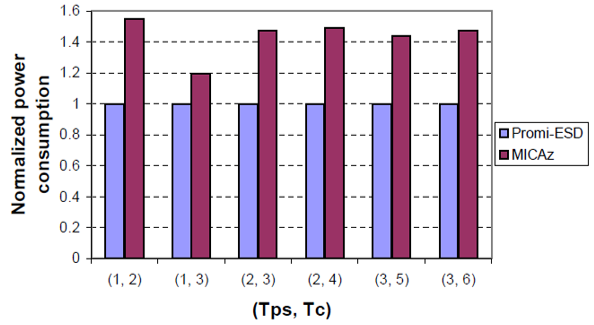
The study then compares Bluetooth and zigbee in terms of connection latency and energy consumption with different values of tunable parameters Tps and Tc .
Figure: 4.6 shows the connection latency under the same power consumption level in an active session on Bluetooth and ZigBee systems. The same power consumption level corresponds to different values of Tps and Tc , as shown in Table II. Obviously, under the same power consumption level, the MICAz module yields smaller connection latency than the Promi-ESD module. For example, the power consumption in an active session of the Promi-ESD module with Tps=1s and Tc=2s and the MICAz module with Tps=1s and Tc=4s are the same, 32.3mW. However, the connection latency using the MICAz module is 1.2 s , compared to 4.2 s using the Promi-ESD module.
This yields a reduction of 71.4% in the connection latency. For the cases shown in Figure: 4.6 , the connection latency using the MICAz module is on an average 72.0% smaller with respect to the Promi- ESD module under the same level of power consumption. Therefore, the MICAz module provides a more energy efficient transmission mechanism for small data packets than the Promi-ESD module in WBANs (Yan, Zhong and Jha, 2010, 7).
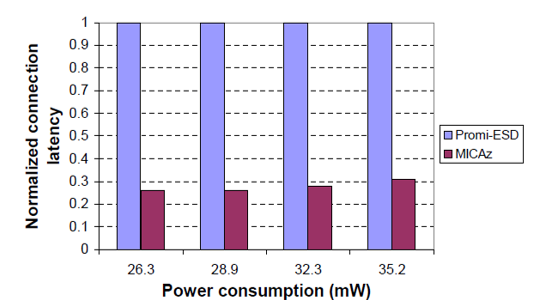
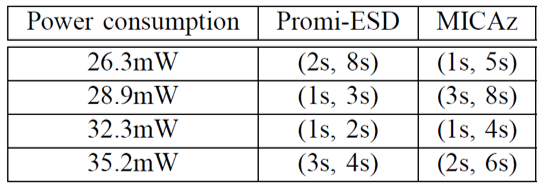
Discussion and Conclusion
The study is purely based on the measurement of commercial Bluetooth and zigbee modules when used in wireless device drivers. Although the study measurements and observations were made based on two specific representatives of Bluetooth and Zig-Bee; which are Promi-ESD and MICAz, the study identifies that these two purely represent the state-of-the-art for both WBAN technologies.
However, it is important to note that MICAz is a complete sensor module and is more than a ZigBee- Serial adapter. Moreover, the difference in power consumption between Promi-ESD and MICAz is primarily due to the RF receiver for ZigBee and the processor in MICAz that runs the ZigBee protocol stacks. Therefore, it is correct to conclude that the power comparisons between Promi-ESD and MICAz are representative of Bluetooth and ZigBee.
The output of the analysis carried out on the study shows that Bluetooth integrating technology which is more popularly used in commercial product such as mobile phones is more advanced than zigbee. For example, Bluetooth is more widely used in mobile phones due to its higher bandwidth and higher availability than zigbee.
Even though ZigBee is designed to be more power efficient than Bluetooth in WSN applications, when the authors set the tunable parameters to the same values in an active session, they found that the Bluetooth module ( Promi-ESD), consumes less power during an active session, while incurring higher connection latency compared to the ZigBee module (MICAz). When set to different values of tunable parameters, both modules can achieve the same level of power consumption in an active session. However, the ZigBee module takes less time to establish a connection, which can provide better user experience than the Bluetooth module.
The computer to device model proposed in the study is only suitable in scenarios where the low duty-cycle peripherals and sensors are deployed within the range of an individual, and multitasking is not necessary. It is interrupt-driven without the control of the OS, and thus has lower hardware requirements and design complexity. On the other hand, the computer-to computer model has an OS to control its peripherals and sensors, which increases design cost and energy consumption. It is suitable for scenarios in which multitasking is required.
WBANs play an important role in the deployment of wearable/ mobile pervasive computing systems. The study by Yan, Zhong and Jha proposes a computing model for a wireless device driver for low duty-cycle peripherals, sensors, and other I/O devices in a WBAN. The study analyses its design issues in terms of higher level communication protocols based on standard WBAN technologies: Bluetooth and ZigBee. Several communication commands, such as information, management, configuration, and Bluetooth-specific configuration commands, are implemented to adjust multiple tunable parameters of the wireless device driver dynamically. As shown in the study, these adjustments impact on both the connection latency and energy consumption, of both Bluetooth and ZigBee.
However, the essay’s review of this study is held strictly in terms of the two modules (zigbee and Bluetooth) in relation to their application in WBANs. According to a survey carried out by ullah et al, where WBAN uses Wireless Medical Telemetry Services (WMTS), unlicensed Industrial, Scientific, and Medical (ISM), Ultra-wideband (UWB) and Medical Implant Communications Service (MICS) bands for data transmission, an alternative spectrum for medical applications is the 2.4 GHz ISM band that includes guard bands to protect adjacent channel interference. This band is also used by other technologies, such as Bluetooth and Zigbee (Ullah et al,2010, 4).
However, ullah et al cautions, while current telemedicine systems use power demanding protocols such as Bluetooth to transfer information to the remote stations, these modes are open to interference by other devices working in the same frequency band. This restricts their ability to perform prolonged health monitoring (Ullah et al,2010, 26). The study by Yan, Zhong and Jha does not consider these shortcomings found in the two modes. This is a major shortfall considering most WBANs are integrated into telemedicine systems that supports unobtrusive ambulatory health monitoring for long periods of time.
In a study by Ullah, Higgin, Siddiqui, and Kwak on implanted and wearable body sensors, the authors identify a BSN node platform with an integrated wireless ZigBee compliant radio with on-board antenna which is modified by adding ISMP (Intelligent signal processing module) component (Ullah et al, 2010, 6). Even though the BSN node uses Zigbee wireless link as a low power communication protocol, the narrowband implementation is unable to satisfy the energy consumption budget of the sensor nodes. Thus, the authors concluded that an alternative solution is required to replace zigbee (Ullah et al, 2010, 8).
Conclusion
In their study, Yan, Zhong and Jha conclude that; given the power consumption level, the adaptive connection latency management technique can achieve minimum connection latency. Moreover, the energy-efficient power-down policy introduced has the capacity to reduce the energy consumption further (Yan, Zhong and Jha, 2010, 8). However, in comparison to other relevant studies, we find that this authors study has ignored other critical factors in zigbee and Bluetooth.
Moreover a survey carried out by latre et al identified an adaptation is BSN-MAC. The coordinator controls the communication by varying the superframe structure of zigbee. This involves dividing the time axis in a contention-free and contention-based period. The sensors provide real-time feedback to a BSN coordinator with application-specific and sensor-specific information. Hence, based on the feedback the BSN coordinator can make dynamic adjustments for the length of the contention-free and contention-based period to achieve better performance in energy efficiency and latency (Latre et al, 2011, 9).
However, even after utilizing this benefits including identifying zigbee capacity to provide QOS, the authors concluded the technology is not scalable in terms of power consumption and cannot be used as a single solution for all WBAN applications. This is because although these modes can be used for a quick (and easy) implementation, the results are rather poor (Latre et al, 2011, 10). Zigbee and Bluetooth were not designed to support WBANs; hence Specialized MAC protocols are needed.
In this essay, we propose an alternative energy efficient medium access protocol. This protocol was proposed by a study carried out by An, Gopalan and Park. The MAC protocol works in single-hop communication in order to reduce energy consumption by centrally controlled wakeup/sleep time. The central nodes act as a master while the other nodes are slaves. Slave nodes are the nodes which acquire sensor data readings and transmit to a master node for processing. The operation of the MAC protocol is based on three communication process viz link establishment process, wakeup service process and alarm process.
The master node establishes a link with the slave node by listening to a RF-channel for a fixed time for response followed by sending out a beacon. After link establishment, the master requests its slave’s information by setting the next wakeup time-slot. An optional synchronization is used to mitigate time-slot drift between master and slave.The protocol applies Wakeup fallback time to mitigate continuous time-slot collisions. The concept ensures that, If a slave wakes up and fails to communicate with the master, it goes back to sleep with a sleep time set by the WFT (An, Gopalan and Park, 2010, 3).
In their study, the authors concluded that the measured power for a body sensing application depends on sleep time as well as number of retransmissions. Also, as sleep time increases, the duty cycle decreases after several retransmissions. Hence, average power consumption is dependent on duty cycle value. This protocol exploits the centrally assigned wakeup/sleep time and shows significant energy reductions as compared to network MAC protocols Bluetooth and Zigbee. Another key difference from the two modules (Bluetooth and Zigbee) is that RF power requirement is significantly lower which boosts the energy efficiency of the protocol even much further (An, Gopalan and Park, 2010, 3).
Low Power Mac Layer Protocols
Introduction
A survey carried out by Gopalan and Park on energy efficient MAC protocols for WBANs, revealed that the current existing MAC protocols are unable to meet the energy efficiency requirements for WBANs MAC protocols. The aforementioned protocols include Code Division Multiple Access (CSMA) based MAC protocols, such as Wise MAC, Sensors MAC (S-MAC), Timeout MAC (T-MAC) and Berkley MAC (B-MAC). While the survey found these MAC protocols unsuitable for WBANs due to their lack of energy efficiency, the TDMA based MAC protocols were also found unsuitable in WBANs due to their constrained nodes in terms of frequency bands and computational capabilities (Gopalan and Park, 2010, p. 740).
The objective of this chapter is to contemplate by performing a detailed analysis and to compare four power minimization techniques, designed especially for MAC layer protocols for WBANs. Using these techniques, special low-power protocols can be designed and implemented for WBANs. Such protocols are required since traditional MAC protocols designed for ordinary wired or even wireless TCP networks do not accommodate the assorted WBAN traffic requirements in a power efficient manner.
In Depth Review Towards Power Efficient MAC Protocol for In-Body and On-Body Sensor Networks
This first technique is oriented towards beacon-enabled ZigBee, PB-TDMA, and S-MAC controlled in-body and on-body sensors. It uses traffic based wake-up mechanism for WBANs and achieves power efficient and reliable communication via exploiting the traffic patterns of the BSN to accommodate the entire BSN traffic. Logical connection between different BSNs is enabled through working on different frequency bands by a method called the bridging function. The bridging function integrates all BSNs working on different frequency bands into a complete BSN (Ullah, An and Kwak, 2009, p. 335).
According to the authors, the BSN enables monitoring of body functions and surrounding environment by combination of intelligent, miniaturized, low power, invasive and non-invasive sensor nodes. Each node is capable of processing and sending the data to a base station for diagnosis and prescription. The study also classifies the heterogeneous BSN traffic into normal traffic, on-demand traffic and emergency traffic. Normal traffic is the day-to-day routine traffic that occurs in the absence of emergencies, meaning that the BNC collects the data, processes it and transmits it under normal conditions with no emergency events.
This type of traffic normally occurs during routine health monitoring of threatening diseases such as heart disease. On-demand traffic is initiated by the BNC to request for data required to carry out diagnosis or prescription services. This traffic is categorized into continuous and non-continuous, which refer to surgical events and cases when limited information is required, respectively. Emergency traffic is the type of traffic that is not generated on regular intervals and is therefore unpredictable. Emergency traffic usually occurs when the BNs exceed a pre-defined threshold and should be accommodated in less than one second (Ullah, An and Kwak, 2009, p. 337).
These assorted BSN traffic types apply sophisticated and power efficient mechanisms to ensure safe and reliable operations; a requirement which existing MAC protocols do not meet due to the design challenges for both on-body and in-body MAC protocols.
On-body sensor networks are made up of miniaturized sensor nodes that are non-intrusive. Even though WMTS, unlicensed ISM, and ultra-wideband (UWB) bands can be used for data transmission, WMTS is preferred due to low interference. However, WMTS lacks the capacity to support video and audio transmissions. The study analyzes the performance of three viable alternatives: beacon-enabled IEEE 802.15.4, Preamble-Based time division multiple access (PB-TDMA) and S-MAC protocols for on-body sensor networks. Their analysis is verifed by extensive simulations using a network simulation software called NS-2, while applying the following principles of operation:
- The wireless physical parameters in the case of S-MAC, PB-TDMA, and IEEE 802.11 distributed coordination function (DCF) protocols are considered according to low power nRF2401 transceiver by Nordic Semiconductor, whereas in the case of IEEE 802.15.4, they are considered according to CC2420 radio interface by Chipcon AS.
- The nRF2401 transceiver operates in the 2.4-2.5(GHz) band with an optimum transmission power of -5(dBm).
- The shadowing propagation model is used throughout the simulations and the analysis considers 9 BNs firmly placed on a human body.
- The initial BN energy is 5(J), and the data rate of the BNs is heterogenous.
- The simulation area is 1*1(m2) with each BN generating Constant Bit Rate (CBR) traffic.
- The packet size is 128(byte) and the transport agent is User Datagram Protocol (UDP).
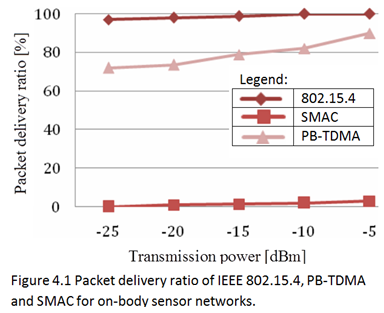
Simulation results on Figure 4.1 indicate that IEEE 802.15.4, when configured in beacon-enabled mode, outperformes SMAC and PB-TDMA. However, the analysis does not consider on demand and emergency traffic as it focuses on low upload/download rates based on periodic intervals that limit the performance of certain applications. Furthermore, the packet delivery ratio is influenced by BNs location and the body position (Ullah, An and Kwak, 2008, p.4).
Results of a series of experiments conducted by Intel Corporation towards performance analysis of IEEE 802.15.4 for on-body sensor network appear on the table of Figure 4.2 below. The sensor nodes, based on Intel Mote 2 engineering platform are placed on a person’s chest, waist, and the right ankle. A packet success rate at transmission power of 0(dBm) is achieved when the person is standing and sitting on a chair. Besides the connection between ankle and waist, which cannot be established even for a short dis-tance of 1.5(m) , all other connections show satisfactory performance.

The IEEE 802.15.4 operates in the 2.4(GHz) unlicensed band. Therefore, another experiment was carried out to determine its co-existence with devices operating on the same frequency, e.g. a microwave oven. Figure 4.3 below shows the results of such experiment.
As it can be seen from the table, when the microwave oven is ON, the packet success rate mean and standard deviation decline to 96.85% and 3.22% respectively. But when the XBee modules are taken 2 meters away from the oven, no packet success rate loss occurs, along with zero standard deviation. As opposed to the discussed on-body nodes,
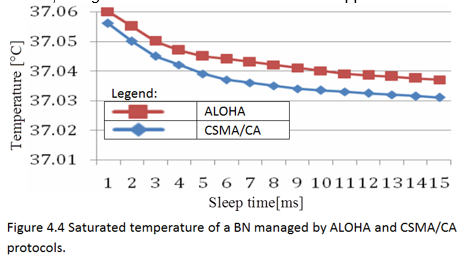
which are located on top of the humans skin, in-body nodes are situated under the skin, where their signals are prone to interuptions from the body’s ellectrical properties (Ullah, An and Kwak, 2008, p. 339,). The human body is complex, it is composed of multiple unpredictable components that are constantly changing. Thus, MAC protocols for in-body sensor networks are more challenging to develop than MAC protocols for on-body sensor networks. On-demand and emergency traffic in in-body BNs require higher reliability than normal traffic, which can be achieved by adjusting initial back-off windows in CSMA/CA.
However, this solution is not recommended for multi-piconets due to high path loss in the human body. For example, for a threshold of 95(dBm) and 85(dBm), the on-body BNs cannot connect or detect the in-body BNs when placed 3 meters away from the body surface. Another issue to be considered by a in-body MAC protocol is the thermal influence on the human body, caused by electromagnetic wave exposure and circuit heat. Figure 4.4 above illustrates the temerature of a in-body BN for ALOHA and CSMA/CA protocols.
In their analysis of MAC protocols for in-body BNs, Ullah, An and Kwak consider a wireless chip introduced by Zarlink Semiconductor Inc., and a subQore radio architecture from the University of Cambridge. The chip supports a very high data rate radio frequency (RF) link communication with an implantable BN. It utilizes the ZL70101 ultra-low power implantable transceiver chip, operating in 402-405(MHz) MICS band. Although other frequency bands such as 916(MHz), 1.5(GHz), and UWB are also considered for in-body sensor networks, the use of open air models for implant communication is discouraged. The subQore radio architecture consumes a peak current less than 1.7(mA) for a duty cycle and tranmission rate of 0.05% and 400(Kbps), respectively (Ullah, An and Kwak, 2008, p. 339).
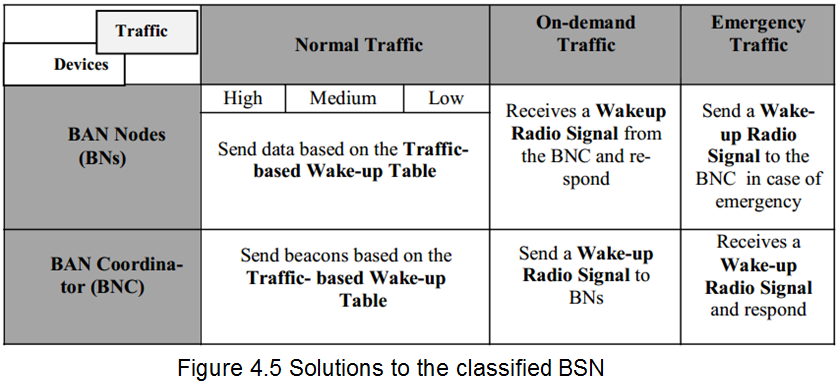
Due to the heterogenous nature of the BNs traffic, it requires both power-efficient and dynamic mechanisms for facilitating power-efficient and reliable communication. A technique known as Traffic Based Wakeup Mechanism that adapts to the assorted BNs’ traffic by categorizing it into normal traffic, on-demand traffic and emergency traffic, according to application requirements, and making use of the patterns relevant to each category.
The table in figure 4.5 below demonstrates the patterns of the classified BSN traffic. Another table, built on top of the previous one is called Traffic Based Wakeup Table, and contains the wake-up patterns of all the BNs. It is maintained and modified by a device called BAN coordinator (BNC), according to the application requirements. New wake-up patterns for energy saving can be calculated by the coordinator as well. Another energy efficient mechanism is BNC
entering sleep mode when when there’s no traffic from the BNs. Awakening the BNC from sleep in emergency and on-demand traffic is done by exchange of very short duration signals between BNs and the BNC. This method, however, has a significant drawback, since traditional radio concepts would cause all BNs to be awakened in response to a single signal, wasting energy, while we only need to wake-up specific one. This issue can be solved by sending signals of different radio frequencies in certain order to wake-up a particular BN. Yet, this would require efficient security management schemes to be applied.
A BSN can have various BNs working on different frequency bands, consequently having different PHY layers. Typically, these are in-body BNs and on-body BNs using unlicensed ISM/UWB and a licensed MICS Band respectively. Besides different PHYs, high path loss and power limitations prevent the in-body BNs from establishing a direct connection with on-body BNs. A special technique called the Bridging function virtually connects the various BNs in a single BSN, creating a common hybrid MAC framework.
Each BN implementing the Bridging function must have at least two PHY interfaces, as it is required to work on at least two channels at the same time. A special table holds all the relevant information: network info, channel ID (band/PHY), BN IDs, connection IDs, connection type (MAC layer), source and destination BN IDs, required by the function to create a channel between single PHY interface BNs of different frequency bands via intermediate BNs with multiple PHY support.
The enhanced MAC layer Bridging function cab also be regarded as MAC Protocol Data Unit Relay (MPDU) for the Data Link layer, as on the PHY layer it receives and stores data from one channel and forwards it to another channel, while the whole process is transparent to the next upper Data Link layer. The Bridging function can also serve as a relay for peer-to-peer transmission in the same network, which is not supported by in-body BNs. Figure 4.6 below shows the protocol stack of the Bridging function.
Energy Efficient Medium Access Protocol for Wireless Medical Body Area Sensor Networks
The second technique fits WBANs with master-slave architecture, where the body-worn slave nodes periodically send sensor readings to a central master node (MN). Such network topology often matches the centralized computing model described in chapter three. The nodes of this network are not deployed in an ad-hoc fashion but rather join the network in a centrally controllable way. Communications of such networks are usually single-hop.
The sensor nodes are asleep until the centrally assigned time slot arrives. No collision of a node within a cluster can occur. As to collision within nearby transmitters, a CCA algorithm based on standard listen-before-transmit is used. Time slot overlaps are handled by wake-up fallback time. This technique has significant energy reductions when compared to more general purpose network MAC protocols such as Bluetooth or ZigBee.
The energy efficient MAC protocol presented by Omeni et al is designed specifically for wireless body area sensor networks (WBASN) applications, focused on spot measurement healthcare applications. These applications are usually attached to the human body to monitor vital signs such as heart rate, body temperature, and other physical activities. The main objective of the proposed MAC protocol is to minimize power consumption by mitigating the following sources of power wastage: idle listening, overhearing and collision (Omeni et al., 2008, p. 252).
The wireless body area sensor networks (WBASNs) adopt a master-slave architecture where the on-body slave node periodically sends monitored data to a central MN. The nodes are deployed in a single-hop, while the joining of a network is centrally managed. This enables the sensor nodes to stay in sleep mode up to the assigned period thereby avoiding waste of energy that occurs when nodes wake up arbitrarily. The application of single-hop communication and centrally controlled sleep or wake-up times significantly minimizes energy consumption compared to other network MAC protocols such as 802.11 or ZigBee.
The controlled sleep or wake up time also reduces collision which is another source of energy waste. Moreover, to avoid further collision with nearby transmitters, a clear channel assessment algorithm based on standard LBT is utilized. The concept of wakeup fallback time is introduced to handle time slot overlaps. Duty cycle analysis shows that when duty cycle is reduced, the overall consumption of the network approaches standby power (Omeni et al., 2008, p. 251).
The proposed MAC protocol is implemented in hardware as part of the Sensium ultra-low power platform, integrated into a WBASN application-specific integrated circuit (ASIC) system on chip (SoC). The completely hardware-implemented MAC reduces the overhead energy consumption of software implementations, as it performs; several International Standard Organization’s and Open System Interconnect (ISO/OSI) functions, originated at the Session layer, preventing those from penetrating to PHY layer. IEEE 802.15.4 is the closest existing MAC protocol to the one proposed by Omeni et al. It is yet not suitable for biomedical WBASN applications because of the following three reasons:
- Data reliability is not handled in the MAC layer
- The protocol has multiple communication modes and is too complex to implement it in hardware.
- The time slots are limited to 16 slots in a super frame. Furthermore, the time slots must all be equally spaced.
In the design of proposed MAC protocol, the assumptions below are made about WBASNs. These assumptions are influenced by the main weaknesses found in general WSN protocols as well as in protocols designed for biomedical WBASN applications, such as Bluetooth, IEEE 802.11 and 802.15.4 (Omeni et al., 2008, p. 252).
- All the wireless sensor nodes are attached to the body.
- The network does not need to react immediately to changes in monitored data, as it arrives at low frequency.
- Typically, the sensor nodes monitor a range of low data rate (less than 1(Kb)) vital signals, such as temperature, pressure and heart rate readings. However, occasionally, applications with higher data rate, e.g. ECG stream, should be handled as well.
- The sensor nodes are miniature and require a lifetime of days. They are powered by very low capacity batteries, such as flexible printed battery technologies or miniature coin cells.
- The sensor nodes are constrained, as they have limited memory and low processing power.
- Data is processed in the central MN which is less power constrained than the wireless sensor nodes.
The proposed MAC protocol design implements a point to multi-point (also called star) network architecture, where the central node acts as the master and the other nodes act as slaves. The slave nodes are sensor nodes in the WBASN and they transfer data acquired during monitoring to the master central node for processing. An individual master-slave network is referred to as a cluster. The implementation of the protocol is simple as the maximum number of slaves connected to a master in one cluster is 8. If more slaves are attached to the MN, the time slotting would have to be managed outside the protocol.
Furthermore, complex network structures extending wide areas can be built by using an IP network to accommodate the connection of various clusters. Although it is possible to form complex networks of a central master with other masters by connecting more slave nodes to the MN, this protocol’s design concentrates on the protocol as it relates to one cluster. The main idea in the proposed network architecture is to move network complexity away from the constrained wireless sensor nodes and into the more capable central node. The network access scheme implemented in the network is CCA/TDMA.
This access scheme has various advantages: it leads to an increase in power saving as it significantly reduces the likelihood of collision and idle listening in the WBASN. Time slot allocation is flexible since it is controlled by the MN. This means that the time slot of a slave node could be changed every time it communicates with the master, allowing the network to efficiently handle traffic fluctuations. The disadvantage of using the proposed network access scheme is that the central node’s complexity is increased. However, as noted above, the central processing node is less constrained in terms of resources when compared to the wireless sensor nodes (Omeni et al., p.2, 2008).
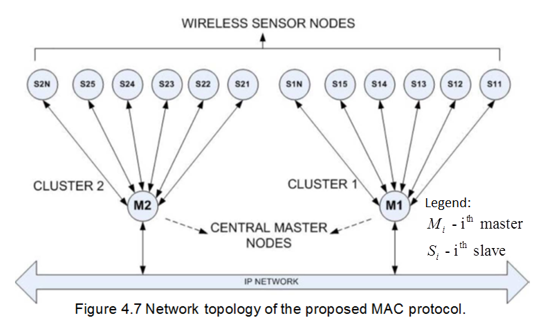
Figure 4.7 below shows the network topology of the proposed MAC protocol. The operation of the proposed MAC protocol is founded on three main communication processes. First one is link establishment process. It occurs when a sensor (slave) node wants to join a cluster. The second process is a wake-up service process, which occurs when slave and master wake-up after an assigned period. Third one is alarm process. It is an exception process and takes place when a slave wants to send urgent data to the MN. In all three processes, communication can only be established by the MN, while only one slave node can join the network at a time (Omeni et al., 2008, p. 253).
Figure 4.8 below consists of three parts, showing the operational stages in each of the three processes in of the proposed MAC protocol. In the link establishment process, the MN is enabled first, then it continuously attempts to establish a link with unattached slave nodes by scanning for a vacant RF channel. When such is found, the MN sends out a unique address beacon and configuration for a slave, staying on that channel for a fixed period of time, listening for a response.
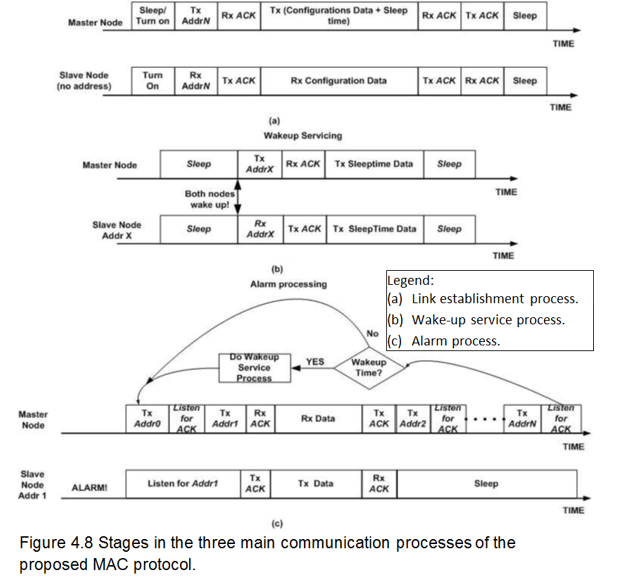
The sum of the master’s beacon transmit and listen time is referred to as Tseek . The next step in the link establishment process is enabling the slave node, so that it can find the beacon sent by the MN on an available RF channel. If the first available RF channel is vacant for Tseek , the slave node hops to the next channel. If the next channel is occupied, the slave node listens for a fixed period of twice Tseek for preamble from the master beacon.
If it still fails to receive the beacon, the slave node hops again to the next channel, and so forth, until a master’s beacon is received. Upon receiving a beacon, it sends an acknowledgement to the MN, which then assigns a sleep time to the slave node and ends the transaction. This marks the end of the link establishment process. At the end of the transaction, the slave node has a unique address, sleep time and configuration information (Omeni et al., 2008, p. 253). Part (a) in Figure 4.8 above illustrates the latter transaction.
The wakeup service process is the second process in the suggested MAC protocol’s operation. During this process, both master and slave nodes’ sleep timers begin a countdown to the set sleep time. The difference in wakeup time between the master and slave nodes is determined by length of the sleep time and the offsets between both timers. This could lead to long term time slot drift between the master and the slaves in a cluster, especially since the master’s timers never change.
However, the long term time slot drift between the master and the slaves can be reduced by introducing a synchronization phase during every communication whereby the slave can synchronize it’s time to that of the master. The synchronization phase must not be set in the default settings of applications, as it could interfere in applications which require fixed time slotting. The best use of the synchronization phase is as an supplementary functionality which may be used if necessary. When the nodes within a cluster wake up, the master requests sensor data or status information from the slave nodes, then assigns a new wakeup time slot to the slaves.
As mentioned before, the third process is a conditional process which occurs during emergency events, such as memory overflow in the sensor node or excessive rise in body temperature or blood glucose level measurements. If a slave node detects such emergency events, it immediately communicates with the MN instead of waiting for its next wakeup time slot. On receiving the alarm request from the slave node, the MN sends out a request in sequence to all the slave nodes’ addresses.
The slave node with the alarm request then listens for its address, and on receiving it, sends the data pertaining to the emergency event to the MN. The above process is, however, impossible if the master is busy servicing a wake-up schedule. If the latter arises during servicing, the communication would be terminated. The unexpected emergency events experienced in the alarm process could complicate the master’s task of centrally managing time slotting (Omeni et al., 2008, p. 253). For this reason, Omeni et al. factored the concept of Wake-up Fallback Time (WFT), into the study.
The WFT is set by the MN during the link establishment process, been applied to the whole WBASN network. In the operation of WFT, if a slave node wakes-up at the assigned time slot finding that the master is busy servicing an alarm request, or that the channel is occupied by an interferer, it goes back to sleep for a period of time he gets from the WFT, to avoid waste of energy. The slave node proceeds to buffer the data packets as it waits for the arrival of its new time slot.
When the time slot arrives, the slave node wakes-up and listens to the channel for the MN’s beacons. Similarly, if the MN fails to communicate with the slave node, it accepts a new time slot set by the WFT. This eventually restores the schedule as both master and slave nodes wake-up at the common WFT time slot. The WFT’s ability of reducing time slot overlaps is essential in preventing the network from being degraded in the long run. It also enables a slave node with a long sleep time to communicate with the MN without having to wait for the initial sleep time again.
Another important attribute in the operation of the MAC protocol is its ability to communicate between two or more layers. These data transmission functions include:
- Attempting to retransmit data packets for a predefined period of time before dropping the packet.
- Automatically breaking large data packets into smaller frames, to enable for them to be transmitted one at a time.
- Automatically reassembling the fragmented data received by the MN.
- Managing the frequency and rate of data transmission, which changes from one application to another.
Usually, data transmission functions are handled by higher layers in the ISO/OSI protocol stack. However, implementing the protocol in hardware directly at the MAC layer is preferable due to energy saving considerations. Normally the processor would continuously perform functions such as determining next sensor reading time, how much data to read at a time, when to switch to another sensor, etc. By relieving this burden from the processor, the protocol decreases standby time of the nodes waiting for the processor, as well as eliminates the delay involved in protocol cross- layers communication.
As said, Omeni et al. implemented the proposed MAC Protocol as a key part of a custom SoC ASIC for biomedical WBASN applications, called Sensium. This mixed-signal SoC is controlled by a power management unit that consists of a half-duplex transceiver, a programmable sensor interface circuitry, a digital block containing the hardware MAC and a low power 8051 microcontroller integrated with 32(Kb) of code memory and same amount of data memory (Omeni et al., 2008, p. 254). The data memory is directly accessible through a DMA controller to both the Sensor Interface analog-to-digital converter (ADC) – to write sensor readings, and to the hardware MAC – to read/write sensor readings for direct transmission/reception. This enables operation of the sensor nodes without reliability on the processor.
Hence, the processor can be adjusted to a low clock frequency and used only in the servicing of emergency events such as link errors. Reliability of the processor in the MN is also limited, thus freeing the processor to transfer monitored data to a PC for further processing or to handle other functions of higher layers. The other principles of operation of the protocol are as following: The radio’s physical layer operates in 870/900(MHz) short range device/ industrial, scientific and medical (SRD/ISM) bands, employing frequency-shift keying (FSK) modulation with 50(KHz)
deviation, to give an over-air bit rate of 50(Kbps). The sensor interface block features sensor driving and interface circuitry for a range of biomedical sensors and includes a 10(bit), 50-500(KHz) sampling rate delta-sigma modulator—analog-to-digital converter (DSM-ADC). An (11, 15) Hamming code is implemented in the MAC hardware together with cyclic redundancy check (CRC) frame checking, which provides two levels of error detection and correction.
The entire Hardware MAC protocol can be considered as simple, lightweight and energy-efficient. The gate count complexity is 12(Kgates) per slave and approximately 25(Kgates) for the master, including the error control and framing block. The software part can be implemented in around 16(KB) of memory, including application code, as compared to at least 32(KB) require for IEEE 802.15.4 implementation. As for the power consumption, the proposed protocol implementation requires about 0.5(mW), in comparison with over 10(mW) required by 802.15.4. The latter follows from the difference in clock of the two protocols. (Omeni et al, 2008, p. 255).
We now move on to system power and duty cycle analysis of the proposed MAC protocol. The average power consumption of a MAC protocol depends on the duty cycle of its operation (Omeni et al., 2008, p. 255). This means that even though a node has a very high sleep time and a similarly high active time, the duty cycle of the node may still be high, and so its average power consumption. The computation below evaluates the duty cycle for spot measurement applications that measure temperature or glucose level, as well as for continuous monitoring applications, like in case of ECG.
The general equation for average power is:

Omeni et al. have experimentally received that Recc ≈3/2.
By definition duty cycle is:
 and symbol rate frequency is:
For spot measurement applications, including the frame overhead time in the duty cycle formula is especially important due to their small data payload. However, for continuous monitoring applications, such as ECG, where frame overhead bits can be neglected comparing to payload bits, frame the overhead time can be neglected. Mathematically speaking: Ns ≈Fadc*Ts and Tfo≈0 , providing:
Observing the latter equation for continuous applications case, we can see that communication symbol rate has a major effect on the of duty cycle via the symbol rate frequency. The table in Figure 4.9 illustrates this fact using typical numbers for three important applications: blood glucose monitoring, temperature sensing and ECG streaming (Omeni et al., 2008, p. 225).
Analysis of a temperature sensing application was carried out to show the relationship between the sleep time, number of transmissions and power consumption in a temperature monitoring application. The sensor data payload was kept fixed while the sleep time was changed. The sampling rate was also spread evenly over a sleep time of 10 minutes, since the data in the simulation was significantly higher than the data in the temperature sensing application, as shown in the table above.
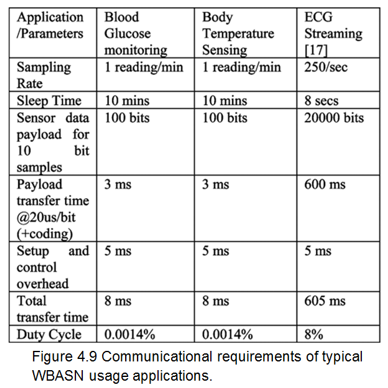
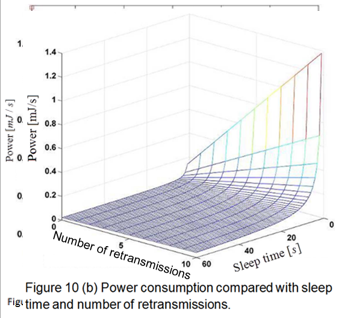
The diagrams in Figures 4.10 (a) and (b) show power consumption versus sleep time, and the power consumption versus sleep time and number of retransmissions, respectively, for a temperature sensing application. The results confirm that, as sleep time increases, the power consumption of the application approaches standby power. Another observation is that an increase in the number of retransmissions positively correlates to an increase in the energy consumption of the application. Hence, the power consumption of the temperature monitoring application is dependent on both the sleep time and the number of retransmissions in its operation.
The duty cycle of spot measurement applications can be reduced by increasing the sleep time of the application, because the overhead. time becomes less significant with an increase in sensor data payload. When this happens, the duty cycle equation we previously had for spot measurement applications converges its form of continuous monitoring applications case. Nevertheless, this approach cannot be used to reduce the duty cycle of continuous monitoring applications, since the duty cycle of these applications is affected mainly by its sampling rate, while an increase in the application’s sleep time would cause an increase in the application’s sensor data payload as well.
These applications’ sleep time becomes less significant with an increase in sensor data payload. When this happens, the duty time is also limited by the scarce resources available for storing monitored data (Omeni et al., 2008, p. 256). According to the measurement results received by Omeni et al., the transmit time for the sensor data payload is approximately 40(ms) (for about 100 samples), which gives a typical duty cycle of 4% for a sleep time of 1 second. However, most spot measurement applications, which are the focus of the proposed MAC design, have much longer sleep times.
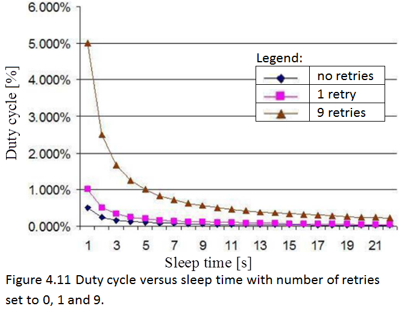
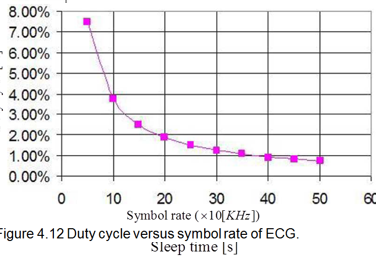
Therefore, the duty cycle would be much smaller, leading to an increase in energy savings. Figures 4.11 and 4.12 shows the results of an analysis of relationship between sleep time and duty cycle in spot measurement applications. Figure 4.11 reflects the results from the table in Figure 4.9 as a diagram, illustrating that as sleep time increases, the duty cycle decreases, quickly converging to zero even for 9 retries. The diagram in Figure 4.12 belongs to ECG s treaming application. Here the duty cycle is fixed by transmit/receive rate, while the diagram shows duty cycle converging to zero as the symbol rate increases.
In all application types, the duty cycle determines the time slot allocations to the slave devices in a cluster network and, eventually, limits the number of slave nodes that can be supported in a cluster. For instance, a blood glucose monitoring application can support a maximum of 255 slave nodes as it has a duty cycle of 0.0014%, while an ECG application with the measurements given in figure 4.9 can only support a maximum of 8 slave nodes as it has a duty cycle of 8%. In practice, the slave nodes would be kept to a maximum of 6 nodes to allow for retransmissions (Omeni et al., 2008, p.6).
In order to measure the power consumption of the proposed MAC protocol , an actual printed circuit board (PCB), appearing on Figure 4.13 below, was fabricated. The PCB was mounted on a demo board with a breadboard area for connecting the application sensors, simulating the human body, as well as other interfaces such as serial peripheral interface (SPI), UART and Universal Serial Bus (USB). When temperature sensing, ECG streaming and other applications accesses the PCB, the electrical current consumptions of the sensors were monitored. All performance measurements used a dipole antenna with master and slave nodes both being stationery, at a separation distance of 5 meters and RF transmit power of 10(dBm).
The overall measured packet error rate is 0.04%. However, it is detectable using CRC that failed data packets can be retransmitted at a later time slot. On average, the number of retries is below 1%. Although, this varies with the agility of the radio when there is relative movement between the nodes (Omeni et al., 2008, p. 257).
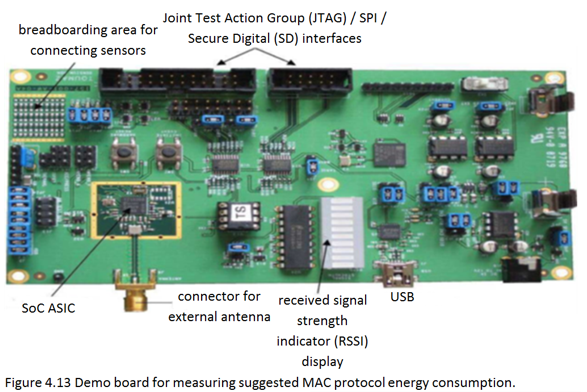
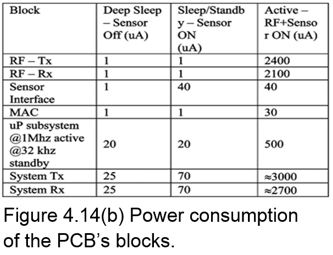
The PCB’s blocks have three power states: active, sleep/standby and deep sleep. The table in Figure 4.14(a) shows the power modes and states of each of the blocks, whereas Figure 4.14(b shows their consumption, given the fact that the whole PCB is powered by voltage supply of 1(v) . All the blocks are turned on in active mode. In sleep mode the 16(MHz) clock is turned off, yet leaving the sensor interface turned on.
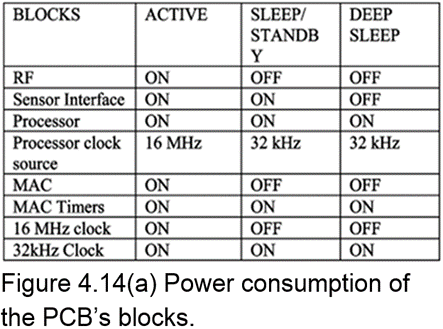
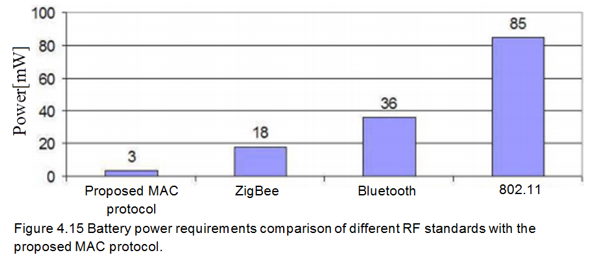
Deep sleep mode is the lowest power mode, having both the clock and the sensor interface turned off, to be turned on again upon wake-up. The MAC timers remain active throughout the operation of all power blocks, as they control the timing of the three power modes. Moreover, each of them runs off a separate 32(KHz) Xtal crystal, significantly reducing transmitting power consumption in the digital block (Omeni et al.,2008, p. 257). The MAC protocol power consumption is about 1% of the total power consumption of Sensium SoC, as Figure 4.15 below shows. This is significantly lower compared to other existing protocols such as Bluetooth and ZigBee.
The RF power requirements of the proposed protocol are significantly lower, making possible the usage of flexible-thin or zinc-air batteries, which can’t be used for any of the other standards. Moreover, the power requirements of the suggested protocol may be minimized even more if it is customized to a specific application area.
Energy-Efficient Low Duty Cycle MAC Protocol for Wireless Body Area Networks
The third technique is best for devices measuring physiological signals such as EEG and ECGover fixed topology WBANs. The protocol proposed by Marinkovic et al. is energy efficient for both streaming communication and short transmissions of data bursts, and can thus be used for different types of physiological signals with different sample rates (Marinkovic et al., 2009, p.915). The main goal of the energy efficient MAC protocol is to ensure energy efficient and reliable communication that can support streaming of larger amounts of data. The protocol takes advantage of the static nature/fixed topology of the BAN to implement an effective TDMA strategy with very little amount of overhead and almost no idle listening.
TDMA synchronization problems are investigated and various solutions to these problems are presented. The power consumption and battery life predictions of the proposed MAC protocol are analysed using duty cycle calculations, and validated through measurements. The protocol is implemented on the ADF70XXMBZ2 development platforms with ADF7020 RF transceivers, all by Analog Devices Inc. The results show that the protocol is energy efficient for both streaming communication and sending short bursts of data. Therefore, the protocol can be used for different types of physiological signals with different sampling rates.
The proposed protocol has four major characteristics to ensure energy efficiency and reliability in a WBAN (Marinkovic et al, 2009, p. 916):
- Elimination of collision during data packet transmission. Since collision is one of the major sources of energy waste in a sensor network, the protocol keeps collision in the network at the lowest possible level by implementing a TDMA based access scheme.
- Elimination of latency or data packet loss. The protocol’s reliability is assured by its robustness to communication errors, lowering the probability of losing data packets; unless during malfunction of hardware.
- Elimination of energy waste by allowing long sleep times for the sensors. The protocol also reduces power consumption by eliminating the need for channel listening, hence saving energy which would usually be spent on idle listening.
- Ability to carry out reliable real-time or near real-time communication channel observation, if it is required.
The design of the proposed protocol is next to come. The network topology of WBANs demands that the nodes are spread over a very small area, and therefore their power resources are heavily limited. Hence, the concept of gateway points are introduced in the network to be used as network coordinators as they are less power constrained. For instance, such nodes can be carried around the belt of a patient. The concept of gateway points can result in very low transmission rate for the sensors and, ultimately, effective TDMA timing control (Marinkovic et al, 2009, p. 916). Figure 4.16 below shows the network topology of the proposed MAC protocol.
The topology assumes that the sensor nodes in a WBAN have predetermined functions, depending on their position on the body or the data to be monitored. The distance between the sensor nodes and the MN is shorter than the distance between MNs and the monitoring station. This is important because the shorter the distance required by the sensor nodes to transmit data is; the less energy is consumed in the transmission process. In a WBAN, this could lead to significant energy savings, since the distance between the origin of the signals to be monitored and the sensor nodes in a WBAN is usually less than 1(m) (Marinkovic et al., 2009, p. 916).
Another advantage of this low range of communication is frequency reuse for communicating with sensors. Also benefit is that nodes distant over 1(m) away are unable to eavesdrop nodes communication, thereby increasing the network security. Observing Figure 4.16 reveals the existence of a hierarchy in the protocol’s network architecture. The more energy constrained sensor nodes are used for ADC sampling of signals such as ECG or EEG, while the less energy constrained MNsare used for transmission of data over long distances, or for other power hungry functions such as digital signal processing (DSP).
The protocol’s design also incorporates a TDMA MAC strategy to efficiently lower the amount of unnecessary overhead and idle listening. The aim of the TDMA strategy is to make communication time as small as possible compared to the sensor’s sleep time. The MNs are used to control data transmission to the sensor nodes and time synchronization of the protocol, as shown in figure 4.17 below. The top part shows one time frame with the master’s RF activity, while the bottom part shows the sensor node’s RF activity with the second given time slot. During power-down mode, only the internal time counter and ADC sampling are active. The timeslots S1 to Sn are allocated to n different sensors.
The RS slots are extra slots which are reserved for data retransmission in case of packet failure. A guard time Tg is inserted between every two consecutive slots to prevent overlapping of the transmissions from different sensors due to clock drift. The remainder of the T frame is used for transmission to the monitoring station (MS), which can be communicated in two different ways, depending on the number of transceivers.
The first form of communication is when the MN has only one transceiver. In this case, the time frame should leave sufficient time for the communication between the MN and the MS. This can either be done with the same protocol or with a different protocol. The ADF7020 transceiver used in the implementation can support both short-range communications within the BAN and mid-range communications from the MN to the BS, as it has a programmable output power from 16 to 13 (dBM).
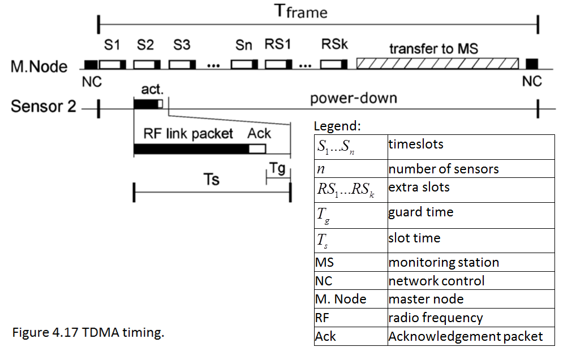
The second form of communication to the MS occurs when the MN has two transceivers. One of the transceivers is used for its communication with the sensors, while the other transceiver is used for communicating the MS. In this form of communication, there is no need to leave time in the time frame for transfer to the MS. The disadvantage of the second form of communication is that it makes the MN more complex and thereby causes it to consume more power. However, the advantages are that it makes it possible to connect more sensors to an MN and allows the use of some standardized protocol, such as Bluetooth, for communication with the MS.
At the end of the time frame, the master sends a network control (NC) packet. Although this packet is capable of performing many network commands, is mainly used for general network control information, time frame synchronization in alarm conditions, and forming of the network. Each sensor is assigned the number of time frames that can pass before listening to the NC packet, but the maximum number of time frames is limited due to the need to simplify network forming and reduce energy waste. The maximum number of TDMA cycles that can pass before resynchronization is determined by the guard time of a slot which ensures that the sensor nodes turn on the transceiver before the transmission of the NC packet, and the clock accuracy of the sensor (Marinkovic et al., 2009, p. 917).
The protocol’s data link layer consists of a direct current free preamble pattern. The preamble is followed by a number of synchronization (SYNC) bits, which are necessary for the automatic recognition of the data field by the hardware. The frame length, in bytes, is the first part of the data field followed by the sending of the MPDU packet. The MPDU frame starts with 3 bytes overhead and represents Addr – the sensor address, frame type information such as type of service (ToS) and other information dependent on the packet type. In the proposed MAC protocol implementation, the MPDU frame is used for packet ID, extra slot demand (ESD), next assigned slot (NAS) indication and other information about the packet, depending on the higher protocol layers. The MPDU frame is followed by a payload, if necessary, and, eventually, by the CRC check.
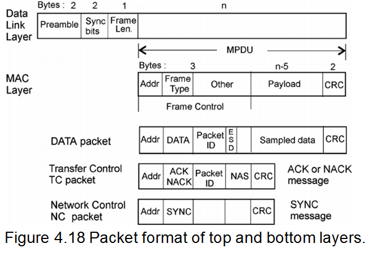
Figure 4.18 above shows the latter packet formats. The proposed implementation uses two types of packets: data packets and control packets. A data packet is a packet that contains sampled data from the sensor. Its overhead is the packet ID field, which is the packet counter, and the ESD field necessary for extra time slots. These may be required in case of emergency events in the network, or in case there is need for retransmission.
Control packets of the second type consist of two sub types: transfer control packets and network control packets. Transfer control packets are acknowledged (ACK) and not acknowledged (NACK) messages sent from the master to a single sensor, containing the NAS information. Network control packets are sent by the master to all sensors during the last time slot of every time frame. The control packets are also used for synchronization (Marinkovic et al., 2009, p. 918).
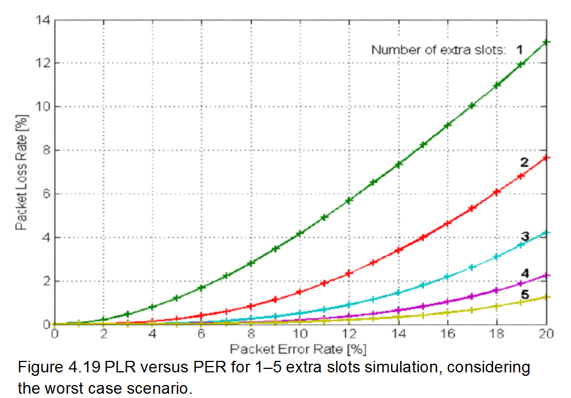
The application considered in the implementation of the proposed protocol, is a continuous medical monitoring application, where every sensor node has a single function such as EEG and ECG. The number of unused time slots needed to minimize packet loss rate (PLR) is calculated using simulation and is determined by three main factors: targeted packet loss ratio, packet error rate (PER) and number of sensors attached to the master. A worst case scenario is considered – scenario where sensors only have enough memory for one packet of data. Both the initial transmission and retransmission of data are carried out in the designated TDMA frame.
In case a data packet is not sent within the assigned time frame, it is presumed that the packet is lost, and that the sampling of another packet has occurred. This is also the case if a sensor does not receive information of the assigned extra slot due to an error in NACK, runs out of extra time slots for data sending due to multiple errors, or if a sensor’s extra slots are taken by other sensors. Monte Carlo method and MATLAB pseudorandom generator are used in the simulation. 1,000,000 TDMA cycles for each PER value and each number of extra slots are performed. The average error probability with packets being rejected randomly is 0.01 to 0.2 .
The percentage of packets being lost after retransmission is measured and the probability of losing ACK/NAC packets is considered as well. The simulation performed for 10 sensor networks is shown in figure 4.19 below.
However, the simulation does not consider packet buffering, which in a real life application where sensors have enough memory would allow the sensors to buffer at least two packets, and then send the data to the ESD field. Real life applications could also employ forward error correction codes which would significantly lower the application’s PLR close to zero, although packet loss in the worst case scenario would lead to some lag (Marinkovic et al., 2009, p. 919).
The implementation of the proposed MAC protocol considers the following principles of operation:
- The implementation uses two extra slots for ten sensors, which is an acceptable PER of 5% or 6%.
- The protocol is implemented on the Analog Devices Inc. ADF70XXMBZ2 development platforms with ADF7020 RF transceivers.
- The network has 10 sensors and one MN.
- Each sensor board sends a simulated data stream of 1250(bit/s). The data is sampled with a frequency of 125(Hz) and 10(bit) sample size, which is equivalent to a sampling rate of 125(samples/s) as proposed for ECG monitoring device.
- The physical layer used in the implementation is the ISM 433(MHz) band employing Gaussian frequency-shift keying (GFSK) modulation, with transmission bit rate of 34560(bit/s) dictated by the hardware used.
- The frame time used in the implementation is 1(s).
- The packet format used is the one shown in figure 4.18 above. The packet format’s details for sampling rates of 1250(bit/s) and 2500(bit/sec) are shown in figure 4.20 (columns (a) and (b), respectively) below.
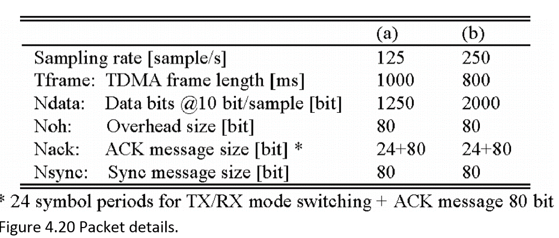
TDMA Frame calculation for the proposed MAC implementation appears below. The below map of symbols is used for this and following calculations of the current suggested MAC protocol:
The ADF79XXMBZ2 development board has a 32(KHz) crystal clock real time clock (RTC) with typical accuracy of about 100(ppm) = 0.1%, used for TDMA frame counting and synchronization. The maximum number of TDMA frames that can pass before the sensor needs to resynchronize is calculated as follows:
 , according to the worst case of minimum slot guard time. In the protocol’s implementation, this guard time is set to Tg = 4(ms), while the frame time is set to Tframe = 1(s). By substituting the latter in the equation for Nr we get
The TDM time frame consists of Ns timeslots, allocated to sensor transmission, packet retransmission and communication with the MS. The total number of time slots depends on sensor sampling rate and communication data rate used for the given time frame length by definition:
 . Slot duration is chosen to be

 and the number of timeslots then becomes:
The proposed MAC implementation has communication rate of 34560(bps), sampling rate of 1250(bps) , and frame time of 1000(ms) = 1(s), allowing Ns=22 timeslots to be used in a single TDMA frame. These timeslots are then divided as follows: 10 slots for regular communication with the 10 sensors, 2 serving as extra slots, 1 slot for NC packet and 9 timeslots for the communication between MN and MS. The latter 9 timeslots cannot allow data transmission between MN and MS in the proposed MAC implementation since it has ten sensors and low data rate. However, the transmission of data between MN and MS in the implementation is achievable if a protocol with high data rate is used. For instance, if Bluetooth with data rate of 1(Kbps) , or ZigBee with data rate of 200(Kbps) was used, the data transmission from MN to MS with the nine timeslots would take a communication time of 0.41(s) .
The implementation could then transmit 12500(bit) of data from the ten sensors. However, the proposed MAC implementation was used to accurately test its power consumption in the transceiver. Implementation of the proposed MAC in a real application would require that sufficient time be left for the communication with the MS by increasing data rate to 200(Kbps) (Marinkovic et al., 2009, p. 919).
The duty cycle of the proposed MAC protocol is calculated as the amount of time that the transceiver is on, regardless of whether it is transmitting data, receiving data, or idly listening to a clear channel. Every TDMA frame is used as the sampling rate of continuous monitoring applications is over 100 samples per second, which is higher than that of other BAN sensors types. Duty cycle is calculated as the average RF activity time during the TDMA time frame divided by the duration of the frame duration time. Complete RF activity time, which is the amount of time necessary for switching the transceiver on, sending data (sensor sampled and overhead), receiving an ACK packet and synchronization, altogether, is calculated as follows: Tactive = Ton + Tdata + Toh + Tack + Tsync/Nr.
The duty cycle is, by definition:
 , and by substituting Tactive with the expression above we get:
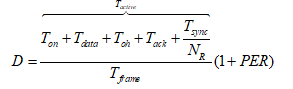
The waiting time for synchronization packet to arrive is computed as ![]() , while the overall synchronization time is, by definition,
, while the overall synchronization time is, by definition, ![]() . Substitution of Tws with the latter expression and Tdata, Toh and Tack with previously mentioned expressions, provides:
. Substitution of Tws with the latter expression and Tdata, Toh and Tack with previously mentioned expressions, provides:
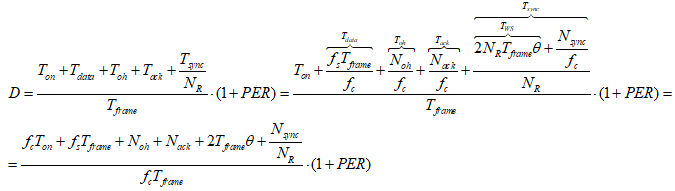
 allows us to represent the duty cycle of the RF transceiver in the following short form:
 . If other sensors with sampling rates below 100 samples per second are present in the network, they will not send data every time frame, but after every Nc time frames. To account for clock drift, these sensors will need to resynchronize every Nr time frame. In this case, the duty cycle is calculated as the average RF activity in Nc time frames divided by the length of Nc time frames, which is given as:
 , while
Substituting Tdata develops into:
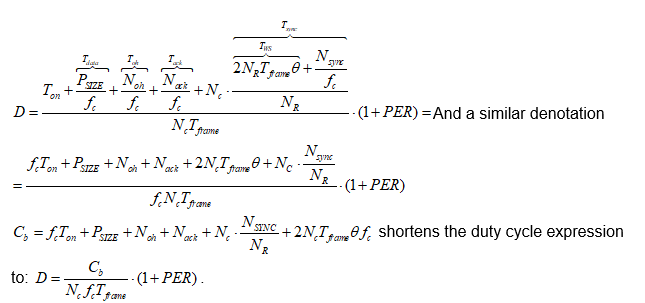
The 1+PER factor that we see in the expressions for duty cycle keeps into account how PER influences the duty cycle to the retransmission data because of the errors. This factor is directly transferred, through duty cycle increase, to the average consumed power (Marinkovic et al., 2009, p. 920). It appears so that the duty cycle is the most important power optimization parameter for all WBAN MAC layer protocols, as it is the most influential due to its minimal dependency on the transceiver used. The MAC protocol proposed by Marinkovic et al. aspires to optimize the duty cycle by reducing communication overhead and idle listening.
Measurement and power analysis of the protocol comes next. Given that the availability of energy is the most significant aspect in a BAN, measurements were taken to make an accurate power model for this protocol. While the power consumption analysis for this protocol is based on the transceiver used in the implementation, it can be adapted for different results by changing the duty cycle or using other types of transceivers. Several figures below show current and timing measurements taken by Marinkovic et al. for the proposed protocol’s implementation. Figure 4.21 (a) below shows the number of cycles for a single sensor.
It reveals that there is a burst of data every second and one sync catch after the first burst. Figure 4.21 (b) further illustrates a closer view of the synchronization reception and burst of data in the fourth timeslot.
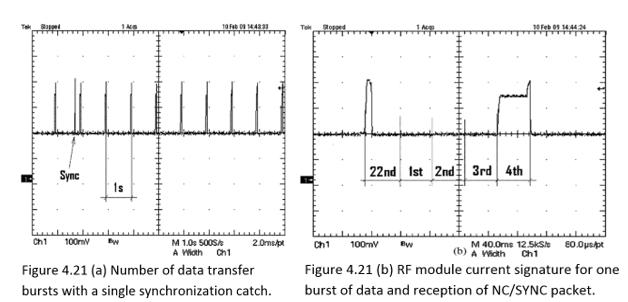
Current consumption for transmitting data at -10(dB) is lower than during the reception of data. Hence, there is slope when the transceiver switches ON as each part of it becomes active consecutively. At this point, 1250(bit)data + 80(bit) preable = 1330(bit) are is sent at 34560(bps) for the following 1330(bit)/34560(bps) = 38.3(ms). Next, the transceiver is set to receive mode, the current rises, an acknowledgement is received and, finally, the transceiver is switched OFF. The latter is shown on figures 22 (a) and 22 (b) below:
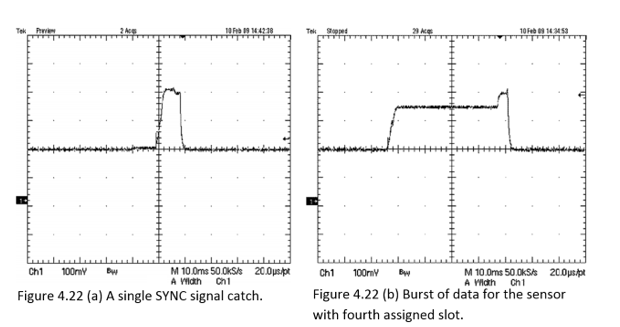
In Figure 4.23 (a) below, the current signatures of sensors with two adjacent timeslots is shown, while figure 4.23 (b) shows a close-up view of the transition between two timeslots. The guard time of 4(ms) assigned between two adjacent timeslots is effectively utilized for switching OFF the transceiver from the first sensor and switching ON the second one.
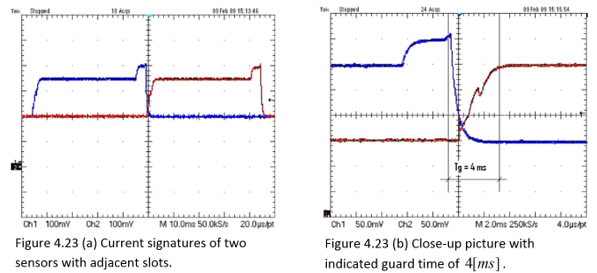
Measured time and RF transceiver current values are used to create an accurate power model of the protocol for the transceiver utilized in the implementation. The current of the RF transceiver is measured via a special current-sense resistor of Rs=10(Ω) put in series with the RF module on the power supply line. The energy consumption is put together by RF activity duty cycle along with average current during the activity period.
Current consumption stays the same during data reception, hence lowering the transmission power and the total transmission time could improve the energy consumption. Duty cycle is the key parameter for comparison of WBAN’s energy efficiency, while the comparison of the duty cycle should be done with the same operating conditions, sampling rate and RF communication data rate (Marinkovic et al. 2009, p. 921). The complete average communication power can be computed according to the following formula: Pav=D*Vdd*Iactive.
Figure 4.24 shows the electric current consumption numerical values diagram for the transceiver, graphical current diagrams of which we previously saw in figures 4.21 (a), 4.21 (b), 4.22 (a), 4.22 (b), 4.23 (a) and 4.23 (b). Upper line (1) is TDMA timing, while lower line (2) is sensor 2 RF current signature. The ADF7020 transceiver consumes 19-20(mA) and 15-30(mA) (depending on the chosen transmission power) in receiving and transmitting mode, respectively.
Its measured current, with transmission power set to -10(dBm) is found to be slightly lower than the expected 15.9(mA)(Marinkovic et al, 2009, p. 922, 2009). Furthermore, the authors propose a sequenced power on routine to further manage the power consumption by effectively switching each part of the transceiver on consecutively thereby preventing battery life from being affected by sudden current changes. The average power consumption for sending the data is calculated to be 2.04(mW) at 3(V) , with calculation being made using time frame of 1(s) , resynchronization rate of 20 time frames and previously measured time and current values.
The results of measured and calculated time and current values appear in table of Figure 4.25. These calculated results relate to data sampled at 1250(Kbps) and communication data rate of 34560(Kbps) . However, the calculated power consumption changes with the change of communication data rates or channel quality. Hence, the average RF power consumption can be lowered by increasing communication data rate and duty cycle. For instance, figure 4.26 shows duty cycle versus RF data rate. The graph curves are plotted using the duty cycle equation D=(Ca/fc*Tframe)*(1+PER), which we previously saw. Curves 1 and 2 consider the MAC protocol suggested by Marinkovic et al. for sampling rate of 1250(Kbps)
and 250(Kbps) respectively. Curve 3 belongs to the MAC protocol suggested by Omeni et al., which was previously discussed, for sampling rate .
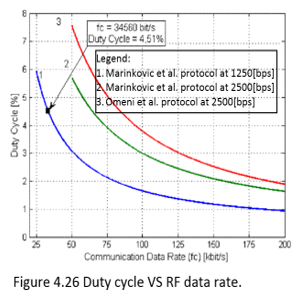
The power consumption analysis carried out by the authors does not take into account the energy that was consumed during network forming. However, the authors coherently explain that in fact, energy consumed during network forming would be negligible if the network is active for a long time. Hence, when each sensor switches on its transceiver into receive mode and listens to an NC packet, it waits for the duration of a time frame as, since the NC packets are transmitted at the end of every time frame. The energy consumed during that time is E=Twait*Vadd*Ir, while Ir=2(mA) in the implemented network).
Therefore, the method of slot assignment proposed by the authors is practical for long monitoring sessions, as expected in the patient monitoring application for which the protocol is developed. For short monitoring sessions, the authors propose the use of less average wait time. Therefore, MN must transmit SYNC message at the beginning of every timeslot, in which case the longest waiting time is the whole duration of a single TDMA slot. Hence, the sensor energy required for initial synchronization would be lowered, while the energy consumption required for streaming would remain the same. However, the method would also lead to reduced channel utilization.
A comparison of the MAC protocol proposed by Marinkovic et al. with two other low power protocols is next to come. Instead of using protocols for generic WSNs for comparison, the authors compare the protocol’s duty cycle and power consumption with two other protocols, both of which have much lower power consumption than generic ones (Marinkovic et al., 2009, p. 922). One of these two is a low duty cycle protocol proposed by Omeni et al., previously reviewed in this chapter. The other one is a low-power protocol proposed by Silva and Heidemann, not covered by this essay.. The comparison implicates same sampling rates, data rates and packet length.
The graph in Figure 4.26 was obtained by Marinkovic et al. having packer error rate percentage of PER=3%, sensor clock accuracy percentage of θ= ±100(ppm) and packet format details from the table of Figure 4.20. As Figure 4.26 shows, the proposed protocol overcomes the one proposed by Omeni et al. in duty cycle for the same sampling rate of 2500(bps). Consequently, using the previously seen formula Pav=D*Vdd*Iactive, this advantage of Marinkovic protocol can be translated to power estimation advantage, where the expression Vdd*Iactive is transceiver dependent. Figure 4.27 and Figure 4.28 below compare the proposed protocol with the low power protocol by Silva and Heidemann and by duty cycle as well as by optimal power consumption for RF data rate of 19.2(Kbps) and 250(Kbps) , respectively.
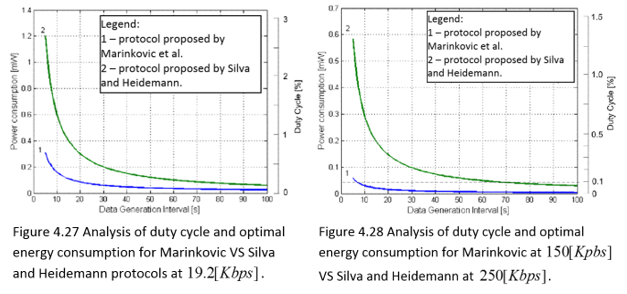
The results in figures 4.27 and 4.28 are based on the table in Figure 4.29, showing comparison details for hardware used in the protocols proposed by Marinkovic et al. and Silva and Heidemann.
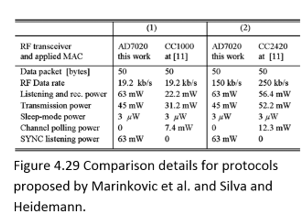
The comparison of Marinkovic et al. protocol with Silva and Heidemann protocol is not based on duty cycle, but is rather based directly on power consumption due to lack of the application’s duty cycle analysis the latter. As shown in figures 4.27 and 4.28 above, despite the fact that the protocol proposed by Silva and Heidemann has low duty cycle, the protocol by Marinkovic et al. has even lower duty cycle and, leading to the conclusion that it outperforms by power consumption as well.
Yet, it needs to be noted that the protocol by Silva and Heidemann was designed for multihop neworks, while the protocol by Marinkovic et al. was oriented towards single hop WBANs.Since Omeni et al. protocol and Silva and Heidemann protocol both outperform generic WSN protocols, the fact that Marinkovic et al. protocol consumes less power than the other two, there’s no need to compare it to the generic protocols, knowing the result ahead.
We continue by providing some details about the application of the protocol proposed by Marinkovic et al. The protocol provides significant savings in transmission power, which can then be used to carry out some supplemental signal processing at the sensors in a WBAN. This would enable near real-time monitoring of patients’ vital signals, thereby reducing the medics’ work load by focusing on important information, while effectively managing power consumption. In turn, low power consumption would enable small devices or applications equipped with small and light batteries to have an acceptable lifetime.
For instance, Marinkovic et al. provide a case study of a system comprising EEG sensors with seizure detection algorithm and communications using the proposed protocol. In the case study, it is presumed that:
- Data are sampled continuously at 256(Hz) at 16 bits per sample.
- Stream data rate of this signal would amount to sensor sampling data rate of fs = 4096(bps).
- The AD7020 transceiver is used.
- The transceiver is working at maximum communication data rate of Fc=200(Kbps).
- Time frame of Tframe = 488(ms).
- Packet size is 2000(bit).
- Duty cycle of D=1.35%.
- The transceiver would require 0.61 (mW) to transfer the above data.
In a scenario whereby a full system implementation incorporating an EEG amplifier stage and data transmission stage uses the proposed protocol, the power used for amplification and filtering the signal must be considered. Plus, the power used by processing unit that converts the data to digital samples and drives the transceiver must be considered as well. For instance, during the process of sending raw data, the processing power will be lower, but communication power will be higher.
Furthermore, any compression of the data and/or seizure detection is done at MNs. However, in a seizure detection system (whereby a sensor has a signal processing element that does seizure detection on the spot), only the required data segments need to be transmitted to the MS. Therefore, the amount of seizure EEG data will be much lower than the amount of non seizure data – a ratio of 1:70 (Marinkovic et al, 2009, p. 924). If only EEG classified as containing seizure needs to be transmitted, then transmission only considers a fraction of the data processed. The transceiver using the proposed protocol would approximately require average power of 25(μW) for sending only seizure data (here duty cycle is calculated for Nc=70). This would leave battery power available, given the low consumption of the proposed protocol, to implement signal processing algorithms, such as an EEG seizure detection algorithm, whose power usage stands at a few milliwatts.
This means that the proposed protocol can both transmit and process data for the same power used to transmit data using ZigBee and other protocols. Moreover, if signal processing is optimized, the amount of data that needs to be transmitted can be greatly reduced, thus lowering power usage even further. In conclusion, the proposed protocol could be significantly beneficial and reliable in clinical applications.
Battery-Dynamics Driven TDMA MAC Protocols
The fourth technique is a set of cross-layer based battery-aware TDMA MAC protocols for WBANs. By taking into account the joint effect of electrochemical properties of the battery, time-varying wireless fading channels and packet queuing characteristics, it is possible to prolong the battery lifespan of the wireless sensor nodes. This, while still guaranteeing reliable and timely message delivery, which is critically important for WBANs.
Both analytical and simulation obtained results show that the proposed schemes can significantly increase the battery lifespan of sensor nodes while satisfying the reliability and delay-bound QoS requirements for wireless body-area monitoring networks (Su and Zhang, 2009, p. 424). The proposed MAC design contains three main system models: basic framework, battery discharge dynamics and wireless channel model. The computational parts appearing in the description below of each of the three models is based on the following map of symbols:


The basic framework model of the MAC design adopts a system architecture whereby the sensor nodes, which are powered by a battery with limited energy resources, communicate with the coordinator by using a single transmit and single receive antenna. The communication between the sensor nodes and the coordinator occurs at a constant power and is based on TDMA scheduling. The TDMA frame structure is divided into periods, each with three main time slots: the beacon time slot, the active time slot, and the inactive time slot.
In the beacon time slot, the sensor nodes wake up to receive the coordinator’s beacon signal, containing information about the length of the time frame and the channel state information (CSI). No data is exchanged between the sensor nodes and the coordinator. Each sensor node has a distinct active time frame with the length of TDMA timeslot, determined by the sensor node, depending on the channel condition and the packet scheduling schemes. This means that a sensor node remains in sleep mode unless it has data to send, thereby reducing the overall energy consumption (Su and Zhang, 2009, p. 425).
The battery discharge dynamics system model is based on the battery’s recovery capacity effect, meaning that the batteries are capable of recovering their initial voltage value when they remain idle for a certain period of time. The recovery process of the battery is dependent on two main attributes: the charge state of the batteries and the idle time duration of the batteries. Therefore, as the battery is discharged, the recovery capability decreases until all the active materials that react electrochemically in the production of electrical energy are consumed. The authors further characterize a battery into two capacities: theoretical and nominal.
The theoretical capacity of batteries is decided by the amount of active materials contained in the cell and is expressed in terms of ampere-hours. The total number of discharges cannot exceed the battery’s theoretical capacity. The nominal capacity of a battery is defined as the actual capacity available when the battery is discharged at a specific constant current. The nominal capacity of a battery can increase when the battery remains idle for a specific period of time, due to the battery’s recovery capacity effect (Su and Zhang,2009, p. 426). Let us observe a scenario where the amount of capacity necessary to transmit packets during one time slot is set to one unit of the charge.. The remaining battery capacity is, obviously, smaller than its nominal capacity (mathematically speaking, Er < En. According to a battery discharge model on which Su and Zhang’s research is based, the dynamics of the batteries used in the model’s implementation are described as follows:
A single unit of charge is consumed if the sensor node transmits packets during a single timeslot.
 if the sensor node remains idle for a period of time. The probability expression shows that , the smaller c is, the larger recovery probability gets.
 , it is used to model the wireless fading channel. The probability density function of the received SNR is then given by:
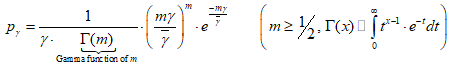
The Nakagami- m model can embrace various types of wireless fading channels. For instance Rayleigh channel, which is a special case of Nakagami- m model when m=1 , or Rician fading channels that can be approximated by the Nakagami- m model by a one-to-one mapping between the Nakagami- m fading parameter and the Rician factor (Su and Zhang, 2009, p. 426).
The proposed protocol schemes are next to be discussed. They are based on the reasonable expectation that a battery can yield a longer life span if it has more idle time between two consecutive discharge states, due the battery recovery capacity effect. The proposed schemes take into account the joint effect of the battery dynamics, the wireless-channel qualities at the physical layer and queuing characteristics at the data link layer.
The main idea is making the sensor nodes to efficiently and fully utilize the time slots. Hence, the schemes employ TDMA based scheduling with the aim of maximizing inactive time slots in order to use the battery recovery capacity effect, while satisfying the delay QoS requirements. For instance, the sensor nodes transmit the packets in the buffer only if the channel is good and the buffer size is large enough.
This may lead to an increase in the number of inactive time slots, enabling the battery to recover capacity and thus prolong the lifespan of the sensor nodes. However, holding more packets in the buffer introduces larger packet delay and packet drop rate of the sensor nodes, which clearly imposes a tradeoff between the battery lifetime span and packet delay and loss QoS requirements. Figure 4.20 below shows the system architecture of the proposed MAC protocol schemes.
A finite length First-In-First-Out (FIFO) queue/buffer is employed at the sensor nodes. If the buffer is full, new arriving packets are dropped while the packets queuing through the buffer go through processing at the adaptive modulation module, and finally transmitted to the antenna. The adaptive modulation is essential in maximizing the data rate by adjusting the parameters of transmission that are available to the CSI, while at the same time, it maintains a predetermined bit error rate (BER).
At the beginning of each frame period, the sensor nodes analyze the signal strength of the beacon frame received from the coordinator in order to estimate the CSI. The received CSI and the queue length information are used together to control the adaptive modulation module in deciding the data rate for packet transmissions. Figure 4.21 illustrates the structure of a data packet. Packet signaling overhead consists of 20 bytes, of which 6 are at physical layer and 14 at MAC layer.
The authors introduce three parameters:
θa, θb and θc to achieve the fine balance between the idle probability of timeslots and packet delay, as well as drop rate. In the proposed MAC protocol schemes, each frame starts with estimation of the number of packets that can be transmitted during its period, performed by each sensor. When the queue size is no larger than θc , the sensor nodes avoid transmitting packets if the estimated number of packets that can be retransmitted is less than θa or the queue size is smaller than θb, where θc > MAX {θa, θb}(Su and Zhang, 2009, p. 427).
The purpose of θc is to make the proposed protocol schemes operate like a standard TDMA scheme when the buffer size is largem providing the most stringent delay QoS requirements for the sensor nodes for θa=θb=1. The pseudo code of the proposed schemes is shown in Figure 4.22. As expected, higher θa and θb result in higher packet delay, packet drop rate and higher probability of time slots.
An analytical power model for the proposed schemes comes next. It tunes up the tradeoff between battery lifespan and packet delay through analytical models and simulations. The analytical power model consists of three parts: adaptive modulation module, queuing model and performance metrics.
We’ll start with the first part of analytical queuing model: adaptive modulation module. Quadrature amplitude modulation (QAM) is both analog and a digital modulation scheme. It conveys two analog message signals, or two digital bit streams, by changing (modulating) the amplitudes of two carrier waves. Amplitude-shift keying scheme (ASK) is used for digital modulation, while amplitude modulation (AM) scheme is used for analog modulation. Adaptive modulation module adopts two variations of the QAM scheme: square M-ary and rectangular M-ary . The relation between number of symbols of QAM and the dimensions of constellation symbols rectangle/square is I=J=√M for square M-ary and M = I*J for rectangular M-ary . The BER of M-ary
QAM is given by:

Where the probability that an error occurred in the k-th bit of x component (either in-phase or quadrature) can be expressed as:

The SNR domain is divided into Ntm +1 non-overlapping consecutive intervals with boundary points range of (γn, γn+1) where 0⩽n⩽Ntm. Transmission mode n is selected when γ∈ . To avoid transmission in deep channel fading, no data is sent when the signal-to-noise ratio is γ∈ (γn, γn+1) γ∈. To determine the boundary points γn, 0⩽n⩽Ntm+1, the following equation is derived, showing the probability that transmission mode n is selected:

 . The expression for average BER corresponding to transmission mode n is:
The algorithm in figure 4.23 below was developed by Su and Zhang to find thresholds { γn }, such that the predetermined average BER corresponding to transmission mode n can be achieved for each transmission mode, i.e.
 .
.The second part of analytical power model is the queuing model. The purpose of its development was to analyse the performance of the proposed TDMA schemes in terms of five performance metrics:
- Idle probability of time slots
- Packet drop rate
- Throughput
- Head-of-line (HOL) delay index
- Average packet delay
TDMA frame periods of same length are indexed by (t=0,1,2…).
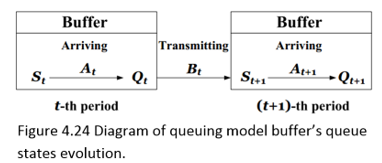
The evolution of the queuing model buffer’s queue states can be characterized by the buffer’s queue length at the beginning of t-th frame period with 0⩽Qt⩽K, as seen in Figure 4.24. The stochastic process of the packet arrival {At} is stationary and independent of the queue states and the channel states. The expectation of the number of packets arrived depends on the frame period length and the packet arrival rate per node and can be expressed as E(At)=λT. In a scenario whereby the packets arrival is a Poisson process with packet arrival rate of λ, the probability mass function (pmf) of At is as follows:
However, in a scenario where the packet arrival is a constant process, the pmf of At is denoted as:

Considering a scenario whereby each packet has a constant payload, the transmission mode of the adaptive modulation module during the t-th frame period decides the random value of the transmitted packets. Hence, given the transmission mode n during t-th frame period, the number of transmitted packets is Bt = Rs*Rn*Ts/h+p. The sensor nodes send packets at a constant power (Su and Zhang, 2009, p. 428).Since the transmission mode depends on the received SNR, which follows Nakagami-m distribution, the pmf of the (random) number of transmitted packets during t-th frame is obtained as follows:

 where the Diract delta function
  determines whether packets will be transmitted or not on the t-th frame, based on current channel and queue states. The conditional probability that the buffer has s packets at the beginning of (t+1)-th frame period and
  packets at the end of t-th frame period depends on the number of packets transmitted during the t-th frame period is:
The queue length of buffer during the (t + 1)-th frame period is Qt+1 = max{K, St+1 + At+1} . Then, given St+1=s, the conditional pmf of Qt+1 can be expressed as follows:

For simplicity of presentation, Su and Zhang define the following probabilities:
Then, the transition probability that there are q packets in the buffer, given that the queue length is r at the previous frame period, is obtained as follows:

{Qt}can be modeled as a finite state Markov chain (FSMC). Hence, the probability of the transition matrix is constructed as P={Pqr}(K+1)*(K+1). The stationary distribution of the FSMC {Qt} exists and is unique. The stationary pmf of the number of packets in the buffer at the end of a frame period is:

The stationary pmf satisfies the following equations:
 , where πnΠ is the column vector of πn and is given by:
Π (π0, π1, … π2). After obtaining the stationary pmf of the number of packets in the buffer at the end of a frame period, we use the equation:

which we’ve seen before, to obtain the stationary pmf of the number of packets at the beginning of a frame period.
The last part of the analytical model is the performance metrics. In this part the five metrics mentioned above (packet drop rate, idle probability of time slots, average packet delay, HOL delay index and throughput) are derived and detailed.
The number of packets dropped due to buffer overflow during t-th frame period is:
Lt=max{0,At – (K -St)}. Now we can derive the pmf of Lt :
Next, we get the packet drop rate in the steady state. In this state it approaches to the ratio of the average number of dropped packets to the average number of arrival packets during a frame period:
Idle probability is calculated next. It is the probability that a timeslot is not used by the sensor node in the steady state. The higher this probability gets, the larger are the chances that the batteries can recover (Su and Zhang, 2009, p. 429.). Idle probability is equivalent to the probability that the number of packets in the buffer at the end of the current frame period is equal to that at the beginning of the next frame period. Hence, the following equation applies:

 HOL delay is next to be calculated. It is defined by Su and Zhang as the duration, in terms of frame periods, from the time when a packet arrives at the head of the packet queue in the buffer to the time when the packet leaves the buffer in the steady state. Prior to deriving the pmf of HOL delay, we first need to derive the following conditional probability in the steady state:
The probability that given Qt=n, at least one packet is transmitted during the t-th frame p eriod and there are m packets at the end of (t+1)-th frame period is:
The probability that the HOL delay index is equal to a certain value d in the steady state is equivalent to the probability that no packet is transmitted for exact d consecutive times. If
d=0 , we get:

While for d>0 , we get:

The latter equation, together with the one before it yields:
The HOL delay index represents the probability that the duration of packet’s staying in the buffer, after it arrives at the head of queue, is larger than one frame period. Or, mathematically speaking, Pr{D > 1}. The larger HOL index is, there longer is the average delay of HOL packets.
We continue with calculating the average packet delay. In the Poisson packet arrival scenario, the probability that there are n packets in the buffer’s queue at any random epoch is also the pmf of the queue length. Sine we’re dealing with Poisson process, the queue state from the arriving packet’s point of view is the same as for an outside observer (random epoch). The probability that the number of packets during the tT + τ epoch is a certain value n is same as the probability that there are n-s packets arriving during the time interval τ. Having that said, we derive:

The probability of having the number of packets during the tT + τ epoch in the steady state equal to certain n is then:

Therefore, the pmf of queue length at any random epoch can be obtained by:

 . Applying Little’s law, we obtain the average packet delay as
Throughput is last to be calculated. As the packet entering the buffer can be eventually sent to the coordinators, the throughput can be expressed as η =8(p + h)λ(1-ω), where 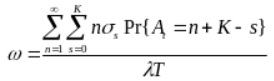 as previously found.
Performance evaluation of the Battery-Dynamics Driven TDMA MAC protocol is next to be discussed. The table in Figure 4.25 contains the measured parameter values for protocol evaluation.
Su and Zhang adopt different combinations of (θa, θb, θc) to satisfy different QoS requirements in terms of packet drop rate and average packet delay.
(θa, θb, θc) is set to (1,1, 2), (1,2,5), (3,3,15), (3,4,20), and (4,5,20) for different cases of delay QoS requirements. Larger values of (θa, θb, θc) cause poorer delay QoS performance of the proposed protocol schemes and longer battery lifespan of the sensor nodes. The values of (θa, θb, θc) chosen by the authors are (θa, θb, θc) = (1,1,2), (θa, θb, θc) = (1,2,5), (θa, θb, θc) = (3,3,5), (θa, θb, θc) = (3,4,20) and (θa, θb, θc) = (4,5,20).
The first value corresponds to the standard TDMA scheduling scheme, while the rest four values will be used later on and are referred to as Scheme-I, Scheme-II, Scheme-III, and Scheme-IV, respectively. The choice of these values was to achieve lower to higher delay QoS requirements. Su and Zhang adopt the use of a customized event-driven simulator that includes the battery discharge model to simulate the protocol in various scenarios where the packet arrival rate per node varies.
There are six transmission modes in the adaptive modulation module. The modulations for transmission modes 1 to 6 are binary phase-shift keying (BPSK), quadrature phase-shift keying (QPSK), 8-QAM, 16-QAM, 32-QAM and 64-QAM, respectively. As a result, the number of bits per symbol in transmission mode n is Rn = n where 1≤n≤6. The The algorithm in Figure 4.23 is used to determine the required SNR threshold for each transmission mode. Each scenario is simulated 500 times with different initial random seeds to obtain the mean value as the final performance metric (Su and Zhang, 2009, p. 430).
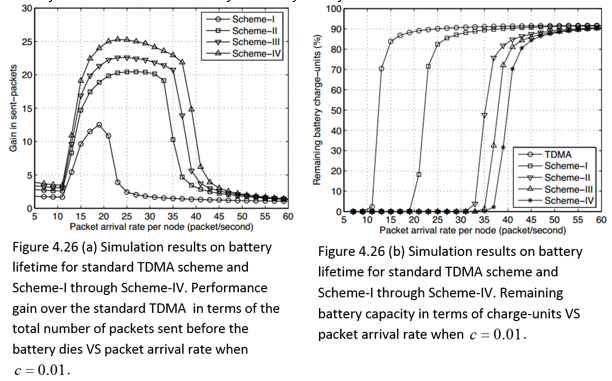
Simulation results and their analysis comes next, starging with Poisson packet arrival scenario. Figures 4.26 (a) and 4.26 (b) below show the simulation results on battery lifetime when the battery recovery ability is set to c=0.01.
Figure 4.26 (a) compares the ratio of the total number of packets sent by the protocol until the battery dies to that of the standard TDMA scheme. From the graph, it can be seen that the protocol’s schemes send more packets than the standard TDMA scheme regardless of the packet arrival rate. For instance, as Figure 4.26 (a) shows, at packet arrival rate per node of c=22.5, the total number of packets sent by Scheme-IV can be 25 times as many as that sent by the standard TDMA scheme. Figure 4.26 (b) shows the remaining battery capacity in terms of charge-units at the end of the simulation against the packet arrival rate.
It is clear that less remaining battery capacity indicates that the battery is used more thoroughly, and that many packets have been sent. The graph shows Scheme-IV having the least remaining battery capacity among the three schemes because it enables the idlest time for the battery to recover the charge-units. The remaining battery capacity is contained by Scheme-I.Figures 4.26 (a) – (d) below follow, showing both the analytical and simulation results of average packet delay, idle probability of time slots, average packet drop rate and HOL delay index, respectively. It can be seen from the charts that both analytical and simulation results agree well.
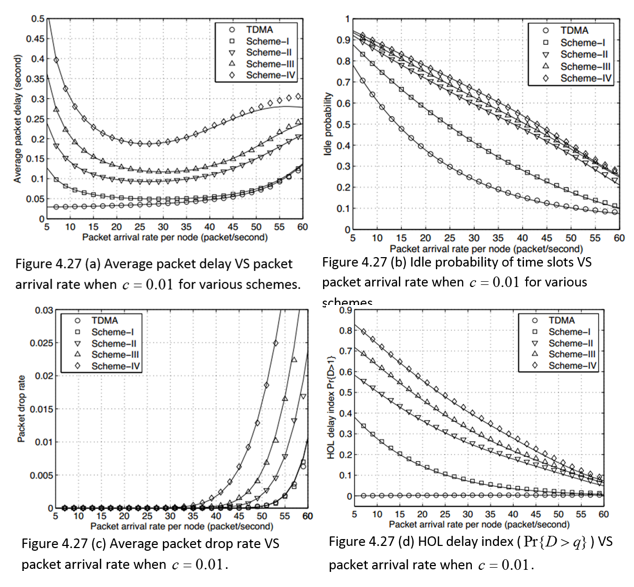
On the one hand, Figure 4.27 (a) illustrates that when the average packet delay of Schemes I-IV decreases when the packet arrival rate per node increases from 5 to 25. Yet, a constant increase of the average packet delay of Schemes I-IV can be observed as the packet arrival rate per node gets bigger. On the other hand, an increase of packet arrival rate per node causes the average packet delay of standard TDMA to increase monotonically.
This can be explained by Figure 4.27 (d), which shows that an increase in HOL delay index leads to an increased probability that the HOL packets need to take more time to wait in the buffer. Furthermore, as the packet arrival rate per node increases, it leads to a shorter waiting time for packets, and hence, the HOL delay index of Schemes I-IV simultaneously declines. However, for standard TDMA, the HOL delay index remains zero regardless of packet arrival rate per node. It is because standard TDMA scheme transmits the buffered packets whenever the transmission time slot arrives, unlike the protocol which has to wait for there to be enough packets before the process of transmitting can begin. Figure 4.27 (c) shows a sharp increase in packet drop rate for packet arrival rate per node value of 55 and above.
This is the cause of the decline of average packet delay observed in 4.27 (a) for similar values. Also, as shown in 4.27 (c) Scheme-I and standard TDMA scheme achieve very similar packet drop rates, as well as packet drop rate of almost zero for all schemes when the packet arrival rate is at 30 packets per second. Figure 4.27 (b) shows that when there is an increase in the packet arrival rate per node, the idle probability of time slots decreases for Schemes I-IV, with the highest idle probability time slot being Scheme IV at any packet arrival rate, making it the most efficient scheme of all schemes as well.
Constant arrival process scenario is next to be discussed. The above evaluation of the protocol’s performance reveals a tradeoff between battery lifespan, packet delay and packet drop rate not only in the constant packet arrival scenario, but in the Poisson packet arrival scenario as well. Hence, parameters for the protocol’s schemes require settings depending on the different QoS requirements of various applications, as noted by Su and Zhang. The constant packet arrival case study uses ECG monitoring application, which operates with the number of sensors varying from 2 to 16, while the size of each sample is set to 2(byte). The ECG delay should be less than 300(ms), (Su and Zhang, 2009, p.431).
Therefore, the sample per lead per second is set to 200 and 400, leading to a packet arrival rate per node of 10 and 20, respectively. The ECG application is then compared with IEEE 802.15.4 protocol with CAP mode and with Bluetooth with piconets mode. The parameters for CAP mode’s superframe structure are: macBeaconOrder = 2, macSuperframeOrder = 2, operation band = 2.4(GHz), data rate = 250 (Kbps), while for Bluetooth mode a master-slave architecture based on TDMA was used, with a maximum of 7 sensor nodes.
Figures 4.28 (a) and (b) shows the comparison of the performance of Scheme-I, Scheme-IV, and IEEE 802.15.4 where the number of sensor nodes change from 2 to 16. The results of Figure 4.28 (a) concern packet arrival rate of 10 per node. From the graph, it is clear that Scheme-I and Scheme-IV of the protocol are applicable for ECG requirements, as their average packet delay is less or equal than 300 (ms). However, at packet arrival rate of 20 per node, the average packet delay of IEEE 802.15.4 approaches the critical value of 300 (ms) for 16 nodes and keeps growing for larger number of nodes, which is unsuitable for the ECG application.
In Figure 4.28 (b), the number of packets sent before the battery dies is compared to the proposed protocol and to IEEE 802.15.4. It can be seen that when the number of sensor nodes is 16 and the packet arrival rate per node is 10, the number of packets sent by Scheme-IV is 26 times as many as that sent by IEEE802.15.4. Su and Zhang explain the cause of this situation to be the fact that under IEEE802.15.4 excess energy is consumed during channel detection and packet collisions, which are avoided in the TDMA protocol.
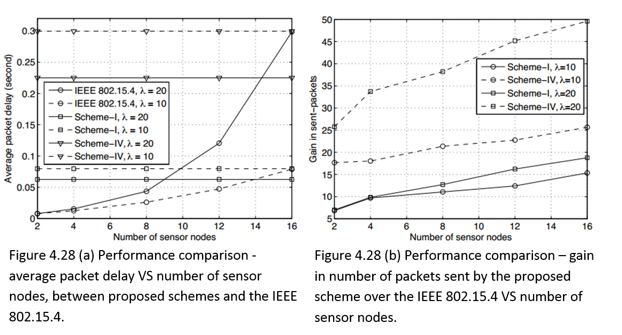
Figures 4.29 (a) and (b)demonstrate the performance comparison between Bluetooth and the proposed schemes for packet arrival rate of 20 packets per second. As the number of sensors grows, the average packet delay remains constant for the proposed protocol, while that of the Bluetooth increases, as seen on Figure 4.29 (a). The reason is an increase in the frame period. Furthermore, Figure 4.29 (b) shows that for two sensors the number of packets sent by the proposed protocol during the battery lifetime is 34 times as many as that sent by Bluetooth. This is due to the energy consumed by the sensor nodes in Bluetooth, as they remain active during each frame period, leaving little time for recovery.
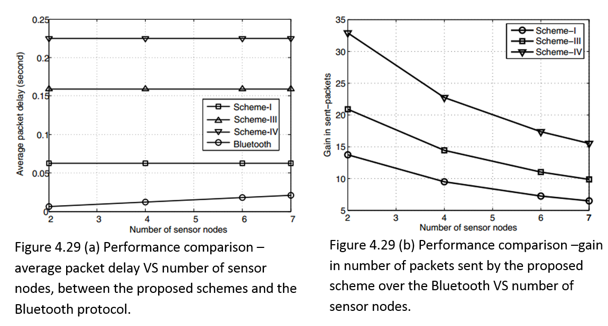
In conclusion, the proposed MAC protocol was developed after analysis of the cross-layer based battery-aware TDMA protocol for WBAN. The proposed schemes take several factors into account, such as battery recovery dynamics and time varying wireless channels at PHY layer and queuing management at data link layer. The performance of the proposed protocol was studied via Markov chain based analytical model, while simulations were conducted to validate it. The ECG study and other results show that the proposed schemes increase the lifespan of the battery and satisfies the delay QoS requirements of WBANs.
Discussion and Conclusion
A survey carried out by An, Gopalan and Park reveals that the current existing MAC protocols are unable to meet the energy efficiency requirements. This chapter provides a detailed observation of four surveys considering four alternative low power MAC layer protocols for WBANs, focusing on energy saving features and comparing performance.
First one is the power efficient protocol presented by Ullah, An and Kwak, based on Traffic Based Wakeup Mechanism and Bridging Function. It exploits the BNs traffic patterns to accommodate the entire traffic classification and integrates all the BNs working on different PHYs into a complete BSN. The proposed wakeup mechanism backed by the Bridging Function provides a complete solution towards power-efficient and reliable communication in a BSN. The protocol presents a complete solution for WBANs because, by taking into account the heterogenous traffic in WBANs, the protocol achieves the delay QoS requirements of WBANs enabling safe and reliable communication.
The importance of safe and reliable communication is crucial especially in medical applications as they monitor vital body functions including heart disease. While most existing MAC protocols such as WiseMAC and TMAC do not handle WBAN traffic requirements efficiently, the IEEE 802.15.4, through the concept of GTS, enables the BSN to handle emergncy traffic which occurs during time critical events such as excessive blood pressure.
However, the Guaranteed Time Slots can not handle low traffic. That is where the traffic based wakeup mechanism outperforms the protocol since it handles all types of traffic by classifying and arranging into; normal, on-demand, and emergency traffic. Furthermore, since a BSN can have various nodes working on different frequency bands or PHY layers, it may be necessary to connect the various nodes into a BSN. However, a difficulty arises since power limitations and high path loss in a BSN prevent the possibility of direct communication between in-body BNs and on-body BNs. The protocol takes this problem into account and proposes to solve it by introducing the bridging function which relays information from the in-body BNs to the on-body BNs thereby virtually connecting all BNs into a BSN.
The second protocol In energy efficient medium access protocol presented by Omeni et al. This protocol succesfully exploits centrally assigned wake-up/sleep time to achieve significant energy reductions. However, as Omeni et al. found out, different computation details on the power and duty cycle analysis have been reported for applications of heteroenous types. In applications like blood glucose monitoring and temperature monitoring more payload data minimizes the overhead time immensly, while in applications such as ECG streaming the duty cycle is fixed and the sleeptime is limited by the systems memory. Since the measured power of the proposed protocol depends on sleeptime and number of retransmissions, it cannot be used as a generic WBAN potocol.
The third protocol is one presented by Marinkovic et al. It is based on transceivers that exploit the constant network structure and fixed sensor functions to implement the TDMA strategy. By implementing the above strategy, the protocol is able to minimize idle listening and communication overhead. Minimizing the duty cycle was the main concern of the authors, as they considered it the main parameter of energy consumption. When compared to several other low duty cycle and low power consumption protocols under similar operating conditions, sampling rate and RF communication data rate, the results received by Marinkovic et al. show that their protocol outperforms its opponents.
The last protocol observed by this chapter is the battery-dynamic driven TDMA protocol presented by Su and Zhang. By taking into account the joint effect of electrochemical properties of the battery, time-varying wireless fading channels and packet queuing characteristics, the protocol enables the prolonging of battery lifespan of the wireless sensor nodes while guaranteeing reliable and timely message delivery, which is crucial for WBANs.
The protocol contains three main system models: basic framework, battery discharge dynamics and wireless channel model. The basic framework model is based on TDMA scheduling with communication between the sensor nodes and the coordinator occurring at a constant power; the battery discharge dynamics model is based on the battery’s recovery capacity effect during idle time slot while the wireless channel model which takes into account the channel fading characteristics.
The survey of An, Gopalan and Park compares the energy efficient MAC protocol presented by Omeni et al. to the low duty cycle MAC protocol presented by Marinkovic et al. The major features that enable the reduction of energy consumption in the protocol ny Omeni et al., as noted in the survey, are: central control of time slot allocation and the concept of WFT, which is introduced to manage time slot collisions by ensuring that every slave node has a guaranteed time slot even in the event that another slave node fails to complete communication with the master node within the assigned time slot.
For the protocol by Marinkovic et al., the major energy reduction feature noted in the survey is the implementation of an effective TDMA strategy to handle time slot collisions. Hence, while both protocols reduce energy consumption by handling collision in the form of managing time slot collision, the TDMA strategy of the protocol by Marinkovic et al. with guard time slot allocation proves to be more efficient as performance evaluations reveal. The results showed that at the same sampling rate Marinkovic et al. protocol has lower duty cycle, i.e. energy consumption, than the protocol by Omeni et al. Nevertheless, while the protocol by Marinkovic et al. is good for sending short bursts of data, the protocol by Omeni et al. is more suitable for applications with fluctuating data such as ECG or blood glucose monitoring.
To determine which of the four protocols is the most suitable for WBANs, a discussion of the protocol’s main features and performance is required. So far, we have established that the Mariknovic et al. protocol outperforms the protocol by Omeni et al.. Next, we compare the Mariknovic et al. protocol, which employs the TDMA strategy with the battery-dynamics driven TDMA protocol by Su and Zhang.
The energy reducing features of the Mariknovic et al. protocol have been presented above. For the battery-dynamics driven TDMA protocol, the main energy reducing feature is the cross-layer design employed in the protocol, which takes into account three main variables: battery recovery dynamics, time varying wireless channels at the physical layer, and queuing management at the data link layer. The protocol therefore increases the battery lifespan while satisfying the delay QoS requirements for WBANs. Although an analytical comparison analysis of the Marinkovic et al. protocol and battery-dynamics protocol is not available, according to the results of performance comparison conducted by Su and Zhang seen in figures 4.28 (a) and (b), the battery-dynamics protocol outperforms the IEEE 802.15.4.
The graphs show that an increase in the number of sensor nodes leads to an increase in the average packet delay for IEEE 802.15.4, affecting delay QoS requirements for WBANs, while for the battery-dynamics protocol the average packet delay remains constant regardless of the increased sensor nodes. Hence, given that the Mariknovic et al. protocol, like IEEE 802.15.4 would have increased average packet delay with an increase in the number of sensor nodes, this essay speculates that the protocol by Su and Zhang would outperform the Mariknovic et al. protocol in terms of WBANs QoS delay requirements.
Despite the benefits descried above, the battery-dynamics protocol by Su and Zhang has several drawbacks. The protocol’s average packet delay and average packet drop rate could be high in cases where data streaming causes packets to be held in the buffer for too long, thereby presenting a trade-off between battery lifespan and packet delay which is unsuitable for WBANs. (Su and Zhang, P. 4, 2009).
Given the observations made above about the four low power protocols discussed in the essay, this essay proposes the traffic based wakeup mechanism as the most suitable protocol for WBANs. The main energy reducing feature of the protocol is its ability to accommodate traffic requirements of all-type WBANs through the use of the Traffic Base Wakeup table, which classifies the whole BSN traffic and coordinates network communication. Furthermore, the bridging function of the protocol enables nodes working on different physical layers to communicate, thereby transforming the sensor nodes network into a complete BSN, making it the most generic as well as most appropriate one of the four protocols.
Conclusion
In this paper, we have analyzed multiple studies on fundamental mechanisms of WBANs. In each of the previous four chapters, a discussion of the relevant articles was performed, and independent conclusions were achieved. This chapter summarizes the elaborations and findings that were presented and reviewed. It discusses current perspectives of energy consumption in WBANs. Finally, it discusses the potential future development of energy consumption techniques.
The first chapter was based on the studies of Ullah et al. and Latre et al. Its purpose was to introduce the reader to WBANs and to identify their most crucial issue: efficient energy consumption. The identification of this factor motivated the purpose of the study carried out in this essay, which is the analysis of energy consumption in WBANs. The essay analyzed energy consumption of WBANs in three vital aspects, each of which was assigned a solitary chapter.
Firstly, we looked into a study carried out by Cheng and Huang on power models in WBANS. The review of this study appears in the second chapter of this essay and focuses on Beacon-mode and CSMA/CA mode access schemes. Next, in the third chapter of this essay, we examined a study carried out by (Yan, Zhong and Jha, 2007), which focuses on an energy-efficient computing model for low-duty cycle peripherals called wireless device driver.
Finally, we analyzed various power saving MAC layer protocols. This analysis, coerced in the fourth chapter of the essay, introduces four different protocols of different techniques. It considers various aspects of their design and implementation, such as electrochemical battery properties, time-varying wireless fading channels, and packet queuing characteristics, different types of data, communication reliability, and throughput (Su and Zhang, 2009, p. 424).
As said, in chapter two we discuss and analyze Cheng and Huang’s study on power model for WBAN. The authors identify five main sources of power consumption in a WBAN, which are overhearing, idle listening, collision, control message, and packet forwarding (Cheng and Huang, 2008, p. 2). The study analyzes the power consumption and capacity limits of both beacon-based and channel detection based access schemes and reveals that none of them can effectively support (in terms of WSN nodes) both the low power consumption and high capacity simultaneously.
The authors propose a hybrid access mode with the ability to provide high capacity while maintaining low power consumption. The beacon-mode and channel detection are applied to solve IANC and IRNC collisions, respectively. Although hybrid-mode costs more power than CSMA/CA, due to adoption of both beacon and channel detection, hybrid-mode is still a better access method than CSMA/CA when the required user capacity is high (Cheng and Huang, 2008, p. 4). This essay concludes that the Hybrid mode should adopt CCA/TDMA since it consumes even less power than CSMA/CA and still is a better access method. This is better conveyed when we compare the Hybrid model to the latter power modes.
Alternative studies carried out by different authors have analyzed beacon modes and CSMA/CA via applications and simulations in comparison to other modes, and the results concluded that, although these power models are energy efficient, they are unable to satisfy the required power efficient, budget requirements of a WBAN. This essay considers a study carried out by Marinkovic et al., in which the authors analyzed and found that TDMA-based protocols outperform CSMA-based protocols in all areas, except for adaptability to changes in network topology (Marinkovic et al., 2009, p. 916).
However, in the survey by An, Gopalan and Park the authors analyzed this problem and proposed the application of an appropriate guard to compensate for the clock drift for low data rates. In Omeni et al. Study, the authors analyze Clear Channel Assessment and Collision Avoidance with Time Division Multiplexing (CCA/TDMA) as the network access. The authors found that this network access scheme significantly reduces the likelihood of collision and idle listening, leading to substantial power savings (Omeni et al., 2009, p. 252).
To better illustrate why CCA/TDMA is better, we point out the fact that; when choosing the Hybrid access mode, Cheng and Huang not only consider the most power efficient mode in their study, but also the most effective. In this case, although the CSMA/CA power mode has a better power efficiency than their hybrid access mode, due to it’s adoption of both beacon and channel detection, still they prefer their hybrid access mode due to it’s better access method during high user capacity.. Although this criterion seems like a minor cause for substitution of the CSMA/CA, that the access methods of a WBAN power mode remains effective during both low and high user capacity due to the volatile nature of traffic in the WBANs.
Challenges similar to those identified by Cheng and Huang in CSMA/CA, such as poor access, especially when user capacity is high, were also identified by Ullah et al. In a different study, they found that, although CSMA/CA was the best example of the contention-based mechanism, where nodes contend for the channel to transmit data regardless of any predefined schedule, in most cases they still needed to use a hybrid approach to access the channel. The hybrid approach involved a combination of contention and scheduling mechanisms, known as, scheduled-contention mechanism. This mechanism synergizes both scheduled and contention based schemes and utilizes this to achieve collision avoidance (Ullah et al., 2010, p.11).
As a result, Ullah et al. compared CSMA/CA to TDMA power mode in search of a more power efficient mode. The survey found that the CSMA/CA protocol suffers from heavy collisions when the user capacity is high, resulting in extra energy consumption. Besides, it must perform CCA before transmitting. The fact that TDMA protocol eliminates the problem of heavy collision, CCA problems, reducing duty cycle, contention, idle listening and overhearing problems makes it more power efficient than the CSMA/CA.
Every node is dedicated to at least one slot to facilitate it’s completion of the transmission, while multiple slots can be assigned depending on the data volume. According to Ullah et al., this mechanism design makes TDMA an excellent protocol for WBANs, because it allows the allocation of time slots to the nodes in accordance with their traffic requirements. However, although it performs well in terms of power consumption, it still wastes some power due to frequent synchronization.
This study shows that the TDMA protocol is not only more power efficient than the CSMA/CA, but since it allows access at high capacity, it is far more feasible than the Hybrid model by Cheng and Huang. However, an alternative study by Marinkovic proposed that one of the most viable future options of achieving energy efficiency in WBANs could be adopting CSMA solutions for network forming and TDMA protocols for data transfers (Marinkovic et al., 2009, p. 294).
The network access CCA and CCA/TDMA, proposed in a study by Omeni et al., Solves all the aforementioned problems related to the TDMA protocols. This network access scheme significantly reduces collision and idle listening, leading to significant power savings. In addition, the time-slot allocation is dynamically managed by the master. The latter facilitates the slave time slot the capacity to be changed every time it communicates with the master, allowing the system to cope with the WBAN fluctuating traffic. The only problem that arises from using this mode is complexity of the central node due to the large number of slaves connected to ease management.
This network architecture is intended to move much of the network and protocol complexity away from the power constrained wireless sensor nodes. Although the complexity is saturated at the central node, this is not a serious problem, since the central node is expected to have significantly more power and processing resources (Omeni et al., 2008, p. 252). For this reason, this essay concludes that the CCA/TDMA is the most viable option out of the Hybrid mode access scheme and the CSMA/CA.
As previously mentioned, in the third chapter we discuss and analyze a paper by Yan, Zhong and Jha’s on energy-efficient computing model known as wireless device driver. The study discusses design issues of higher level communication protocols based on Bluetooth and ZigBee. Over these two technologies, the study further compares and analyzes cost, performance and impact of both tunable parameters and dynamic resource management of the wireless device driver on connection latency and energy efficiency.
Yan, Zhong and Jha, propose energy efficient policies that have the capacity to exploit the consecutive connection intervals to achieve energy efficiency. The application of the policies includes; an adaptive connection latency management technique that adjusts various tunable parameters dynamically to achieve minimum connection latency without affecting the energy consumption level. Based on the results achieved by the authors, this essay can conclude that these techniques achieve a high rate of power efficiency while meeting connection latency requirements.
All measurements and observations of the reviewed study were based transceivers: Promi-ESD Bluetooth module and MICAz ZigBee module. Nevertheless, according to the authors, these two implementations represent the state-of-the-art for both WBAN technologies; hence it is correct to conclude that the power comparisons measurements obtained from the concrete two implementations of the study are precise enough to be considered as generic (Yan, Zhong and Jha, 2010, p. 8).
Bluetooth technology is more popular in commercial products such as mobile phones due to higher bandwidth and better availability, which are substantial advantages in this field. Although ZigBee is designed to be more energy efficient than Bluetooth, it is only more efficient where small data packets are concerned, e.g. For WSN applications. Where the authors tuned the parameters to the similar settings in values, Bluetooth transceiver was more power efficient during an active session, at the expense of higher connection latency.
The computer-to-device model proposed in the study is opposed to the computer-to-computer model. The computer-to-computer model has its peripherals and sensors and nodes controlled by an OS. This makes it capable of multitasking if required, yet at the expense of increased design cost and energy consumption. As opposed to the computer-to-computer model, the computer-to-device model is interrupt driven and does not require the control of an OS to operate. As a result, it benefits from relatively low hardware requirements and rather basic design. It is unable to handle multitasking; however, the latter is not required for WBANs with low duty-cycle peripherals and sensors.
The model proposed by Yan, Zhong and Jha analyses Bluetooth and ZigBee based WBAN’s design issues in terms of communication protocols standards. Various tunable parameters of the wireless device driver can be dynamically adjusted by unique communication commands, implemented in its policy. The adaptive connection latency management technique minimizes connection latency in cases where the power consumption is known, while the power-down policy reduces the energy consumption even more. As illustrated by the authors, the adjustments of parameters proved to have a significant effect on power efficiency and connection latency in both Bluetooth and ZigBee.
The fourth chapter discusses and analyzes four MAC layer protocols, each presenting its own techniques decrease energy consumption in order to make WBANs more efficient. The first protocols introduced in Ullah, An and Kwak study. The authors’ study is oriented towards beacon-enabled ZigBee, PB-TDMA, and S-MAC controlled in-body and on-body sensors. The proposed protocol uses; traffic-based wake-up mechanism for WBANs, and achieves power efficient and reliable communication via exploiting the traffic patterns, of the BNs to accommodate its entire BSN traffic. The logical connection between different BNs is enabled through working on a different frequency bands by a method called the Bridging Function. The latter integrates all the BNs working on a different frequency bands into one complete BSN (Ullah, An and Kwak p. 1, 2008).
Before the essay draws a conclusion on this protocol, we consider an alternative study carried out by Ullah et al. In their survey, the authors compare the traffic based wake-up mechanism protocol to a low power Wise MAC protocol in order to determine which of the two is more power efficient. In order to achieve this objective, the authors simulate the protocols via Monte Carlo method. In the simulation, Poisson and deterministic traffic generators and Gaussian distribution were used to create the normal environment of WBANs. The Poisson and deterministic traffic generators generated the entire BSN traffic classified into emergency, on-demand and normal.
The Gaussian distribution was applied for the deterministic traffic with the aim of imposing randomness in the relative offsets of the nodes. The average power consumption and delay were conveyed as a function of the packet and beacon inter-arrival time. A priority concept was applied for resources allocation incases where more than one node appeared to contain similar traffic patterns (Ullah et al., 2010, p. 15). Both the traffic based wake-up mechanism and the low power Wise Mac protocol were simulated under these standards and methods, while their performance was compared.
Figures 5.1 (a) and (b) below represent the difference in performance of both the traffic wake up mechanism and the low power Wise Mac protocol (Ullah et al., 2010, p. 15).
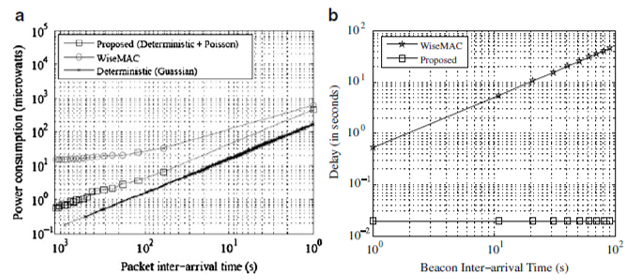
The data presented in figure 5.1 (a) shows that the traffic wake up mechanism, achieves more efficient average power consumption than the low power Wise Mac protocol. This is because in the Wise Mac protocol; when a node wakes-up to send or receive, it has to be sampled which consumes extra power. In the traffic wake up mechanism, when the node wakes up, it sends or receives immediately. Since this protocol excludes preamble sampling, no extra power is consumed; thus the protocol suggested by Ullah, An andKwak uses less power than the Wise Mac protocol. Moreover, the traffic wake-up mechanism outperforms the Wise Mac protocol in all conditions. However, when the Poisson traffic was introduced, it had an effect on the protocol’s average energy consumption, as presented by the slight curve on the chart. We can still say that in the absence of emergency and on demand events in normal traffic, the traffic wake up mechanism protocol maintains steady low power consumption (Ullah et al., 2010, p. 15).
The data presented in figure: 5.1 (b) shows; that the traffic wake up mechanism outperforms the Wise Mac protocol in average delay, as well. This is a result of the preamble sampling property of the Wise Mac protocol. The delay in the Wise Mac occurs because if a node has a packet to send/receive, it waits until the medium is sampled. In some cases, the medium might be busy, which in turn will increase the sampling period, therefore, increasing the delay of the Wise-Mac protocol. In the traffic wake-up mechanism, a node wakes-up whenever it has a packet to send/receive. Since the traffic patterns are pre-defined, it does not have to wait for resource allocation information/beacon, resulting in a much more reasonable delay (Ullah et al., 2010, p. 15).
This essay concludes that the traffic based wake-up mechanism is a viable technique to achieve power efficiency in WBANs, based on the analysis of Ullah, An and Kwak study and Ullah et al. Survey. The second protocol is proposed by Omeni et al in their study. The authors partake into implementing master-slave architecture into WBANs. Such network topology often matches the centralized computing model described in chapter three.
The nodes in this network are not deployed in an ad-hoc fashion but rather join the network in a centrally controllable way (single-hop). Since the sensor nodes stay asleep until the centrally assigned time slot arrives, no collision of a node within a cluster can occur. As to collision within nearby transmitters, a CCA algorithm based on standard listen before transmit is used. Time-slot overlaps are managed by WFT. This technique has significant energy reductions when compared to more general purpose network MAC protocols such as Bluetooth or ZigBee (Omeni et al, p.1 2008).
Another main achievement in this protocol is its low RF power requirement. This makes it applicable for WBANs where the nodes are powered by much smaller batteries like flexible-thin or zinc-air, which are not possible to be used with other protocols. Moreover, the study revealed that, if the protocol can be allocated to a specific application, a much lower power requirement can be achieved. Since the protocol’s low power requirements make it capable of using mini batteries, the essay concludes that it’s the most viable protocol, especially for WBANs consisting of in-body and on-body sensors where power challenges are restricted by physical battery size and capacity. With a low power protocol, the mini batteries can be used while maintaining a reasonable lifetime of the sensor nodes, which can be a considerable boost to WBANs.
The third protocol proposed by Marinkovic et al, Is best for devices measuring physiological signals such as EEG and ECG over fixed topology WBANs. The protocol capitalizes in its ability to, utilize the body static nature in the area network, to implement an effective TDMA strategy that performs with minimum overhead, and idle listening. The technique reveals and overcomes TDMA synchronization problems. Power consumption and battery life are estimated by duty cycle calculations and validated through measurements (Marinkovic et al, 2009, p. 915). The study results show that the protocol is energy efficient for both streaming communication and short transmissions of data bursts, and can thus be used for different types of physiological signals with different sample rates.
The essay considered an alternative study on the protocol by Marinkovic et al., Carried out by An, Gopalan and Park. The authors confirmed that the protocol overcomes the collisions by introducing an efficient TDMA strategy. The strategy maintains collisions on the lowest level possible, hence maintaining low power consumption. Since the protocol allows near real time monitoring of patient and reliable data transfers, it qualifies as a suitable protocol for EEG monitoring scenarios. An, Gopalan and Park, compared the protocol to another energy efficient MAC protocol presented by Okundu et al.
To identify which of the two is more power efficient for WBANs. The protocol by Okundu et al., Applies single-hop communication, in order to minimize power consumption by centrally controlled wake-up/sleep time. In this protocol, the central nodes are masters, while the rest of the nodes are slaves. The role of the slave nodes is to acquire data and report to the master nodes for processing. These operations are carried out in the following order: The master node establishes a link with the slave node by listening to RF channel for a fixed time for response, followed by sending out a beacon. After link establishment, the master requests it’s slave’s information by setting the next wake up time-slot. An optional synchronization is used to mitigate time-slot drift between master and slave (An, Gopalan and Park, 2010, p. 741).
The protocol applies WFT. If a slave wakes up and fails to communicate with the master, it goes back to sleep with a sleep time set by the WFT. In the presence of link failures; the concept facilitates to mitigate time-slot collision and let’s every sensor slave node maintain a guaranteed time slot, even if the slave node fails to communicate with the master or vice-versa. The authors found that, the protocol by Okundu et al. exploits the centrally assigned wake-up/sleep time to achieve significant energy reductions compared to network MAC protocols such as IEEE 802.11, Bluetooth and ZigBee.
Furthermore, the protocol’s RF power requirement is significantly lower. Finally, since the timeslot allocation is controlled by the master, a slave time slot can be changed every time it communicates with the master, making it possible for the system to cope with fluctuating traffic (An, Gopalan and Park, 2010, p. 741).
As said, the study by An, Gopalan and Park compares the Energy-Efficient Low Duty Cycle MAC Protocol by Marinkivic et al. to the energy efficient MAC protocol by Okundu et al. The comparison is based on the duty cycle for the sampling of data rate. This rate was chosen because for functions like blood glucose monitoring and body temperature sensing more payload data significantly reduces the overhead time. However, this is not the case with functions like ECG streaming, where the duty cycle is fixed and the sleep time is limited by the system memory resources available for storing sensor data. It can be concluded that the measured power for a body sensing application depends on sleep time as well as the number of retransmissions.
Also, as sleep time increases, the duty cycle decreases after several retransmissions. Hence, average power consumption is dependent on duty cycle value (An, Gopalan and Park, 2010, p. 741). According to the authors, the results of the comparison show that the Energy-Efficient Low Duty Cycle MAC Protocol by Marinkovic et al. outperforms the energy efficient MAC protocol by Okundu et al. As a result, the essay concludes that the protocol by Marinkovic et al. is the most viable protocol for WBANs with; EEG and ECG monitoring scenarios.
The fourth and last protocol discussed in the fourth chapter was the one proposed by Su and Zhang. It is a cross-layer based battery-aware TDMAMAC protocol for WBANs. The protocol adopts the joint effect of:
- Electrochemical properties of the battery
- Time-varying wireless fading channels
- Packet queuing characteristics
The authors found that these factors were not only significantly effective in expanding the battery lifespan of the wireless sensor nodes, but also managed to guarantee the reliable and timely message delivery at the same time. Moreover, the results achieved by the authors conveyed that the proposed schemes possess the ability to increase the life of the battery of sensor nodes and still satisfy the reliability and delay-bound QoS requirements for wireless body-area monitoring networks (Su and Zhang, 2009, p. 424).
An alternative study by Ullah et al confirms, Su and Zhang protocol’s ability to recover the battery’s capacity and prolong the sensor nodes life span. However, the authors identified several drawbacks that a raised in the protocols functionality:
- The average delay and the packet drop rate are high since, in some cases, , the nodes hold the packets in their buffers for a long time.
- The protocol lacks a reliable mechanism for life-critical sporadic or emergency events.
- Although the protocol can be easily improved to achieve reliable communication in the MICS band, the current version of the protocol is not suitable for implants.
- The protocol considers Nakagami distribution, which does not accurately represent the complexity of real-time WBAN applications (Ullah et al., 2010, p.14).
After an analysis of the two studies on the protocol, this essay concludes that, although the protocol achieves energy efficiency, its drawbacks would limit WBANs other functionalities such as compatibility capabilities, which are crucial. Therefore, further research to achieve reliable solutions to the drawbacks should be carried out before, the protocol can be proposed as a viable option in achieving power efficiency in WBANs.
In this essay, every study we have analyzed was based on the required energy efficiency and reliability. Most of the analyzed mechanisms have achieved significant energy reduction. However, most studies failed to consider the adversity of WBANs application requirements. This means that most of the WBAN mechanism might require improvements to meet the set requirements for WBAN applications. A standard MAC for WBANs is yet to be established criteria for this consideration is a unified hybrid MAC that satisfies WBAN requirements while guaranteeing QOS, multiple PHY’s support and adaptability to traffic variations.
Some protocols have achieved exceptionally high power efficiency, but other aspects such as QOS have been compromised. Although the research on WBANs MAC protocol is still in its developing period, the essay found that there are few efficient MAC layer protocols devised for WBANs, since none of the protocols has achieved a standard implementation status. All the protocols that the essay considered potentially viable to achieve power efficiency in WBANs had their performances rated on applications in WBANs. For example, the Energy-Efficient Low Duty Cycle MAC Protocol by Marinkovic et al is the most viable protocol for WBANs with EEG applications.
In order to devise a standard protocol for WBANs, a lot of open research issues are to be resolved. Based on the analysis of various protocols, this essay concludes that synergizing different protocols and making improvements to the existing protocols is the key to achieving a standard protocol for WBANs. Also, this essay reinforces the suggestions of different authors in various studies, claiming that TDMA based protocol is the key to achieving power efficient solutions for WBANs. This is based on the fact that in our analysis TDMA, based protocols have outperformed alternative protocols presented. We hope that the study reviews carried out in this paper will inspire researchers to facilitate novel and efficient MAC protocols for wireless body area networks.
References
BenoıitLatre, B. B. (2010). A survey on wireless body area networks. Kluwer Academic Publishers HinghamWireless Networks Journal, 1-30.
Huang, S. C. (2008). Power Model for Wireless Body Area Network. IEEE BioCAS 2008 Biomedical Circuits and Systems Conference, 1-4.
Le Yan, L. Z. (2007). Energy Comparison and Optimization of Wireless Body-Area Network Technologies. In BodyNets ’07 Proceedings of the ICST 2nd international conference on Body area networks, 1-8.
Okundu Omeni, M. I. (2008). Energy Efficient Medium Access Protocol forWireless Medical Body Area Sensor Networks. IEEE TRANSACTIONS ON BIOMEDICAL CIRCUITS AND SYSTEMS, 1-9.
OkunduOmeni, A. C. (2008). Energy Efficient Medium Access Protocol for Wireless Medical Body Area Sensor Networks. IEEE Transactions on Biomedical Circuits and Systems, 251-259.
Park, S. a.-T. (2010). Energy-Efficient MAC Protocols for Wireless Body Area Networks: Survey. IEEE International Congress on Ultra Modern Telecommunications and Control Systems, 739-745.
Sana Ullah, H. H. (2010). A Comprehensive Survey of Wireless Body Area Networks. Springer Netherlands Journal of Medical Systems, 1-30.
Sana Ullah, X. a. (2009). Towards Power Efficient MAC Protocol for In-Body and On-Body Sensor Networks. Springer KES-AMSTA, 335-345.
StevanJovicaMarinkovic, E. M. (2009). Energy-Efficient Low Duty Cycle MAC Protocol for Wireless Body Area Networks. IEEE Transactions on Information Technology in Biomedicine, 915-925.
Zhang, H. S. (2009). Battery-Dynamics Driven TDMA MAC Protocols for Wireless Body-Area Monitoring Networks in Healthcare Applications. IEEE Journal on Selected Areas in Communication, 424-434.