U.S. Energy Mix
The Historical Energy Mix
In 1950, most of the energy was produced from coal (13.3 quadrillion British energy units) and petroleum (13.3 quadrillion). Natural gas had a smaller share (6 quadrillion) and an even smaller share the hydroelectric power (3 quadrillion) (U.S. Energy Information Administration, 2022). The energy consumption was significantly lower in those times, hydroelectric plants were actively built, and almost one-third of electricity was produced by them (Fernholz, 2016). In the 1960s – 1980s, as new enterprises, industries, vehicles, and personal electronics usage developed, non-renewable sources usage grew heavily (Meier, 2020). The energy consumption rate more than doubled from 1950 to 1990, and most of this growth was due to natural gas and coal usage; to a less extent, nuclear power was used (U.S. Energy Information Administration, 2022). Hydropower was the only renewable resource used in those times and its share was decreasing during these years.
The Current Energy Mix
The U.S. current energy mix includes approximately 12% of renewable energy, mostly solar batteries (12%) and wind turbines (27%). Another 40% share is for biomass, such as biofuel, wood, and wastes, which still release carbon dioxide when burning, and 19% share is for hydroelectric, which has flaws such as water depletion and droughts (Eyer & Wichman, 2018). Since 2010, the rate of energy consumption has continued to grow: from approximately 75 quadrillion British thermal units in 2010 to almost 100 quadrillion in 2019 (U.S. Energy Information Administration, 2022). Oil (36%) and especially natural gas (32% currently) usage continue to increase. Together, they share 68% of energy production, while coal shares 11% and nuclear energy shares the last 8%. In 2023, a large rise in solar panel usage is predicted, and a clear trend of solar energy rise is seen from the mid-2010s (Fasching, 2023). Therefore, while having more than 10% of renewable sources and a clear tendency to increase their share, the current energy mix still relies heavily on non-renewable sources and poses many dangers to the environment.
Current Issues
Environmental issues are still a major challenge for the United States, similar to the world in general. As more than 80% of energy is produced by oil, gas, or coal, ecological situation is still worsening, and they will eventually hinder economic growth and life quality improvement (Saidi & Omri, 2020; Sharif et al., 2019). In addition, in states where electricity is produced from non-renewable sources, electric vehicles show no improvement in solving these issues, as the electricity produced is not clean (Yuksel et al., 2016). Meanwhile, many people still do not know about the benefits of renewable sources, and raising people’s awareness is crucial for promoting clean energy usage (Jenn et al., 2018). Therefore, the rise of energy consumption requires active implementation of clean and renewable energy sources, educating the population, and introducing of policies promoting their development.
Another U.S. problem is that some states use predominantly only one energy source, which makes people and infrastructure in them highly dependent on these sources. For example, 40 U.S. states’ energy situation is robust, meaning that they use diverse energy sources, from which 17 are only moderately robust, using one energy source for approximately 50% of their energy production (Ahmad & Derrible, 2018). Ten states are considered vulnerable: an example is Indiana, where coal share is more than 80%. Using a single non-renewable energy source leads to environmental pollution and the potential depletion of people’s well-being; it also makes the state dependent on this energy source (Khan et al., 2021). Diversifying energy sources in all states is important for improving the environmental situation and people’s well-being.
Proposed Mix
The Proposed 2050 U.S. Energy Mix
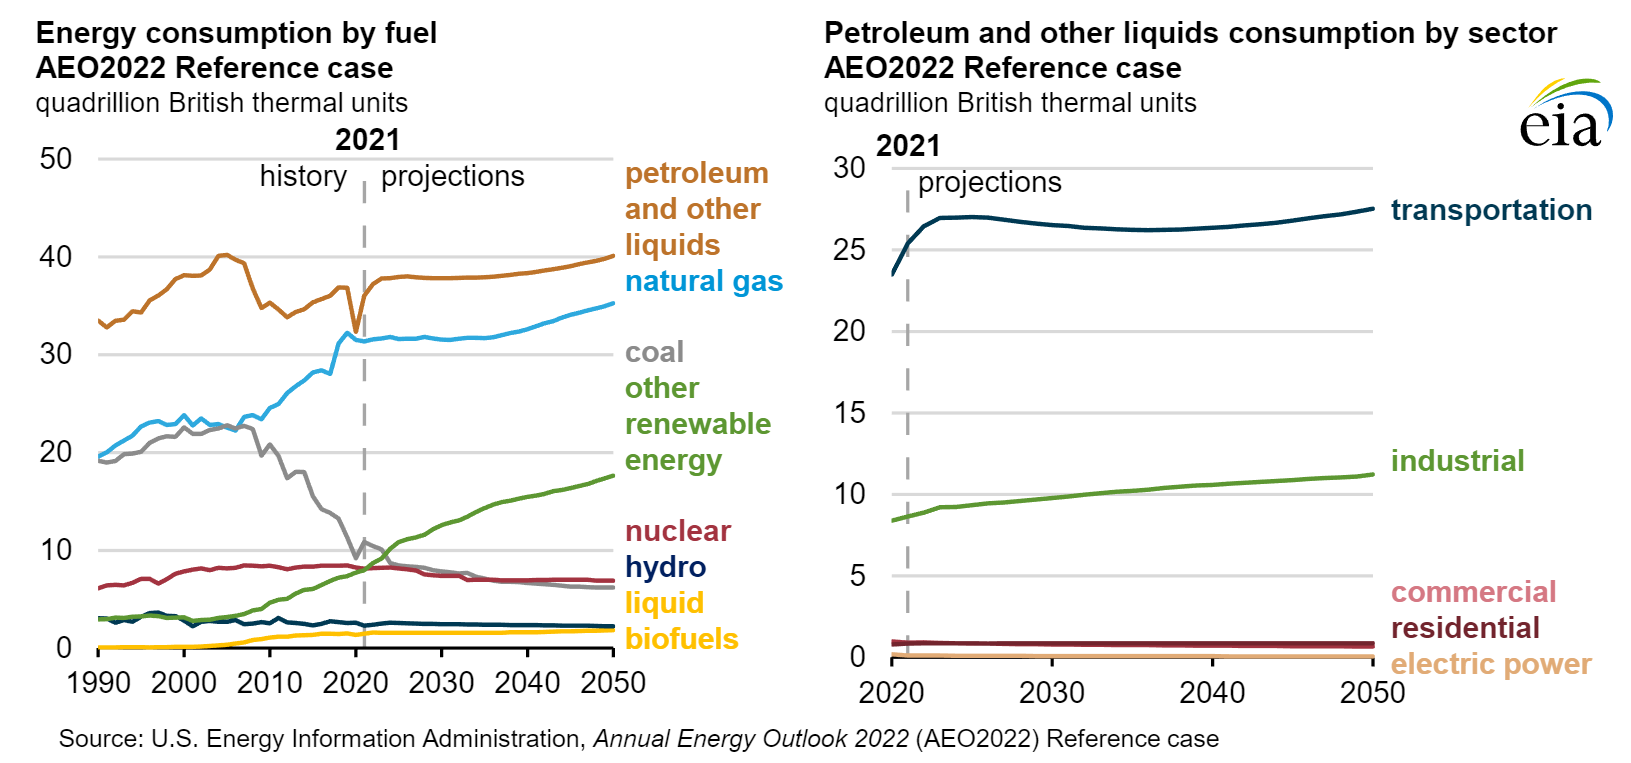
By 2050, while renewable energy will reach a much larger share than before, coal and oil will still be essential for energy production. As one can see in Figure 1, proposed by the U.S. Energy Information Administration (2023) in their regular report, rates of petroleum and natural gas will be growing slowly. In contrast, coal usage will decrease, and renewable sources will grow rapidly; other sources, such as biofuels, hydroelectric, and nuclear, will remain almost unchanged (U.S. Energy Information Administration, 2023). This proposed 2050 energy mix consists of approximately:
- 40 (40%) quadrillion British thermal units, produced from petroleum,
- 35 (35%) quadrillion from natural gas,
- 18 (15.9%) quadrillion from renewable sources,
- 7 (6.2%) quadrillion from coal and nuclear plants, and
- 3 (2.6%) quadrillion from liquid biofuels and hydro plants.
Why This Energy Mix Is Desirable and Feasible
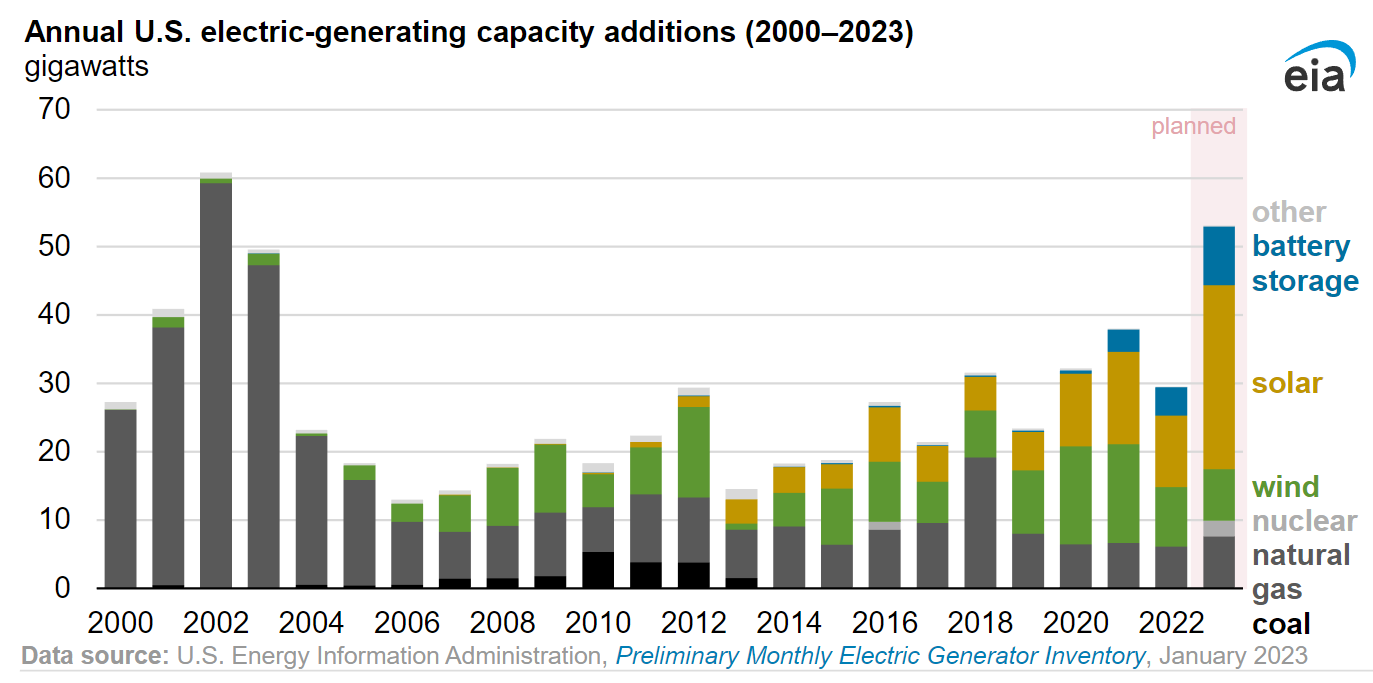
The energy production and consumption levels include electricity, transportation, industrial, commercial, and residential needs. As one can see in Figure 1, these sectors require much more petroleum and other liquid fuel than electricity production. Therefore, the rise in renewable energy sources share is predicted to be slow: only several percent. However, most of the electricity will be produced from renewable sources. Even today, the percentage of wind and solar electricity production capacity proliferates, as shown in Figure 2 (Fasching, 2023). While admitting that oil and coal will still be necessary for the country’s energy needs, this energy mix opens a feasible approach to steadily increase the clean energy share. Renewable energy sources are much better for the environment, stimulate economic growth, and are much more stable (Güney, 2019). Last, people’s decisions about which energy to use impact the environment directly. If more people choose to use power from renewable sources, because it is cheaper, easier to obtain, and they know that it would improve their life, the environment becomes cleaner, and life quality grows.
The Pathway to the Future Energy Mix
To reach this energy mix, many changes and improvements should be made on a social, political, and infrastructural level. Public awareness about the risks of non-renewable energy sources is essential to ensure that people will understand why and how renewable sources should be developed and promoted (Jenn et al., 2018). The government can issue policies that restrict corporate lobbying in promoting non-renewable sources promoting corporate social responsibility while funding renewable initiatives from people and corporations (Khan et al., 2021). Additional earnings and value creation are crucial components that motivate businesses to use, promote, and create renewable sources (Saidi & Omri, 2020; Sharif et al., 2019). Infrastructural and technological changes include improving the existing infrastructure of solar batteries, wind turbines, and other sources and creating new technical solutions and promoting them in startups (Kabir et al., 2018). Last but not least, high gas and oil price and their depletion lead to renewable source usage, too, as businesses and people have no other choice.
Research
Concepts and Resources
Concepts used here include energy mix, renewable and non-renewable energy sources, energy production and consumption rates and sectors, environmental and socioeconomic issues, and sustainable energy production.
- Non-renewable energy sources include oil and petroleum, natural gas, and coal: they are limited and will be depleted quickly in case of mass usage, as well as are dangerous for the environment, increasing the carbon footprint (Güney, 2019).
- Renewable energy sources include solar, wind, and geothermal power sources, as well as hydro plants, heat energy, and various biofuels, including wood (Sharif et al., 2019).
- Energy production and consumption include using energy sources to obtain electricity, move transport, heat a house, or produce goods (U.S. Energy Information Administration, 2022).
- Environmental issues are caused by pollution during energy production from non-renewable sources and include carbon emission, which leads to global warming, and various toxic gases and substances hazardous to nature (Sharif et al., 2019).
- Socioeconomic issues include people’s awareness of renewable energy benefits, government policies promoting them, and economic benefits from them (Khan et al., 2021).
- Sustainable energy production is an extensive usage of renewable sources and clean energy, aiming at steady economic growth, life quality improvement, and minimizing pollution (Saidi & Omri, 2020).
Informational Overview
This research used various academic, journal, statistical, and governmental resources to explore the information and make predictions. All of them are mentioned and shortly described in the list below, based on different topics: the U.S. energy mix, renewable energy development, and environmental and socioeconomic effects.
- The U.S. energy mix. Ahmad and Derrible’s (2018) article explores the energy mix in various states, revealing that some rely only on oneof non-renewable energy source. The report of the U.S. Energy Information Administration (2022) deeply explores U.S. energy production by sector, source type, and year. Lastly, the U.S. Energy Information Administration’s (2023) annual energy outlook explores how renewable energy sources can be widely used by 2050 and which factors would stimulate it, including growing gas and oil prices.
- Renewable energy sources development. Fasching’s (2023) report shows the current trend in the U.S. energy generation from renewable sources, showing that solar panel usage has increased steadily since 2010. Kabir et al. (2018) article explores technologies and infrastructure necessary for solar panel development. The book by Meier (2020) uses various energy facts from multiple countries to evaluate the benefits of renewable energy sources: solar, wind, hydroelectric, biomass, geothermal, and hydrogen. Lastly, the Yuksel et al. (2016) article explores how electric vehicles help reduce carbon footprint and shows that they can even increase it if the electricity in the area is produced from non-renewable energy sources.
- Environment effects. A Fernholz (2016) short article shows that in 1950 the share of renewable energy production was relatively high due to the vast usage of hydroelectric power plants. Along with them, Eyer and Wichman’s (2018) paper shows that hydroelectric power production is not fully sustainable, leading to water depletion, droughts, and CO2 level rise. The Khan et al. (2021) article explores the effect of renewable and non-renewable sources on environmental pollution and quality of life. Lastly, the Sharif et al. (2019) paper provide evidence for the positive impact of renewable sources use on the environment and, subsequently, on economic development.
Socioeconomic effects. The Saidi and Omri (2020) article shows that renewable energy sources’ usage decreases carbon emissions and stimulates economic growth. The paper of Jenn et al. (2018) explores the efficiency of electric vehicle (EV) initiatives and policies in the U.S., concluding that increasing people’s awareness of their benefits is crucial. Lastly, the Güney (2019) article explores the influence of renewable sources on sustainable development in general, which is calculated based on energy efficiency, environmental cleanness, and human welfare rates.
References
Ahmad, N., & Derrible, S. (2018). An information theory based robustness analysis of energy mix in US States. Energy Policy, 120, 167–174. Web.
Eyer, J., & Wichman, C. J. (2018). Does water scarcity shift the electricity generation mix toward fossil fuels? Empirical evidence from the United States. Journal of Environmental Economics and Management, 87, 224–241. Web.
Fasching, E. (2023). Wind, solar, and batteries increasingly account for more new U.S. power capacity additions. Www.eia.gov. Web.
Fernholz, T. (2016). The US relied more on electricity from renewable sources in 1950 than today. Quartz. Web.
Güney, T. (2019). Renewable energy, non-renewable energy and sustainable development. International Journal of Sustainable Development & World Ecology, 26(5), 389–397. Web.
Jenn, A., Springel, K., & Gopal, A. R. (2018). Effectiveness of electric vehicle incentives in the United States. Energy Policy, 119, 349–356. Web.
Kabir, E., Kumar, P., Kumar, S., Adelodun, A. A., & Kim, K.-H. (2018). Solar energy: Potential and future prospects. Renewable and Sustainable Energy Reviews, 82(1364-0321), 894–900. Web.
Khan, I., Hou, F., & Le, H. P. (2021). The impact of natural resources, energy consumption, and population growth on environmental quality: Fresh evidence from the United States of America. Science of the Total Environment, 754, 142222. Web.
Meier, P. (2020). The changing energy mix. Oxford University Press.
Saidi, K., & Omri, A. (2020). The impact of renewable energy on carbon emissions and economic growth in 15 major renewable energy-consuming countries. Environmental Research, 186, 109567. Web.
Sharif, A., Raza, S. A., Ozturk, I., & Afshan, S. (2019). The dynamic relationship of renewable and nonrenewable energy consumption with carbon emission: A global study with the application of heterogeneous panel estimations. Renewable Energy, 133, 685–691. Web.
U.S. Energy Information Administration. (2022, June 10). U.S. Energy Facts Explained – Consumption and Production – U.S. Energy Information Administration (EIA). Eia.gov; U.S. Energy Information Administration. Web.
U.S. Energy Information Administration. (2023). EIA – annual energy outlook 2023. Eia.gov. Web.
Yuksel, T., Tamayao, M.-A. M., Hendrickson, C., Azevedo, I. M. L., & Michalek, J. J. (2016). Effect of regional grid mix, driving patterns and climate on the comparative carbon footprint of gasoline and plug-in electric vehicles in the United States. Environmental Research Letters, 11(4), 044007. Web.