Executive Summary
The world population is growing exponentially. Due to this growth, world energy demand is also increasing. It is becoming harder to satisfy this demand. Today crude oil tops the list of energy sources. Crude oil reserves are reducing at a fast pace. Energy consumption demand is increasing and with this increase, environmental related problems are also increasing at an alarming rate. Reduction in demand for energy consumption is almost impossible. That is why governments are now finding new ways of producing electricity. There are many alternatives to crude oil. Major alternatives include coal, natural gas, hydroelectricity, solar power, and wind power.
This study looks at alternative energy sources. The research focuses on world behavior, energy consumption demand, different theories, and political will to change to alternatives. This Study uses Q-learning, the total capacity utilization model, and Kawai’s three agent model. It looks at the statistical data on crude oil consumption comparing it with alternatives. This dissertation will explain energy usage in different regions and sectors.
The study concludes that the world is changing its concept of crude oil terminology. Although Crude oil is considered the prime energy source but the need for alternatives will increase at a higher rate as compared to oil. It concludes that governments are now seriously thinking about installing alternative energy sources. It is hard to end dependence on crude oil, but the world is trying to do so.
Acknowledgments
I would like to express the deepest appreciation to my supervisor, who has the attitude and the substance of a genius: he continually and convincingly conveyed a spirit of adventure in regard and excitement regarding teaching. Without his guidance and persistent help, this dissertation would not have been possible.
My deepest gratitude goes to my family for their unflagging love and support throughout my life; this dissertation is simply impossible without them. I am indebted to my father, I cannot ask for more from my mother, as she is simply perfect. I have no suitable word that can fully describe her everlasting love to me. I remember her constant support when I encountered difficulties for her care and love. I would like to thank my brother who helped me a lot in data collection and always helps me out whenever I am facing any problem.
Last but not least my friends to their endless support and help whenever I face any problem, any hurdles, not only in my studies but in my personal life.
Introduction
Oil consumption is increasing day by day. The countries with active industries are in demand for oil more than any other country and with the growing rate of industrializing consumption has exploded. Analyzing the current situation, many nations, organizations, and companies are beginning to search for alternative sources of energy rather than continue dependence on oil. Crude oil prices have moved up in recent years. In 2000, an annual average price was US$19.25 per barrel which now exceeds the US $112 on every barrel as of today. There is an increase of 481 percent and with yearly average growth in prices from the early 1990s to 1999 of almost 3.1 percent. Most of the traders, merchants, and investors across the globe failed to predict this extreme upward trend in prices. Most of the research based on crude oil is pivoted around the macroeconomic and financial aspects of the oil expenditures. The three agent model as suggested by Kawai in 1983 estimates it as power for the limited oil prices rather than what other conventional models suggest.
1850s demand for crude oil as a fuel for electricity purposes quickly arose all around the world. The very first commercial crude oil drilling was in the year 1853 in Poland. ! 940s was the more explorative era leading to the beginning of the 1950s with the exploration in Azerbaijan, Russia, and Asia. Explorative fever was the highest in the 19th century. The major contributor to the oil in the middle of the 1900s was the United States. Later Russia and Saudi Arabia took over. 90% of the oil is in demand for the fuel that is consumed by vehicles alone. Energy consumption in the United States is geared by crude oil by a total of 40%. It is the world’s most sought after and much-needed commodity, it is used as a base by industrial chemicals. Today the countries that are in the race with the production of crude oil are United States, Saudi Arabia, and Russia. This totals a whopping 80% of oil mines within the Gulf countries alone. The other energy sources available are solar energy, wind energy, coal, natural gas, and nuclear energy. Green energy is the term applied to energy produced by solar, wind, and hydrogen as they produce limitless energy. Of the other like coal, natural gas, and nuclear energy by nature, are alternative products to the oil, but provide some concerns of exhaustibility and toxicity to the environment. Supermajor oil companies are now diversifying their energy portfolios to provide alternative sources of energy to their consumers to compete for world market share of supplying the alternative energy demand.
Fossil fuel in the shape of coal has its disadvantages. Some of them are sulfur oxide emission, carbon dioxide emission, hazardous waste material, unhealthy soil with resultant destruction of land, acid rain, etc.
Converting the sun’s powerful energy into other forms of usable energy is not something new. Capturing the light and heat from the sun and converting it to a useful form has been practiced since ancient times. With the rapid growth in the technological sector, it has become very easy to be able to convert the sun rays into electric energy by the use of solar cells. One can see rapid advancement in the technology of solar cells. The process involves photovoltaic cells (solar cells) that turn the light and heat coming from the sun into electricity. Photovoltaic cells usually mounted on rooftops are used for different electrical appliances using the sun’s rays. The only limitation and main disadvantage of using this source is its limited productivity. You can only use it when there is the sun shining in the sky. In night times or cloudy days, solar energy is not produced.
The initial setup of solar power is very costly so at the moment there aren’t many big solar stations around the world. Wind energy is another ancient source of power that has been used by sailors and farmers for many years. No wonder that wind holds the energy and this energy supercharges the blades of the wind turbines. An electric generator is used in the process of producing electricity through wind. Windmills are an excellent example of wind power. These windmills were used in water pumping and crushing of grains. With the advancement in technology, wind farms are now present on a large scale. These wind farms contribute to the national electric grids and turbines which distribute electricity to far-flung areas. This kind of power has many advantages. The main advantage is that it is environmentally friendly. Unlike fossil fuels or other renewable, it is an unlimited amount of energy, whether it’s day or night. Wind energy has one disadvantage too. Air can never have constant speed or direction, so turbines should be able to move according to the wind direction. One of the very cheap and ancient methods of producing electricity is hydroelectricity. When water passes through turbine blades hydroelectric power is produced. The power is the result of stored water in reservoirs near the damns. This stored water when released flows through the generators activating the turbines.
In ancient times waterwheels were used in rapidly flowing rivers to turn heavy loads and other equipment. The waterwheel is still the basic principle, with some variations, behind modern hydroelectric plants. In the case of wind energy, the force of the wind was used to produce electricity. Similarly, the force of the water is used to run the turbine which in turn supplies the power to a generator thus generating electricity. Hydroelectricity uses the kinetic energy of water and converts it to electric energy. To maintain the steady flow of water, dams are built. These dams control the flow of water and can store big amounts of water depending on its size. The above-described benefits cannot lower concern from an issue related to hydroelectricity production. Analysts claim that dams create problems for fish and aquatic plants on the sides of the dam.
The nutrient-rich silt could be affected because of the controlled flow of water. Another form of green energy is bio-fuels. Its usage as an energy source is not very old. Biomass (biofuel) is produced during photosynthesis. Biomass is also known as bio-matter and used as it is or as fuel produces other types of biofuels. Biomass fuel which is produced agriculturally, such as bio-diesel, ethanol can be burned in internal combustion engines or boilers. Bio-fuel contains chemical energy stored in it which is released by burning. Liquid bio-fuel natural and both renewable forms of energy which, is used in automobiles, can only be used in diesel engines. Soy and corn which are vegetable oils are used for liquid bio-fuel. It is an interesting fact that vegetable oil was the first product used for the running of diesel engines. That is why bio-fuels contain no petroleum, and they are non-toxic, eco-friendly, and renewable. Bio-fuel is environment friendly so fuelling it instead of other fuels will decrease the pollution. Bio-fuel is the only fuel that is approved by the Environmental Protection Agency certifies Biofuel and is an established passed product for Clean Air Act. Organic resource utilization for the production of energy is called Biomass. Examples are waste, crops, and wood of which commonest used is wood.
Today the most popular are Hybrid vehicles, solar energy, and wind energy. Alternative energy sources which have lower carbon emission have attracted the world attention. There is more research being done on crude oil along with its several alternatives. Speedy consumption of crude oil is urging major industries to go on the lookout for breakthroughs in alternative energy to continue their businesses.
Big companies are now making changes in their energy policies. Even politicians and scientists are worried about the supply of crude oil at an increasing price. Some are worried about environmental issues. It can be said that having energy and being able to pay for it are huge challenges. It is estimated that by 2030 worldwide energy consumption will be 44% greater than it was in 2006 by Energy Information Administration. The projected requirement of 678 quadrillion Btu’s includes both transportation fuel and electricity usage. By the year 2050, the demand might triple from its 2000 level with the continued patterns of development as of today.
Sustainability is a big concern. Price plays an important role in consumer’s perspectives on energy use. Consider the people’s reaction to the price increase in oil in different countries. Forecasts show that worldwide energy demands will continue to grow much more quickly than new oil reserves. The Chairman of a medium-sized oil company predicts that an oil crisis is coming in the next 10 years. Once oil production reaches a maximum or peak, finding additional supplies becomes increasingly difficult and prices increase as a result. For some people, global climate change is the most compelling reason to switch to alternative energy sources. In 2007, a committee named Intergovernmental Panel on Climate Change (IPCC) declared Climate to be explicit.
According to IPCC emissions of carbon dioxide and other compounds that resulted from human activities are very likely caused by an increase in the average temperature since the mid-twentieth century. According to a report published in 2007, 57% of the global carbon dioxide came from burning fossil fuels. A refined form of crude oil results in the production of Kerosene, gasoline, and diesel fuel. These by-products are then used for transpiration, medicine, manufacturing materials, the petrochemical industry, and paints. Greenhouse gases like carbon dioxide and other pollutants of the air are a major issue of fossil fuel. Unlike shale oil, nuclear fusion, natural gas, and cola Crude oil are not renewable. The price of it per barrel has increased to $ 60 for every barrel because of its consumption and the depletion occurring in the natural resources. The United States alone in 2004 was responsible for the exportation of 11.8 million barrels an equivalent of 58% US demand for the oil with their consumption being 20.4 for the same year. There are many other sources available for crude oil and with the discovery of even more and oil being available through other means the increase in the oil price could be controlled.
Crude oil is not only the primary source of power but also a source of being in power. It is used for car fuels, industries, and heating homes, and also an important factor of national economic growth. It has a big effect on both military and political policies the world over. Its importance makes it sought out in policy-making, academics as well as by businessmen. It is vastly researched especially in the area of alternatives to crude oil. However future prediction and explanation of the historical data are yet to be formulated.
Background of the problem
Crude oil falls in the category of the most crucial source of power/ energy and is the most traded commodity globally. Its demand is seen as reliant on macroeconomic circumstances. Analysts’ outlook on the oil market has been a bullish one. Most studies in 2010 identified upward trends regards to global oil demand especially as the globe gets over the recession. They are warning that the globe has not responded to the coming demand. According to the IEA, the Global capital spending on exploration and development of crude oil reserves activities fell by almost 20%, in 2009. They see the decline as unprecedented. Because of that, they estimate a decline in the output of oil in the long-term. To most oil analysts, this will be catastrophic for the globe.
This research takes the opposite view from the oil analysts. It uses that premises from Michael Wunder on Oil Market Modelling and its key objective is to show the slow down switch in investment from crude oil to alternative sources is a deliberate one as agents realize the need to stop investing in crude oil but invest in the alternative energy sector. Even During the recession, the alternative energy sectors have kept growing. In this work, the term alternative energy includes nuclear, solar, wind power, biofuels, and other energy sources bar oil. This is an interesting topic to me as a supporter of a balance between oil and alternative energy development.
The rationale for the research
This research aims to show the switch in investment from crude oil to alternative sources as agents realize the need to stop investing in crude oil but invest in the alternative energy sector. It concludes by emphasizing the imperativeness in continuing with the effort for alternative energy in ending wild price swings in the oil market. This research also shows strong global determination and political will to reduce the dependence on oil. It argues against the assertion that the estimated decline of the output of oil in the long-term will be catastrophic for the globe. The assertion is based on the hypothesis of the volatility of the prices of oil and has little to do with macroeconomic variables such as supply and demand. While most oil market analysts have mostly given attention to macroeconomic variables to forecast oil prices, the unpredictable decisions of producers (OPEC), consumers, and pure speculators are to be blamed. Their behavior will continue to affect the oil market if nothing radical is done.
Using the three-agent model developed by Kawai (1983) and evidence collected, one can show that alternative energy source development will change the dynamics of the interactions between producers, consumers, and pure speculators. Since the crude oil price quadrupled in the early 1970s, economic theorists worked on multiple theoretical and empirical studies for market analysis and structure and OPEC. It is for the OPEC that the majority of the studies are done. The study of the behavior and its critical analysis is important to the literature on the OPEC. In 1984, Dermot Gatley surveyed the OPEC behavior modeling and its uses in the theoretical approach which was substantiated upon the wealth maximizing model and on the target capacity utilization model. Salehi-Isfahani and Cremer in 1991 conducted a thorough survey based on the economic studies conducted on the global oil market and recorded its results over the years 1975 to 1990. OPEC models were divided into two basic types: competitive models involving backward bending supply curve, and supply shocks models, and monopolistic models including cartel and dominant firm models. This survey was later reinforced in 1995 by Salehi-Isfahani with the inclusion of new models Kawai (1983).
Research Question and Objectives
The research uses the three research questions as sub-topics:
- Is the decline in the spending on exploration and development of crude oil reserves activities linked to the rise in the research and development to alternative energy spend?
- Do we expect the change in the balance of power and end speculative nature of oil trading due to the shift to alternative energy sources. Will oil prices fall more than can be accounted for by the increase in supply from alternative energy sources as OPEC market power and speculative activities reduces?
- Is there a strong global determination and enough velocity to reduce the oil reliance with the evolution of alternative technologies and resources of energy?
Limitations of the project
The challenge for this dissertation will be in the reconciliation of contradicting empirical evidence to show that capital spending on exploration and development of crude oil reserves has connections to the increase in investment in alternative energy.
Theoretically, there is an opportunity to establish that a radical change through the development of alternative energy will end the avoidable volatility and unjustifiable crude oil prices due to it being used by other commodities and exploratory forces and OPEC production decisions impacts.
Scopes of the study
The awareness for seeking alternative resources for oil stems from the problems of increased oil prices and diminishing reserves Adelman (1992). The research will help in the development of clear evaluation availability and cost of the different sources available. It will give an idea of the increasing popularity of alternative energy sources.
The study will consider the demand and supply of alternative energy sources. The study is most likely to cover competition and consumer issues for crude oil. It will compare crude oil and its alternatives in detail.
Literature Review
This literature review covers seven elements of the research (1) Energy market interactions and changes. (From Oil to Alternative) (2) Speculators and producer (OPEC) behavior within the oil market. (3) Energy consumption throughout the world. (4) Global political will and pace in the development of alternative energy. (5) World Economic Outlook. (6) Price Analysis. (7) Sensitivity analysis.
Energy market interactions and changes (From Oil to Alternative)
In Adelman’s (1992) opinion, exploration and then the production of oil is a difficult work which has many contributing factors. The use of artificial intelligence makes the approach simple. In the highly unpredictable oil market, the producers of oil and agents make their decisions using the probabilistic knowledge obtained through experience. Experience is attained by the agent with repeated iterations in the world. The agent is awarded every profitable action. Intelligent decision-making helps in the good performance of the agents with increased profits. It was proved that neural networks produced far better results with experimentation using a Q-learning algorithm. Better decisions were achieved through reinforcement learning. Changes in the prices of oil are re-established through the use of artificial intelligence. Accuracy is achieved with the implication of these models which is very essential for the market.
The oil production methods and market interactions change will be illustrated through work done by Michael Wunder on Oil Market Modelling Using Q-Learning which shows the complexity in the search and production of oil by using an artificial intelligence approach, is going to be used in this dissertation to show why global capital spending on exploration and development of crude oil reserve will keep going down. According to “Wunder, in the experience is used as the major key factor for the decision making in the simulated oil market by the oil producers and agents. Experience is the result of repeated iterations in the world and the agents and producers are awarded for every profit. It is now established that the country with rich oil resources enjoys and avails a high standard of the socioeconomic role. The financial market itself is greatly affected by this industry. Yet it is to be realized that this resource is diminishing fast and its availability is becoming increasingly expensive. The industries worldwide are greatly affected because of this fact to the effect of being crippled like for example the transportation industry. For example, the population of China is more than 1.3 billion with an economic growth rate of 8% to 10% annually. There was an increase in Automobile sales by 70% the previous year. The second greatest user of oil is China with more than 8.5 million barrels per day consumption, after the United States (nearly 20 million barrels per day). With the current situation, conservative experts predict oil prices to be explosive in another 50 years’ time. It uses that premises from Michael Wunder on Oil Market Modelling as a deliberate one as agents realize the need to stop investing in crude oil but invest in the alternative energy sector.
The key objective of this model is to show the slow down switch in investment from crude oil to alternative sources. Crude oil or black gold has an industrial source of global primary energy been estimated to account for anywhere from 30 to 40 percent of the total energy consumption. Alternative energy sources are coal, natural gas, nuclear and hydropower, solar, wind, geothermal, and biomass account for very little of the total. In 2006, a British Petroleum (BP) study shows that hydropower and other alternative energy sources (collectively known as renewable energy or green) is only about 7 percent of the net power consumption globally. Currently, wind and solar contribute less, but they will continue to grow and provide substantial electrical power in local areas.
The three major energy sources are gas, coal, and crude oil. These together hold more than 75 percent of the total energy consumed. The energy sources date back to prehistoric times. The availability of the current resources for crude oil is a clear sign of it being depleted soon. It is estimated that by 2050 this main source of energy might as well be depleted altogether. For this very reason, the capitalists are much concerned to dig into other available sources for alternative energy. These go much beyond the concepts of nuclear and fossil fuels. The United States has more than 100 nuclear plants and Europe about 200 and this speaks volumes about the importance of nuclear fuel. Japan contributes another 30% and France has 80 percent of electricity being derived from nuclear fuel.
Speculators and producer (OPEC) behavior within the oil market
Since 1973, the market structure of the Organization of Petroleum Exporting Countries (OPEC) is being criticized because of the increased prices and so has gathered much of the public attention to it. The prices notched higher from 1978 to 1979, dropping in 1986. Perhaps as per the logical assumption, OPEC is a lobby or maybe a race towards the gain of revenue and so understandably cartel.
Yet Cartel argument is not sought after universally. There are many suggestions for the working of the OPEC. The increment in the oil prices was not predicted by Cartel in 1980. Rather, he asserted that greater prices are the resultant of the competitiveness involved in the oil market which is followed by the lowering of the rates. The high price is caused because of the transfer of ownership of the multinational oil companies, with exaggerated discounts as compared to the OPEC countries. The competitive model of the revenue, which produces a backward bending demand curve when the income is achieved, suggests that higher prices reduce production by OPEC.
According to the Economic theory which is based on Hotelling the value of a resource can be increased by the owners of the resource through dynamic optimization.There are many types of research focusing on the dynamic optimization analysis of OPEC.In 1973 Nordhaus was able to optimize oil suppliers with vigorous energy in the hypothesis involving competitive markets, this further enabled the costs to increase at a maximum keeping in view the competition where many restrictions are imposed as well. According to Kalymon (1975), It is the monopoly of OPEC with the additive coalition that produces the increased revenue involving both national and international sales, this is the result of the OPEC cuts. Cremer and Weitzman (1976) To increase a country’s excess the OPEC works along with the cuts of competition for additive costs and limitations of capacity in producing the supply against the world demand. According to Hnyilicza and Pindyck (1976), the OPEC can be seen as a block of investors that give the lowest rates and a block of spender with a high rate.
Despite numerous research carried out in conjunction with the behavior of the OPEC remains to be more definitive. The experts still have many varied opinions upon the model that represents the oil market structure and already to clear these three decades have passed. In this literature, review light is thrown on the complexity through empirical literature. Supporting the observations made by Gately (1984), Griffin et al (1982), Griffin (1985), Bockem (2004), and Smith (2005), Gatley thinks that yet the answer to the question is a riddle when it comes to designing a model for the OPEC behavior. According to Bockem even today there is a need for the econometric model as a theoretical model is the need of the market. Whether OPEC is substantial is still a disputed problem of economic theorists and economists.
There were many empirical as well as theoretical studies formulated in the year 1970, to evaluate the role of OPEC in the oil market worldwide. However, there has been much criticism of the behavior as examined in the studies. Dermot Gatley (1984) was responsible for one of the earliest studies in conjunction with OPEC behavior using a model based on a theoretical approach to increase revenue.
Nash equilibria used optimal bargaining solution to energetically solve varied and fixed shares. OPEC cartel was dealt with by Pindyck (1978). This is what increases the reduced profits with the resultant value of recognition for the demand. Roumasset et al. (1983) formulated a simulation model for competitive dynamics. The differences in the prices of oil before the year 1983 has been because of the different thought and views on the other commodities and so the cost of production ceased. Assuming multi commodity-based model the Nash Cournot, Salant (1982) energetically maximized. With the supply and demand in the five different regions, the US in sixty-seven years simulated tariff Nesbitt and Choi (1988). The OPEC was defined by competitive fringe and cartel. The simulation concept was based on the reserves and feuels that amounted to $ 60 a barrel. Dah1 and Yücel (1989) formulated a dynamic optimization model for the US tariff for the gasoline tax and subsidy to the producers of the oil. The OPEC in the model is taken as a central firm.
According to Smith, the contributions are uncertain as far as the behavior and impact of OPEC are concerned regardless of the efforts of the varied authors.
Maximization of profit used to be the main aim of a business and financial management till the concept of wealth maximization came into being. It is a superior goal compared to profit maximization as it considers a broader arena. Wealth or Value of a business is defined as the market price of the capital invested by shareholders.
Wealth maximization simply means the maximization of shareholder’s wealth. It is a combination of two words viz. wealth and maximization. The wealth of a shareholder maximizes when the net worth of a company maximizes. To be even more meticulous, a shareholder holds a share in the company /business and his wealth will improve if the share price in the market increases which in turn is a function of net worth. This is because wealth maximization is also known as net worth maximization.
Finance managers are the agents of shareholders and their job is to look after the interest of the shareholders. The objective of any shareholder or investor would be a good return on their capital and the safety of their capital. Both these objectives are well served by wealth maximization as a decision criterion for business.
Capacity input or output is maintained by input or output-methods of measurement. For capacity utilization there needs to be the existence of comparison to formulate the presence and extent must be compared to some base level to establish the existence and scope. The comparison could either be a reference point that is an indication of refined and understandable reference or an input or output level. The capacity output may also be a comparison of a pre-defined level of output determined by biological or rigid aims. However, it is to be noted that the comparison point is dependent upon the nature of the analysis that is whether it is a short or a long term state. In such cases stock needs to be taken of the fact that in long term the levels of stock are restored as well as the costs which have been minimized.
Is about the Energy Information Administration’s Oil Market Simulation model for the analysis of target-capacity rule to prove the economic objectives of OPEC. In the case where there are gaps in the demand and supply, OPEC may result in low periods of price to price shocks. The price shocks that occur from time to time are absent in the TCU rule and hence the revenue generated is less discounted for the planning period. In the case where the OPEC gathers minimum revenue and when there are no lagging periods the TCU rule comes is near optimum.
Gately suggests a more definitive reason for the approach which is a more precise model of the behavior of OPEC. The model is a definitive description of OPEC behavior. According to the law of the OPEC model behavior under these circumstances. This research is contrary to our view of OPEC. It defines the behavior of OPEC is based on the standard offer and demand rule of economics. The target here is the objective of the instrument. The goal is not the model of capacity utilization. The objective of this thesis is to investigate whether a turnover of OPEC and its well-being. Given the unlikelihood of the true nature of the oil market and the complexity of price change, the model’s ability to “target” best serves the welfare of OPEC.
Especially compared to Sterman’s theory that emphasizes the theory Gately examines the behavior in unpredictable situations. The theory also is about the ultimate goal of OPEC which is to increase welfare. This theory does not explain why the focus is on capacity utilization instead of the interests of OPEC. There are no details on why some characteristics are taken as finest. A recent traditional study on OPEC and its modeling discussed Gately’s total capacity model in detail. Taking the models as ad hoc the focus is on the factors inclusive of the capacity utilization. The first factor is the amount of capacity. Regarding the intensity of capacity, Gately identifies that the skill is exogenous in most of the models. In his view, the capacity level is dependent upon the long term and is affected by it and not the short term. Capacity utilization is the target which according to Gatley is the second factor. Any change to this factor means a direct effect upon the price change. The last factor is about the price change and its relation to capacity utilization.
Both second and third factors can affect the price changes but the general shape of the price path will remain the same. There is no direct evidence about these generalizations and the total capacity utilization model says that changes in these factors do have a very high impact on price.
Defense of the Target Capacity Utilization is to be taken into account. The capacity utilization model says that capacity is typically an outside factor in these models. At the same time, it says that in time OPEC is affected by the capacity decision. “Economic Modelling is arbitrarily fixed circular reasoning ability of OPEC. Expansion of capacity should endogenize and when they are, the results are likely to be very sensitive to factors that determine the capacity expansion,” said Gately.
Gately argues that the capacity had almost no impact in the short term. So for short-term forecasts, this evaluation model may not be fulfilling. He also said that any change in the expected level or form of utilization curve of the target does not manipulate its outcome. If someone makes long-term forecasts, so perhaps the ability itself questions, but no information on total utilization.
To summarize these points show that the evaluation for the model is purpose dependent. Indeed, OPEC capacity is endogenous for the long term and needs to be taken as such. For the short term, a more permanent capacity level is required. But it remains an open question that these outcomes have not affected the boundaries of the curve of total capacity utilization.
The discussion about the total utilization of the insensitivity or sensitivity of the model is a result of the predefined standard. Looking through sequential optimization, total utilization needs to be held responsible as the optimation model does not clarify it. So there may not be any logic in narrating that ill-defined computing of the OPEC or data for that matter can be worked through the present models of optimization. One could safely assume that many superior models of optimization could be achieved considering the limitations.
Hogan & Leiby proposed another way of amalgamation of performance optimization and the approaches. For the restructuring of the alternative goals, The theory of rational behavior and Optimization theory is used. In case logic or ground rules are establishes using the theory of optimization only then it could be said that OPEC could very well be both realistic as well as theoretical.
Three agent model
Using the three-agent model developed by Kawai (1983) and evidence collected, one can show that alternative energy source development will change the dynamics of the interactions between producers, consumers, and pure speculators.
This work also tags to Kamilah Williams work that points to the Three-Agent Model as the reason for oil volatility. This supports the view that developing alternative energy will mark the end of a complex oil market with interactions difficult to predict.
In this research, the model for the petroleum market is used in conjunction with the establishment of improvement in the capacity of forecast and empirical evaluation of prices over the short term for the Bank of Jamaica. This was formulated because of the price fluctuations of the market and to gain a perspective on the different models available. Kawai (1983) introduced a refined model through which the oil prices could be checked for the speculator, producer as well as the consumer. This is the three agent model of Kawai which helps in the establishment of oil prices and the effects of the approximation and other influences.
For the analysis of the crude oil price, there are many different beliefs available yet none have been satisfied with the question about the fluctuations in the oil price. One belief is about the relationship between the supply and demand for the price change. By the theory of Microeconomic excess demand price increases until an equilibrium is established between supply and demand. On the contrary, the prices will tend to decrease with an increase in supply. This is also established in the different oil inventories. Research has also been conducted regarding the prices of the commodities and the inventory. Gustafson, Pindyck, and Thurman, Ye et al established the oil prices through defined inventory levels. But this could not carry on after the year 2004.
There is also a belief that the commodity markets have a powerful influence on oil prices. This belief is much popular in modern times. Chinn, LeBlanc, and Coibion formulated that future prices are the most efficient predictors of oil price change. These prices according to them were genuine and not biased but yet the results were not the same in actual and the difference was marked. Tabak came to a similar conclusion and also found that concerning the commodity price change the oil price was low.
Another belief was formulated by Dees et al. He opted for the macroeconomic fundamentals like and interest rates and GDP to understand the supply and demand against spot prices. Krichene (2005) and Krichene (2007). Also used a similar model. They could establish the effects of supply and demand but be still miles away from obtaining and proving the actual result.
Kawai Three-Agent could establish the relationship between the futures market, market basics, and speculation in regards to the spot oil price. Kawai’s (1983) establishes his hypothesis as speculators playing a pivotal role in the price estimation. Hence the agents are on the alert in the fluctuations of the market and decide upon the oil price accordingly. So all in all this three-agent model was recognized as the best model.
Energy consumption throughout the world
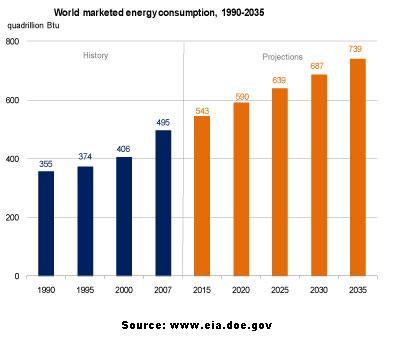
If we look at the graphical statistics, it can be seen energy consumed by the world is on the rise by an estimated rate of 1.4 percent annually. Energy consumption will rise from 495 QBtu in 2007 (quadrillion Btu) to 739 QBtu in 2035. The global economic recession started in 2009, had a very deep impact on energy consumption and world income. Years 2008 and 2009 saw a gradual decline in GDP growth rate by 3 percent and 1 percent respectively, as against 4.9 percent in previous years. Slow GDP growth affected energy use and in 2009 it was declined by approximately 2.2 %.
The economic global recovery process is still incomplete. Most of the non-OECD Asian countries developing countries are out of this recession. The United States is almost out of the recession and European countries and still struggling. It is expected that the world will be out of this recession by 2015. It is projected that world GDP will continue to increase by an annual average of 3.2 percent from 2007 to the year 2035. GDP growth of non-OECD countries will average 4.4 percent annually. The OECD country’s GDP growth will have an average of 2 percent per year.
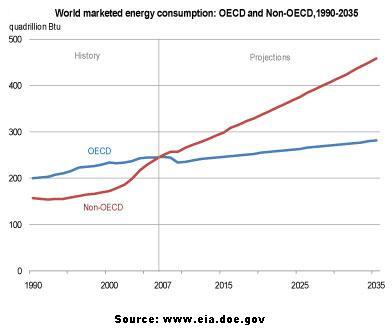
By looking at historical data, it is clear that energy consumption figures of OECD member countries were larger than non-OECD countries. But in 2007 the energy consumption of non-OECD countries exceeded. Emerging non-OECD nations are expected to grow more rapidly as compared to OECD member countries. This rapid growth will increase their energy consumption too which leads to a growing discrepancy between OECD and no-OECD nations.
Energy consumption of non-OECD countries in 2007 was 1.5 percent higher than in OECD countries. Projected data explains the growing energy consumption of non-OECD countries. In 2020 it will be 32 percent higher than OECD countries and in 2035 it will be 63 percent higher. The energy consumption growth rate in OECD countries is just about 0.5% from the year 2007 to 2035 in contrast to the non-OECD countries with 2.2%.
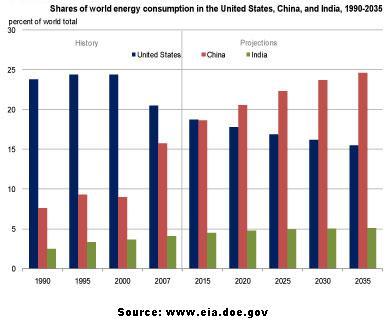
India and China were the least affected countries in the global recession period. Both of them are leading the global energy demand growth and economic growth. The utilization of energy is on the rise in these countries. In 1990 these countries had only about 10% consumption but by 2007 it had already notched to 20%. This is the depictor of economic growth and is continued till an estimated year which is 2035 by which time the consumption would have reached 30%. It is an interesting fact that the energy consumption of the United States falls from 21 percent to 16 percent from 2007 to 2035.
Consumption of energy in non-OECD Asian countries, especially India and China, is the greatest amongst all the non-OECD countries. This has jumped to 118% from 2007 to 2035. Rests of the non-OECD nations are also showing very high growth in energy consumption. Due to high population growth and access to rich resources, energy consumption demand in the Middle East increases by around 82 percent from 2007 to 2035. While, the demand for energy consumption in Central America, South America, and Africa increases by about 63 percent. Non-OECD Europe, Russia, and other former Soviet Republics show the slowest projected growth among non-OECD regions. Increased consumption is 17% from 2007 to 2035 because of the reduced population and being more energy-efficient.
This research presents an overview of the worldwide use of energy. It also incorporates the analysis and the predictions of the formed views. These assumptions involve both the OECD and non-OECD countries. These assumptions, like any other set of assumptions, are not stable in the formulation of energy consumption. In this research, There are cases discussed which may be contrary to the predictions. The two cases are Low Economic Growth and High Economic Growth and also high and low oil price. These are discussed to further clarify the available choices and also in the understanding of problems, and limitations in the case of policy and even the technological improvising that affect the growth.
Global political will and pace in the development of alternative energy
Empirical evidence from various reports on energy investment statistics will be important in showing the trends. The research focuses on the change in the global energy system in conjunction with the change in the oil price and its demand. Most of the governments who are struck by the recession need to counter the effects by regulatory mechanisms. The actions are explained by voicing the concerns of employment, climate change, energy security, etc.
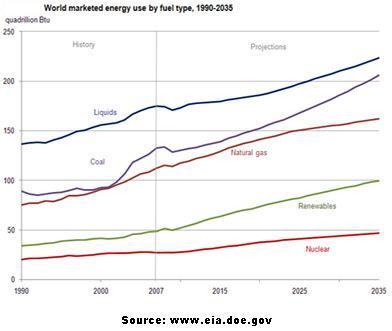
Even though oil prices will continue increasing throughout the projection period, growth of the crude oil is slowest as compared to other energy sources. An average annual increase, in the consumption of crude oil, of 0.9 percent is seen from 2007 to 2035. It is relatively low as compared to the energy demand of 1.4 percent per year. Renewable energy sources are the fastest among all sources of energy, having consumption of about 2.6% annually. Factors, including high current and projected oil prices, environmental concerns about crude oil use, and incentives given by the government, greatly improve the consumption statistics for renewable energy sources worldwide.
Crude oil will remain the biggest source of energy but its share in the world marketed energy consumption will continue to decline each year. Statistics show that crude oil energy consumption will come down to 30 percent in 2035 which was 35% in 2007.
The most important fuel source is natural gas for electricity and this fact is established globally. It is a lot cheaper contrary to energy production by oil. Also, natural gas plants need far less revenue as compared to the plant capital required for the cola or nuclear plants. Even natural gas consumption is now on the rise with 1.3 % annually. This was increased from 108 trillion cubic feet in 2007 to a predicted 156 trillion cubic feet in 2035. Because of the electric power sectors, the increase alone is 1.6% annually.
Continuously increasing crude oil prices are beginning to encourage consumers to invest in natural gas shortly. Supplies of natural gas will explode by the year 2020 with resultant decreased growth in the natural gas. The projected average global natural gas increase in demand is 1.8% annually for 2007 and 2020, but the rate of growth during the next 15 years (2020 to 2035) is only 0.9 percent per year. Due to the depletion of fossil fuels, consumers are converting to renewable energy sources like wind power and solar.
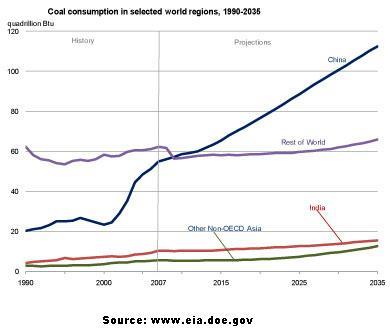
An increase can be seen in world coal consumption with 1.6 % annually for the year 2007 to 2035 but, as in previous cases, the increase in the energy demand and consumption will be after 2020. The global rise in coal utilization was 35 % between 2002 and 2007. The main reason for this high growth was its high demand and consumption in China. At the start of the recession period, demand for coal utilization decreased by 3%. The global recession had a direct bearing on Coal utilization in 2008, with a fall in consumption in 2009. Coal is largely used for iron and steel production. The demand for these commodities was badly affected in the recession period which resulted in the lowering of coal demand.
In most countries, the production and consumption of coal are restricted by the use of policies and legislation. But where there are no such policies as in China and to some extent, India and the other non-OECD Asian nations consume coal instead of expensive fuels. If we look at the world coal consumption statistics, China is at the top with around 78 % utilization while India and other non-OECD Asian countries share 17 percent.
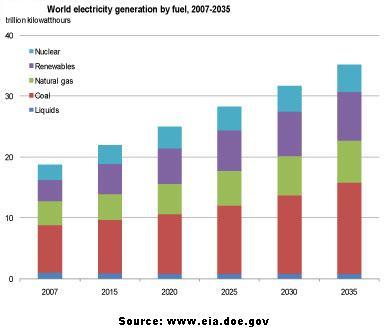
Electricity has been The most utilized form. Without any doubt, it is still the most demanded end-use energy. It fluctuates by 2.3 % annually. while the energy is growing at about 1.4 % annually. The greatest surge in electricity production and consumption is has been in non-OECD countries. Electricity production is rising at a high pace in Non-OECD nations by an annual increase of 3.3%. The reason for this high average rate is the rising standard of living. In non-OECD countries, the demand for residential and commercial electricity is increasing. OECD nations are developed nations and the population growth rate is low as compared to non-OECD nations. Infrastructure in OECD countries is more mature and developed. Due to these factors, electricity generation growth in OECD countries is much slower having an annual average of only about 1.1 percent from 2007 to 2035.
If one has to take a closer look at the generation of electricity, one can conclude that the largest share in the electricity generation is provided by coal. In 2007, 42 percent of the total generation comes from coal and it is unlikely to change until the year 2035. On the other hand, crude oil, nuclear power, and natural gas have lost their market share in global production in 2007-2035, influenced the ever-growing plan for renewable resources of production. It can be considered that renewable generation is growing by 3.0 %/ unit annually. It becomes the major source of electric power in comparison to other sources like coal, natural gas, and nuclear power at 2.3 percent, 2.1 %, and 2.0 % respectively. The construction of the renewable energy source generation facilities was supported around the globe. It is somehow evident in the policies and incentives issued by the government. In 2007, the share of renewable energy sources increases from 18 percent and is said to increase in 2035 to about 23 percent.
Around the globe, the largest provider of renewable generation is hydroelectricity with about 54 percent and wind of about 26% in total share. The mixture of the OECD and non-OECD regions have caused a significant change. In most OECD nations, the maximum number of hydroelectric sources is established excluding those in Canada and Turkey in which few large-scale hydroelectric powers are planned in the future. The renewable energy from most OECD countries usually comes from a non-hydroelectric source like the wind. Other OECD countries, especially in Europe, have policies issued by the government that promotes the construction of wind and other non-hydroelectric renewable electric facilities.
For non-OECD countries, their major source of renewable energy is hydroelectric power. There is a significant growth in hydroelectric generation, generally using mid-to large-scale power plants. These are already anticipated in Brazil and non-OECD Asia most especially China and India. Together, it totals up to 83 percent of the overall growth of non-OECD hydroelectric production within the projected timespan. The rates are higher for wind-powered electric generation in non-OECD nations. China is the leading non-OECD local industry that uses wind power, in which the total generated from the wind power plants tremendously increases from 6 billion kilowatt-hours in the year 2007, by the year 2035, it might reach around 374 billion kilowatt-hours. Observing the data, there is a total boost in the wind-powered generation of China that is less than 50 percent of the actual hydroelectric generation.
Throughout the world, the electric generation coming from nuclear plants rises from 2.6 trillion kilowatt-hours in 2007 to 4.5 trillion kilowatt-hours in 2035, with fossil fuel costs tending to become higher, as well as issues regarding the security of the energy source and greenhouse gas emissions, support the growth and development of the nuclear-generating capability innovations. The average capacity utilization around the globe increases from about 65 percent in 1990 to about 80 percent today, less growth is still expected in the future. Furthermore, the majority of the plants that are working in OECD countries and non-OECD Eurasia are mostly outdated and must be given an extension for their working permit.
Concerns about the future of nuclear power have become controversial that most nations are having doubts about the security and safety of the plant. These issues reduce the development and growth of nuclear power plants as the issues about plant security, radioactive waste disposal, and nuclear material proliferation are elevated at the community level that may affect numerous communities. These also impede the development of various programs together with the generation of funds for the maintenance expenses of the plant. These may perhaps retain few nations from expanding projects and programs in improving their nuclear plants.
In non-OECD countries, there is an estimated 72 percent improvement within the installed nuclear power capacity. Among the nations with a large increase can be attributed to China, India, and Russia between 2007 and 2035. China increases at 66 giga-watts while India and Russia at 23 giga-watts and 25 giga-watts respectively. Each nation raises its working nuclear capacity to some degree excluding Australia and New Zealand. These two countries have directives and procedures that suppress the development of nuclear power.
Changes from previous IEOs, and the rise of the nuclear power capacity within the given period is recognized by OECD Europe. There are quite a few European nations that need a reassessment of the nuclear policies during the previous years. Government authorities of various nations have declared the modifications in 2009 like the Belgian government that declared to defer and phase-out programs in 10 years. German government shows determination to further study and re-evaluate nuclear policies and the Italian government terminates anti-nuclear policies and declared their plans for constructing new reactors in the year 2020. There is also a lot of evidence that most European nations including Turkey and Poland decided to start nuclear production programs. The IEO shows that OECD Europe installed an additional 10 giga-watts in 2006 and 2030 of nuclear capacity between and had suffered a loss of 11 gigawatts of nuclear capacity.
In the United States alone, the Energy Policy Act of 2005 gives authority to the U.S. Department of Energy to provide loans for the innovation of modern technologies that “avoid or reduce greenhouse gases”. There has been an allocation of an $18.5 billion guarantee for the nuclear power plants. The legislation, along with high fossil fuel costs can increase 8.4 gigawatts of capacity in the nuclear power plants that will be built in the U.S. between 2007 and 2035 and about 4.0 giga-watts for the innovations and expansion of existing plants. US nuclear energy generators are said to operating until 2035, assumptions can be made that the owners will then apply for and receive necessary operating licenses and renewals in case they want an extension after operating for 60 years.
Learning the patterns of the end-user in the consumption of energy is important in forecasting the various developments and innovations for global energy use. Depending on various factors such as the energy resources available and the economic developments, the energy consumption varies in residential, commercial as well as industrial sectors aside from the transportation sector.
The energy consumption of the residential sector is about 14 % of the total energy consumption around the globe in 2007. The growth of residential energy increases at an average of 1.1 % annually for the projected period. This excludes use in the automobile sector. The energy consumption of households varies on income, natural resources as well as the climate of the infrastructures used to provide energy. Generally, OECD nations consume a lot of energy than non-OECD nations because they have higher incomes and they can acquire large homes and can have more equipment that requires energy. If we take the U.S. as an example, the GDP per capita is roughly around $43,076 in 2007 and the energy consumption is about 37.2 million Btu. China uses around 4 million Btu, which is about one-ninth compared to the U.S., and its GDP per capita is estimated at $5,162 only that is just one-eighth of the United States.
The key indicators of the energy consumption of the occupants in the residential area are the physical structure of the house or buildings, although income may affect the consumption, other factors like weather can also affect the energy consumption. Generally, big homes need more energy for maintaining and controlling the environment inside. Larger homes needed more appliances and lighting equipment compared to smaller structures. Residences in China, on average has at least 300 square feet of living area compared to the United States with an estimated 680 square feet.
The projections are only for commercial energy and it does not include non-commercial sources that have been heavily used by non-OECD nations including wood and waste and other sources used to heat and cook food. An estimated 70 percent or more of sub-Saharan Africa still do not have electricity according to the International Energy Agency. A large part of India and Africa, at around 37 percent of the population around the globe heavily relies on animal dung, fuel-wood, and other agricultural residues that can be used to cook. China also relies on these traditional sources of energy. As the world develops and income increases, these traditional materials are replaced by the marketable sources of energy as it becomes accessible to most people.
The service sector as well as institutional sectors that comprise businesses, institutions, and organization service providers consumes about 7 % of the produced energy in 2007. It includes many other types of structures with a wide range of energy-related services. From 2007 to 2035, the average estimated rate of growth of the commercial sector is about 1.5 percent annually. The commercial sector includes educational institutions, stores and groceries, office buildings hotels, restaurants, correctional institutions, health institutions, museums, sports facilities, and financial institutions. These sectors often use this energy for supplying proper lightings and maintaining the correct temperature inside their premises. Traffic lights, water, and sewerage systems street lights also use energy and are categorized under commercial energy consumptions.
Commercial activity is based upon the different trends and also is affected by the population which consumes energy. Different services are crucial to the population like health and finances. These needs are directly proportional to the increase in the population. Economic resources also play a vital role in the growth of the economy.
The increase in the economy offers a view of how many additional activities are needed in the commercial sector. Most countries that have a high level of economic activities have a greater demand for hotels and restaurants that meets the requirements not only for cultural purposes but as well as for leisure such as theatres, galleries, and arenas. Offices as well as businesses that are expanding may also have greater demands in energy consumption. Energy usage for every dollar of income is measured by GDP or energy intensity. The energy intensity of non–OECD nations are usually lower than OECD countries in 2007. Non-OECD nations have at least 281 Btu per dollar compared to about 50 percent of those who are in OECD level at around 522 Btu/$ of GDP.
GDP increase is usually slower in many OECD countries shortly because of the slow rate in increase in the demands on energy used commercially. The efficiency of the energy demand moderately improves as time passes by as more and more energy-using equipment is being replaced with modern ones. The unending economic growth is somehow expected as the energy consumption associated with the specific sectors in such areas like retail and wholesale trading, business services as well as services dedicated to leisure. The largest among commercial energy consumers can be attributed to the United States and is estimated to retain the position accounting for around 45 percent of the total OECD in 2035.
Economic activities including commerce are increasing fast in non-OECD nations and need additional demand for energy for sectors that provide services. There is a tremendous increase in the population in these OECD countries that the great demand for social services as well as health care and education is needed. The changes made in the transformation of the developing nation may require greater demand for energy for the commercial sector. The estimated delivery of the commercial energy needed by non-OECD countries is increased by 2.7 a year in projected years. These are needed to further growth in the economy as well as to fuel the expansion of commerce.
Manufacturing as well as agriculture, mining and construction as well as various activities like processing and assembly, space conditioning as well as lightings. Energy consumed by the industrial sector is divided among different groups of industries. The industrial sector uses about 51 percent of the total delivery around the globe and increases at an average rate of 1.3 % annually. The energy demands in industries may vary in various regions and countries based on various factors such as economic activity as well as its technological advancements. This industrial energy comprises petroleum products and natural gas and is often utilized for plastics, fertilizers, and non-energy products. The industrial sector consumes about 50 percent of the total energy delivered.
OECD mostly has efficient energy sources for industrial operations and outputs. They are more into non-energy-intensive sectors compared to non-OECD nations. The industrial energy consumption ratio against the total GDP is usually higher in the non-OECD economy. On average, the energy consumption in the industrial sector per dollar or the industrial energy intensity is almost double that of those in OECD nations.
The use of energy in the transportation sector includes not only moving people from one place to another but also includes the transporting of goods via rails, roads, air, water, and pipelines. The energy consumption of this sector increases at a rate of 1.3 % annually in the projected years and is estimated to consume about 27% of the total delivered energy consumption in the world. The components of road transports range from light vehicles like a minivan, sports vehicles, small trucks, automobiles, and motorbikes, it also includes heavy-duty vehicles that carry freights and buses that are used for transporting passengers. The rates of growth as well as the population are among the key factors that affect the energy demand of the transportation sector. As the economy grows and increases the output of the industrial sector, the movement of the materials used for each production site increases and also the transportation of the finished products to the users.
Whether they are the economies of non-OECD or OECD, the demand for personal travel increases with the energy demands for transportation. Urbanization and the increase in personal wages may have increased air travel as well as the increase in vehicle owners in growing economic communities. The increased in the demand for energy in the transportation sector is the result of the growing economy of both OECD and non-OECD countries. As more and more freights leads to the growth in transportation fuels, trade among countries increases as the nation enjoys rapid economic growth.
World economic outlook
In projecting the change in global consumption of energy, the most important factor is economic growth. This study assumes regional economic growth by measuring real GDP in terms of US dollars. At the start of 2008, the worst recession of the past 6 decades was experienced by the world. The recovery process is in the process but no one can say when the whole world will be out of the effects of the recession. Some countries like developing countries in Asia appear to be recovering faster as compared to developed countries. Most of the developed nations of Europe and Japan are recovering at a very slow rate. For them, there is even a risk of return to recession.
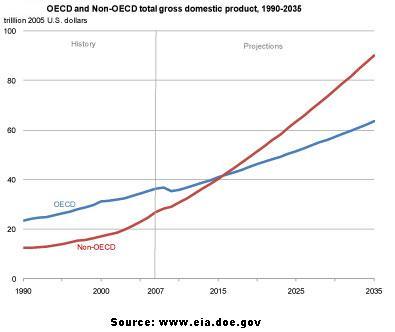
To avoid another great depression, important steps are taken by the United States and China. China has injected around $600 billion in different development and social programs. These development projects are present both in China and abroad. Funds are used for roads, power grids, and irrigation projects, etc. Other Asian non-OECD nations that are trading partners of China also have benefited from these projects. Those Asian countries that were dependent on exports were badly affected by this recession as their exports decreased due to a decline in demand for goods among OECD economies. The recovery process in China boosted its recovery too. Real GDP growth of the world averages around 3.2 percent per year from 2007 to 2035. The world is changing rapidly and in the years to come, the ability to supply quantity and quality of goods will determine the growth potential of a nation’s economy. Different factors including population growth, capital, labor force, and productivity improvement greatly influence the growth potential. For developing nations, establishing regulatory mechanisms, human and physical infrastructure and political stability are also important factors of determining the growth potential.
Let us have a look at current and projected annual GDP growth. The past 30 years show an average annual growth in GDP of about 3.25 percent per year. The projected period of around 28 years shows an average annual growth of 3.23 percent per year. Developed and matured nations show slower GDP growth as compared to developing nations. The combined GDP of OECD countries, which increased by an annual average of 2.9 percent from 1977 to 2007, averages 2.0 percent per year from 2007 to 2035. In contrast, the combined GDP of non-OECD countries, which increased by an annual average of 3.7 percent from 1977 to 2007, averages 4.4 percent per year growth from 2007 to 2035, based in a large part on the strong growth projected for China and India. With non-OECD economies accounting for an increasing share of world GDP, their more rapid economic growth rates offset the slower growth rates for OECD economies in the Projection period.
Price analysis
Price is an important factor in estimating the overall consumption of power. This section sees the current prices concerning the predicted prices of crude oil.
The research shows that solar energy is the most expensive energy. The reason is its high capital and infrastructure costs. Solar energy needs high initial capital. If we look at the prices of PV cells, batteries, and other accessories related to solar power, we can easily come to the point that it is a very expensive energy source. Based on the research, solar energy costs about 30 cents per kilowatt-hour. Although wind energy is the cheapest energy, coal energy, which is slightly expensive than wind energy, is still preferred as building a wind farm is quite expensive.
Crude oil energy costs differ greatly depending on the region and availability of oil in that region. In some regions, it costs unbelievably less and other regions are charging very high rates for electricity. But its capital costs are very low as compared to the solar energy station costs.
Hydro-electricity is another popular form of energy consumed in the world. It has an only capital cost which is building a dam and some energy generator installation. Energy production costs are almost zero. It is long-lasting and environmentally friendly. Governments always prefer this type of energy and build dams wherever possible.
The cost of Coal energy is estimated at 0.03 cents per kwh. Most of the countries, where coal is present in sufficient quantity, are using coal energy to meet their electricity demand. It is one of the cheapest sources of energy. It is not environment friendly but who can leave a cheap source of energy when it is available at such a low cost.
Wind energy provides energy at just 0.025 cents. But as in the case of solar energy, wind energy has high capital costs. Building a wind farm is very expensive. It is only installed where necessary.
By researching the projected prices of energy sources, it is observable that the price of solar power drops considerably. The most affected energy source is solar power. A decrease in its price is causing an increase in its demand. Almost all green energy sources show a decline in their price. By searching past data, it is observed that the prices of green energy sources are declining continuously.
Sensitivity analyses
Alternative Economic Growth cases
Expectations for the future of economic growth rates are a major source of uncertainty in this study. To illustrate the uncertainty associated with trends in economic growth; this study includes a case of strong economic growth and a low economic growth case beyond the thesis. The two alternative growth cases use different assumptions about the future paths of economic growth while maintaining the same relationship between changes in GDP and changes in the energy used in research.
In the case of high economic growth, 0.5 percentage points added to the projected annual growth rate for each country or group of countries in this research. In cases of low economic growth is 0.5 percentage points subtracted from the annual growth rate of this study. This study shows the total energy consumption in the world to reach 739 quadrillions Btu in 2035 to 281 quadrillion Btu in OECD countries and 458 quadrillion Btu in non-OECD countries. We can see in the case of high levels of growth in world energy consumption in quadrillion Btu in 2035 from 810 to 71 quadrillion Btu (about 35 million barrels of oil equivalent per day) than in the case of lower growth. In this case the total energy consumption in the world quadrillion Btu in 2035 60 (30 million barrels of oil equivalent per day) lower than the case of contention. Thus, the projections for 2035 in the case of high and low economic growth covering a range of uncertainty, equivalent to 134 quadrillions Btu.
Alternative Oil Price cases
The assumptions on oil prices are another important factor that stresses the considerable uncertainty in projections of the long-term energy market. The effects of different assumptions about future oil prices are illustrated at these two case studies’ alternative prices of oil. In a case of high oil prices, world prices of oil (REAL 2008 dollars) to climb from $ 59 per barrel in 2009, $ 210 per barrel in 2035, and the case of low oil prices, to fall to $ 52 barrel in 2015 and still around to that real level of 2035. In comparison, world oil prices would go up to $ 133 a barrel in 2035 due to the thesis. In these three cases, the oil prices are the same as EIA’s Annual Energy Outlook 2010.
Although the difference in world oil prices between the case of high oil prices and low is considerable, the projections of total world energy consumption in 2035 were not significantly different between the cases. The projections for world energy use in 2035 in cases of high and low prices of oil are separated by 33 trillion BTUs, as against the difference of 134 quadrillions Btu between the high and low for economic growth.
The most significant impacts of the assumptions of high and low oil prices on the fuel mix consumed energy in each region, particularly fossil fuels. In the case of oil prices in the world total consumption of liquid in 2030 about 31 quadrillions Btu lower (about 15 million barrels of oil equivalent per day), coal consumption in 2035 is 7 quadrillions Btu increased consumption of natural gas is 5 quadrillions Btu higher, and the use of renewable energy is 2 quadrillions Btu higher than expected in the case of the thesis. The difference in nuclear volumes between the two cases is small.
In this case, world oil prices began to rise after 2009 and reach $ 133 a barrel by 2035. As a result, the consumption of liquids is limited to countries that are other alternative fuels, particularly in the electricity sector. Fuel usage throughout the world for the production of electricity is 1.5 quadrillion Btu in the 2007-2035 forecast period.
The case of low oil prices and consumption have increased demands for fuel consumption for transportation, with lower incentives towards fuels of alternative power sources around regions wherein alternative fuel is more easily obtainable (eg, electricity). Estimations show that the gross consumption of liquids will reach 25 quadrillions Btu in 2030 as compared to cheap oil for the predicted period. This prediction will certainly reflect increased demand in all sectors of fuel usage. Gately (1984) states that “the case of low oil prices shows the industrial sector, the largest increase in fluid intake (7 million barrels per day) in 2035 compared to the projection period, followed by Transport (3 million barrels per day) and the Electricity Sector (2 million barrels per day)” (Gately, 1984).
Investing in Alternative Energy
The past three years depicted unpredictable alternative sources of energy since there are returns of about 100 percent in excess in 2007. It went down to 90 percent in 2008 and went as high as more than 100 percent in 2009. Generally, wind energy, solar energy as well as hybrid electric cars are becoming substitutes for energy investments. This renewable energy derived from alternative sources can be obtained for free and has fewer carbon emissions. These sources use different technology and the main issue to apply these sources are funding and investments.
Taking photovoltaic solar energy as a sample, the energy derived is from the semiconductor. It is perhaps the only energy in which the electric generation cost can be reduced to at least 50 percent for the next 5 years. Advance thin solar cells are also another example that might help the industries to reduce energy costs.
PV electricity is dependent on the prices of silicon. Even those companies that depend on these technologies’ are affected by the supply-demand of the silicon market. A few firms as well those entering the completed solar cells in the open market, companies who want to produce solar modules create barriers.
Wind power technology has been used for more than a century and is highly reliable. Its economic structures are based on the cost of steel as it is the component for the wind turbines. Current wind turbines are usually more than 100 meters high and the logistics as well as its global manufacturing factors are among the competitive advantage of this technology.
Research Methodology
This work will only use secondary data, from online journals, Scholarly electronic databases, Electronic books, Industry publications, and published reports from diverse sources.
The research will be divided into four sections to cover the research questions as sub-topics. The first question which is on Energy market interactions and Changes will be answered by looking at how much the globe has been and is expected to spend on exploration and development of crude oil reserves activities about the spend on research and development of alternative energy. This section uses the Michael Wunder oil market modeling using Q learning. This research also looks at different sectors and their relative crude oil usage and projected demand. This section includes a conclusion of the British Petroleum research on renewable energy sources. The research will try to figure out the change in demand for crude oil in the future as compared to alternative energy sources
The second section is on Speculators and producer behavior within the oil market. It will be answered by looking at how much the globe has been and is expected to spend on exploration and development of crude oil reserves activities about the spend on research and development to alternative energy. The objective in the second part is showing that the drive for political will to move to alternative energy will not just affect supply and demand but will change the balance of power and end the speculative nature of oil trading. Even in the case of immerging economies rising demand, the disappearance of OPEC power and end of speculative activities on oil trading means the price of oil could fall more than the contribution that alternative energy will add to the supply. This research will attempt to figure out the deferential in oil prices due to OPEC and speculative activities. The research will use conclusions of different theories and studies analyzing the behavior of OPEC during recent decades. It will use Dermot Gately’s theoretical approach based on wealth maximization. This research employs the “Energy Information Administration’s (IEA) Oil Market Simulation model” (Gately, 1995) for best assessing the capability of a target-capacity principle for meeting the OPEC’s economic goals. The research then looks at Kawai’s Three-agent model and Kamilah Williams’s work. This study takes into account the three views in predicting the direction of oil price fluctuations.
The third section explains the energy usage in different sectors of the world. It divides the world into two categories of nations, namely, the OECD and the non-OECD, and statistically discusses the demand for energy consumption. It looks further at China and India as major energy consumers and compares it with other regions.
The fourth and final section is on Global political will and pace in the development of alternative energy. It will be answered by highlighting the global political will to reduce the dependence on oil. There is a determination worldwide for economic reasons to find and develop alternative energy sources and technologies. This section will also use observation-based research by looking at the data to see if crude oil production will go down and what alternative energy contributes to total global energy output year on year in the past decade. Therefore in this section, the resulting theory will be grounded in observation. The research uses statistical and graphical data to analyze the will and pace in the development of alternative energy. The research is further divided into OECD and non-OECD countries and also into different sectors. It looks at the crude oil from different angles to show its current and future demand. It looks at energy usage in the residential, commercial, industrial, and transportation sectors. The research will explain in detail the rise and fall in demand, consumption, and cost of crude oil as compared to its alternatives.
Discussion and Analysis
In this study, we discussed crude oil and alternative energy consumption. This dissertation discusses the increasing demand for alternative energy sources and compares it with crude oil consumption demand. Price is a key element in estimating the amount of consumption of energy. This section focuses on the current prices versus the predicted prices of power, directly relevant to our research. Crude oil is the most demanded energy-producing commodity. With time, its consumption is increasing.
For the past three years, alternative sources of energy have been unpredictable as there are returns of about 100 percent in excess in 2007. It went down to 90 percent in 2008 and went as high as more than 100 percent in 2009. Generally, different forms of energy sources such as solar, wind, hybrid, and hybrid electric vehicles are becoming favorites in alternative power investments. This renewable energy derived from alternative sources can be obtained for free and has fewer carbon emissions. These sources use different technology and the main issue to apply these sources are funding and investments.
The growth in the population and economy affects energy consumption. As the population increases, health, education, financial, and other government services demands also increases. This economic growth should be met depending on available socio-economic/financial resources or from local or foreign sources.
Concerns about the future of nuclear power have become controversial that most nations are having doubts about the security and safety of the plant. These issues reduce the development and growth of nuclear power plants as the issues about plant security, radioactive waste disposal, and nuclear material proliferation are elevated at the community level that may affect numerous communities. These also impede the development of various programs as well as the generation of funds for the upkeep and maintenance expenses of the plant. These may perhaps retain few nations from expanding projects and programs in improving their nuclear plants.
If one has to take a closer look at the generation of electricity, one can conclude that the largest share in the electricity generation is provided by coal. In 2007, 42 percent of the total generation comes from coal and it is unlikely to change until the year 2035. On the other hand, crude oil, natural gas, and nuclear energy have been deprived of significant market share in global power generation, across the period of projection, which is influenced by the rapidly growing estimations for renewable resources of production. It can be considered that renewable generation is growing at an annual rate of 3.0 percent. It becomes the major source of electric power in comparison to other sources like coal, natural & nuclear power each at 2.3 percent, 2.1 percent, and 2.0 percent respectively. The construction of the renewable energy source generation facilities was supported around the globe. It is somehow evident in the policies and incentives issued by the government.
Empirical findings
Crude oil will remain the biggest source of energy but its share in the world marketed energy consumption will continue to decline each year. Statistics show that crude oil energy consumption will come down to 30 percent in 2035 which was 35 percent in 2007.
By researching the projected prices of energy sources, one must note that the price of solar power declines to a great extent. And the most affected energy resource is solar power. A decrease in its price is causing an increase in its demand. Almost all green energy sources show a decline in their price. By searching past data, it is observed that the prices of green energy sources are declining continuously.
Natural gas remains a major fuel source for the production of electricity globally. Electricity generation is much more cheap using natural gas as against crude oil, and plants the use natural gas in energy production need to require less capital as compared to plants that employ coal, or nuclear energy, or other forms of renewable energy. Further, the average consumption of natural gas in the world grows by a rate of 1.3 percent on an average annually. In 2007 it was 108 trillion cubic feet which will cross 150 trillion cubic feet by 2035. In the electric power sectors, its usage will shoot up by a rate of 1.6 percent on an average per year.
The past three years saw alternative sources of energy been unpredictable as there are returns of about 100 percent in excess in 2007. It went down to 90 percent in 2008 and went as high as more than 100 percent in 2009. Generally, wind energy, solar energy, and hybrid electric vehicles are becoming alternative energy investments. This renewable energy derived from alternative sources can be obtained for free and has fewer carbon emissions. These sources use different technology and the main issue to apply these sources are funding and investments.
Conclusions and Recommendations
This study concludes that crude oil is by far the primarily demanded power source. Also, it will remain most demanded until its reservoir ends. The demand for crude oil consumption, in the previous years, remained high except for the recession period. It will continue to increase in the future. The sector, in which there is the highest demand for crude oil, is the transportation sector. However, fewer numbers of feasible alternatives to crude oil are seen in the transportation sector. Coal, natural gas, solar, hydroelectricity, and wind power are the best alternatives available to crude oil. The rate of increase in demand for these alternatives is higher as compared to crude oil. Governments are encouraging investments in alternatives. Alternatives to crude oil are now getting increasingly political support.
This study concludes that OPEC behavior is justifiable if the demand and supply rule is applied to the crude oil market. But this study criticizes OPEC behavior because of anti-welfare policies.
This study further analyzes the alternatives and concludes that renewable (green energy) is popular as compared to fossil fuels. But high installation and capital costs restrict their demand. Price is an important factor in choosing the alternative to crude oil. This study concludes that coal and natural gas, due to lower cost, will remain at the top, after crude oil, in the list of energy demand and energy consumption.
There may still be a lot of uncertain decisions that OPEC is making. The development through dynamic optimization as suggested by various countries under OPEB may see to act in different ways. The market sharing theory may not be suitable. Algeria, Kuwait, Nigeria, Saudi Arabia, and Venezuela may have behaved not observing the strict cartel theory. These nations, excluding Algeria, may have lead to the qualification of these nations among the great producers of than those who observed the strict cartel theory. Economic theories may recommend that the producers of the natural resource should be optimized and must be modeled under the OPEC framework. Although these models used for forecasting the result are being questioned, it is still appealing as it provides the benchmark for the optimization of the behaviors. OPEC can still optimize its models and may provide policies to the key players to control the market.
Findings show that individual OPEC nations show extreme behaviors in terms of the inappropriate trust hypothesis. None of our specifications present any pieces of evidence of dynamic optimization or a powerful framework for target revenue. A few may prove that Iran, Libya, KSA, and the U.A.E. may have included their form of revenue targets as part of their goals. The behavior of Iraq is very consistent as its competitive market structure is static. That static non-competitive market structure is not accepted in Algeria as these may have been declared in the policy of the Algerian government. In conclusion, as the behavior of OPEC countries is different, OPEC must focus on the non-competitive swing of produces rather than focus on policies and theories that are weak.
The lag testing may recommend any short-term decision processes made by OPEC. Lag testing may suggest adjustment as there are many variables and values preferred. Among the two cases, the lags add information to estimate the equation in the interest rate of Iraq along with the buyer revenue equation within Kuwait.
Observing the behavior of each OPEC country, we can conclude that they act in different ways. Some may have thought that the cartel theory is no longer suitable. Under the various conditions, the evidence of dynamic optimization is not shown or not strongly visible in the target revenue model.
There may be a few proofs that oil multination companies can optimize since the production of the majority of sources of energy is in Iran, Libya, and Saudi Arabia as evident in their form of targeted incomes. Although there are tests conducted formally to target the income model was not accepted, those who forecast should take note that investments are still an important part of the program. It is the most important of all.
Personal Reflection
In my opinion, the world should change faster. Changing from Crude oil to alternative energy sources is needed. The world needs to invest more in renewable energy sources. If there is a fight against all energy resources, crude oil will be the champion. The crude oil may have a victorious fight with other alternative sources of energy. Alternative energy may have a better chance only if it will be able to survive the first round. Today, the fuel that comes from fossil is the major source of energy although they appear to be harmful to the environment. These fuels have caused the change in temperature of the planet and have a major impact on climate changes as it dramatically changes the weather of various cities. Fossil fuels are scarce as there are difficulties in extraction. These energy sources take a long time to reproduce, the formation of these fossil fuels takes about millions of years. Regardless of its negative effect, it remains the major source of energy even if there is a great demand and is difficult to resolve in the future.
The increase in crude oil prices cannot be stopped as we try to look for other sources of energy that are available every day. The amount may however vary from the fact the sun, wind as well as running water are always available and are affordable sources of energy. Converting these alternative sources to electricity will not result in further damaging the environment. It has no negative effects that might harm the planet. Using these alternative sources, one can assure that we are on the right path to preserving the planet.
If we are to take a closer look at the fight between crude oil and the alternative sources of energy, the crude oil can hit heavier but the stamina to fight until the last round will not last. Alternative sources of energy may hit lighter but the stamina can sustain the fight until it finishes the last round. It is important to learn the advantages and disadvantages of these two sources of energy so that you will know where to put your investment for the next champ.
References
Andreas Goldthau and Jan Martin Witte, (2010) Global Energy Governance: The New Rules of the Game, Global Public Policy Institute, Berlin.
Ayed Al-Qahtani, Edward Balistreri, Carol Dahl (2008) Literature Review on Oil Market Modelling and OPEC’s Behaviour Division of Economics and Business, Colorado School of Mines, Golden Co. – 2008.
Chinn, M., Leblanc, M. and Coibion O., (2001), “The Predictive Characteristics of Energy Futures: Recent Evidence for Crude Oil, Natural Gas, Gasoline and Heating Oil”, UCSC Economics Working Paper.
Deés, S., Karadeloglou, P, Kaufmann R., Sánchez, M, (2004), “Modelling the World Oil Market: Assessment of a Quarterly Econometric Model”. International Conference on Policy Modelling Working Paper.
Kamilah Williams (2008) the International Oil Market: An Application of the Three-Agent Model, International Economics Department, Bank of Jamaica.
Kaufmann, Robert, (2004), “Does OPEC Matter? An Econometric Analysis of Oil Prices”, The Energy Journal.
Kawai, Masahiro, (1983), “Price Volatility of Storable Commodities under Rational Expectations in Spot and Futures Markets”, International Economic Review.
Krichene, Noureddine, (2007), “An Oil and Gas Model”, IMF Working Paper.
Michael Wunder, Oil Market Modelling Using Q-Learning. Web.
Molchanov, Pavel, (2003) Investment Strategy for Alternative Energy Stocks, Raymond James, and Associates.
Thurman, W. N., (1988), “Speculative Carryover: An Empirical Examination of the U.S. Refined Copper Market,”, RAND Journal of Economics.
Adelman, M. A. , (1986), “Oil producing Countries Discount Rates”, Resources and Energy, 8:309-329.
Adelman, M. A. and Shahi, M., (1989), “Oil development-operating cost estimates, 1955-85”, Energy Economics, 11(1):2-10.
Cremer, J. and Weitzman, M. L. (1976), “OPEC and monopoly price of world oil”, European Economic Review
Cremer, J. and Salehi-Isfahani, D., (1980), “A Competitive Theory Of The Oil Market: What Does OPEC Really DO?”, mimeo.
Cremer, L. and Salehi-Isfahani, D., (1989), “The rise and fall of oil prices: a competitive view”, Annales d’Economie et de Statistiuue
Dahl, Carol A. and Yucel, Mine, (1988), “OPEC market behaviour”, in Competition, Profitability and Policy in the Energy Industries, Proceedings of the 10th Annual North American Meeting of the International Association for Energy Economics, Houston, TX.
Fischer, D.; Gately, D.; and Kyle, J. F., (1975), “The prospects for OPEC: a critical survey of models of the world oil market”, Journal of Development Economics.
Gately, Dermot, (1984), “A ten-year retrospective: OPEC and the world oil market”, Journal of Economic Literature XXII.
Griffin, James M., (1985), “OPEC behaviour : a test of alternative hypothesis,” American Economic Review.
Hammoudeh, Shawkat, (1979), “The future of oil price behaviour of OPEC and Saudi Arabia: a survey of optimization models”. Energy Economics.
Hnyilicza, E. and Pindyck, R. S., (1976), “Pricing policies: a two-part exhaustible resource cartel”, EuroDean Economic Review.
International Monetary Fund, International Financial Statistics, Washington, D.C., various issues.
Kalymon, B. A., (1975), “Economic incentives in OPEC oil pricing”, Journal of Development Economics.
Nesbitt, Dale M. and Choi, Thomas Y. (1988), “Is an oil tariff justified? An American debate: 11.- The ‘numbers say no,” Energy Journal.
Nordhaus, William D., (1973), “The allocation of energy resources.” Brookinas Papers on Economic Activity, 3: 529-570.
Oil and Gas Journal, Pennwell Pub.
Organization of Petroleum Exporting Countries, Annual Statistical Bulletin, Vienna, Austria, various issues.
Adelman, M. (1976), ‘The World Oil Cartel: Scarcity Economics, and Politics’, Quarterly Review of Economics & Business. Also, in. The Economics of Petroleum Supply”, papers by M. Adelman 1962-1993, M.
Adelman (1993). The MIT Press. Adelman, M. (1982), ‘OPEC as a Cartel’, In J. M. Griffin and D.J. Teece, OPEC Behaviour and World Oil Prices, London: George Allen & Unwin, pp.37-63.
Adelman, M. (1986), ‘Oil Producing Countries’ Discount Rates’, Resources and Energy 8: pp. 309-329.
Adelman 1962-1993, The MIT Press. Cambridge, Mass. US.
Adelman, M. (1995), The Genie out of the Bottle. World Oil since 1970, The MIT Press. Cambridge, Mass. US.
Al-Moneef, M. (1987), ‘Falling Oil Prices: Causes Instruments and Consequences’, Presented in Kuwait University (In Arabic).
Al-Roomy, N. (1987), ‘A Model of Crude Oil Pricing and the Interaction Between OPEC, the UK and Mexico’, Unpublished Doctoral Dissertation, University of Southampton, England.
Al-Turki, S. (1994), ‘Autocorrelation in Static Economic Models and their Dynamic Respecifications: an Application to OPEC Behaviour’, Journal of King Saud University, Administrative Sciences.
Al-Yousef, N. (1994), ‘Modelling OPEC Behaviour: an Econometric Analysis’, Unpublished Masters Thesis, King Saud University. Riyadh.
Askari, H. (1990), Saudi Arabia’s Economy: Oil and the Reach for Economic Development, JAI Press, Greenwich, CT.
Askari, H. (1991), Saudi Arabia’s Oil Policy: Its Motivations and Impact, In Wilfride Kohl After the Oil Collapse. OPEC the United States and the World Oil Market, John Hopkins University Press.
Cremer, J. and Salehi-Isfahani, D. (1980), ‘Competitive Pricing in the Oil Market: How Important is OPEC?’, Working Paper, University of Pennsylvania, Phil.
Adelman, M. (1986), ‘The Competitive Floor to Oil Prices’, The Energy Journal.
Adelman, M. (1992), ‘Modelling World Oil Supply’, The Energy Journal.
Griffin, J. (1985), ‘OPEC Behaviour: A Test of Alternative Hypotheses’, American Economic Review.
Griffin, J. and Jones (1986), ‘Falling Oil prices where is the Floor?’, The Energy Journal, 7(4): PP.
Griffin, J. and Teece, M. (1982), OPEC Behaviour and World Oil Prices, London: George Allen and Unwin.
Griffin, J. and Neilson (1994), ‘The 1985-86 Oil Price Collapse and Afterwards’, Economic Inquiry.
Gulen, G. (1996), ‘Is OPEC a Cartel ? Evidence from Cointegration and Causality Tests’, The Energy Journal.
Hartshorn, J. (1993), Oil Trade Politics and Prospects, Cambridge: Cambridge University Press.
Adelman, M.. (1993), The Economics of Petroleum Supply, Papers by M.A.
Cremer, J. and Salehi-Isfahani, D. (1991),Models of the Oil Market, UK: Hardwood Academic Publishers.
Gately, D. (1995), ‘Strategies for OPEC’s Pricing and Output Decisions’, The Energy Journal.
Geroski, P. Ulph, A. and Ulph, D. (1987), ‘Model of the Crude Oil Market in which Market Conduct Varies’, Economic Journal.
Gilbert, R. (1978), ‘Dominant Firm Pricing in a Market for an Exhaustible Resource’, The Bell Journal of Economics.
Golub, D. (1985), When Oil and Politics Mix Saudi Oil Policy, 1973-1985, Centre For Middle Eastern Studies. Harvard University.
Cremer, J. and Weitzman, M. (1976), ‘OPEC and the Monopoly Price of World Oil’, European Economic Review.
Dahl, C. and Yucel, M. (1991), ‘Testing Alternative Hypotheses of Oil Producer Behaviour’, Energy Journal.
Dasgupta, P. and Heal, G. (1979), The Economic Theory of Exhaustible Resources, Cambridge University Press.
Doran, C. (1977), Myth, Oil, and Politics: Introduction to the Political Economy of Petroleum, New York: The Free Press.
.Ezzati, A. (1976), ‘Future OPEC Price and Production Strategies as Affected by its Capacity to Absorb Oil Revenues’, European Economic Review.
Ezzati, A. (1978), World Energy Markets and OPEC Stability, Cambridge, Mass: Lexington Books.
Fisher, A. (1981), Resource and Environmental Economics,: Cambridge Surveys of Economic Literature, Cambridge University Press.
Gately, D. (1983), ‘OPEC: Retrospective and Prospects 1973-1990’, European Economic Review.
Gately, D. (1984), ‘A Ten-Year Retrospective: OPEC and the World Oil Market’, Journal of Economic Literature.
Griffin, J. and Steel, H. (1980), Energy Economics and Policy, New York: Academic Press.
Hotelling, H. (1931), ‘The Economics of Exhaustible Resources’, The Journal of Political Economy.
Johany, A. (1978), ‘OPEC not a Cartel. The Property Rights Explanation of the Rise in Crude Oil Prices’, Unpublished Doctoral Dissertation, U.C.
Santa Barbara. Johany, A. (1980), The Myth of the OPEC Cartel The Role of Saudi Arabia, New York: John Wiley and sons.