Abstract
The experiment is aimed at determining the heat transfer rates in a hot jet. The reasons for the hot jet to have different heat rates in different areas will be determined. The experiment has shown that, due to convection issues caused by impingement, heat conduction did not occur properly. The experiment returned the flow readings that were in a direct proportion to the power of the heat gun.
Nomenclature
- Z – confidence coefficient
- Α – confidence level
- Ρ – standard deviation
- n – the number of samples
- T – temperature.
Introduction
A thermocouple is traditionally defined as a device producing voltage if the temperatures at its contact points are different. A thermopile, in its turn, is a set of several thermocouples. The former works as a means of measuring temperature. The latter transfers thermal energy to an electric one.
The phenomenon of heat transfer, which will be observed in this experiment, is typically identified as the transfer of thermal energy. As a rule, three types of heat transfer can be found. These include conduction, which occurs in solids, convection, which can be observed in liquids, and radiation, which exists in gaseous substances.
The phenomenon of convection, which was mentioned above, may exist as forced and free. Forced convection presupposes that the motion of liquid is triggered mechanically, whereas, in free convection, it occurs naturally. In the experiment carried out below, forced convection can be observed.
Experimental Setup and Procedure
To carry out the experiment, one had to deploy the following equipment: FieldPoint FP-TC 1200 Thermocouple, FP-TB-10 Terminal Base, and FP-1000 Network Interface. Prior to using the equipment in question, it was inspected carefully for any possible flaws.
Results and Discussion
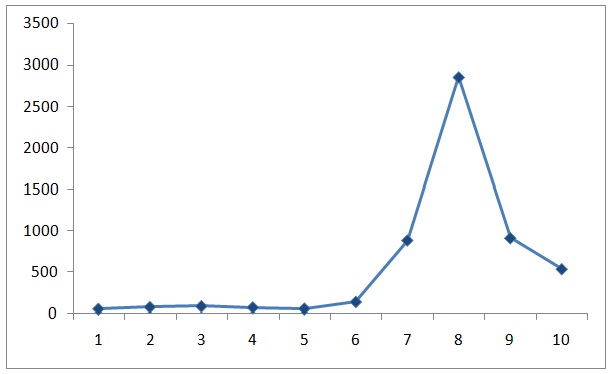
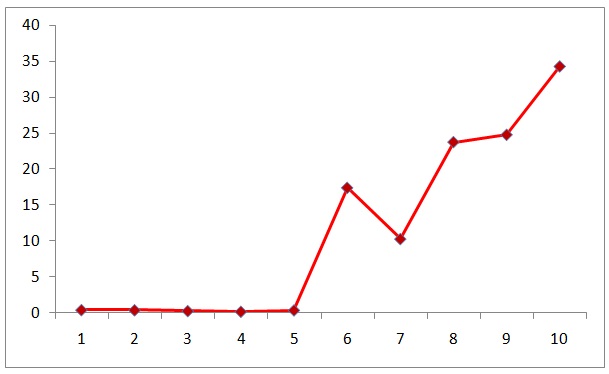
As the charts provided above show, the increase in the power of the heat gun affected the temperature rates directly. First and most obvious, the fact that the standard deviation of the data is comparatively low deserves to be mentioned as the results of the experiment show, the standard deviation of the heart rates changes in accordance with the alterations of the heat gun power.
It is also worth noting that the changes in the heat intensity are in a direct correlation to the time spent on the heating process. In other words, the longer the target object of research was under the impact of the heat, the higher the temperature grew. Likewise, a drop in the heat flow affected the temperature rates instantly by leading to a rapid drop. The charts above indicate that the heat transfer in a hot jet is related directly to the heat flow and the power of the heat gun. The frequency-domain information was collected from the signals released by the thermocouple.
The confidence interval can be calculated with the help of the following formula:
x ≠ (Z⋅α⋅ρ)/ 2√n.
The standard error is 17.9519. Therefore, the confidence interval equals
17.9519⋅1.96⋅0.95⋅11.22/ 2⋅√1004 = 5.93.
The steadiness of the surface was determined with the help of the analysis of temperature rates retrieved with the help of a thermocouple. Since the measurement of temperature was carried out several times and the mean was determined, the steadiness rates were approximated.
The uniform conditions in which the experiment was carried out allowed for a direct correlation between the heat flux rates and the temperature indices. The fact that the specified variables were plotted on one side of the chart only allows for an assumption that the experiment was carried out in a proper manner and delivered accurate results. The factors such as unique experiment conditions, however, would mean that the experiment was not conducted in a proper way and, therefore, its outcomes are questionable.
In addition, moving the heat gun closer would trigger an increase in temperature rates, whereas taking it further away would result in temperature rates drop. The heat-flux distribution would have been less even in the former case and more even in the latter.
A change in the type of sheet would have affected the conductivity of heat. For instance, by switching to the use of a Teflon sheet, which has conductivity rates of 0.25, one would have slowed down the process of heat transfer. The use of stainless steel (16), on the contrary, would have speeded it up. Copper is traditionally viewed as a material with very low (401) heat conduction rates.
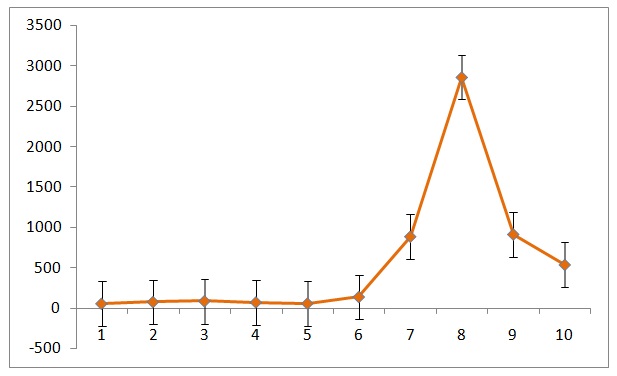
It should also be borne in mind that a certain level of data uncertainty existed in the specified experiment. As the graph provided below displays, the uncertainty rates were tolerable, therefore, allowing for a generalization.
Conclusion
The results of the experiment have shown that heat transfer and properties such as conduction, convection, and radiation. The charts also display that the power of the heating gun affects the temperature of the low-speed hot jet impinging. Specifically, the data acquired in the course of the study indicates that the impinging of the jet affects the heat flow direction.
Reference List
Figliola, R.S., and Beasley, D.E., Theory and design for mechanical measurements (5th ed.), Wiley, New York City.
Thermal conductivity of some common materials and gases, 2015, Web.