Introduction
In the construction and building environment, the real estate sector has tremendously impacted the lives of US occupants. This sector deals with homes as property needed by every individual ready to pay for ownership fees and maintenance expenses. As a result, the fluctuation of housing prices within the US region has been hotly debated because it affects the national economy and the lives of residents (Jafari & Akhavian, 2019). Statistical techniques such as testing for the hypothesis can predict the driving forces of housing prices in real-estate decision-making across various regions of the US.
The current analysis is focused on New England and its real estate data, as obtained from Realtor Database. New England contains various states, including Maine (MA), Connecticut (CT), Vermont (VT), Massachusetts (ME), Rhode Island (RI), and New Hampshire (NH). Using data for two states (i.e., CT and MA) within New England and a sample size of 500, the analyst sought to determine whether real estate prices fluctuate at a 95% level of significance (i.e., α=0.05) and infer the findings to the entire states within the US. In particular, the means one variable, namely housing listing prices, compared between CT and MA. Table 1 displays the mean and standard deviations for the two variables used in the hypothetical test.
Table 1: Descriptive Statistics for the Selected Variables.
One Tail Test
For one tail test, the critical area of a distribution is one-sided. The hypothetical statement can be expressed as the mean house listing price in CT being greater than that in MA. Using A and B to denote mean house listing prices in CT and MA, the one-tail test hypotheses are expressed below. In the expression ![]() and
and ![]() denote null and alternative hypotheses, respectively. In the test for hypotheses, t-statistics is used because the sample size is greater than 30.
denote null and alternative hypotheses, respectively. In the test for hypotheses, t-statistics is used because the sample size is greater than 30.
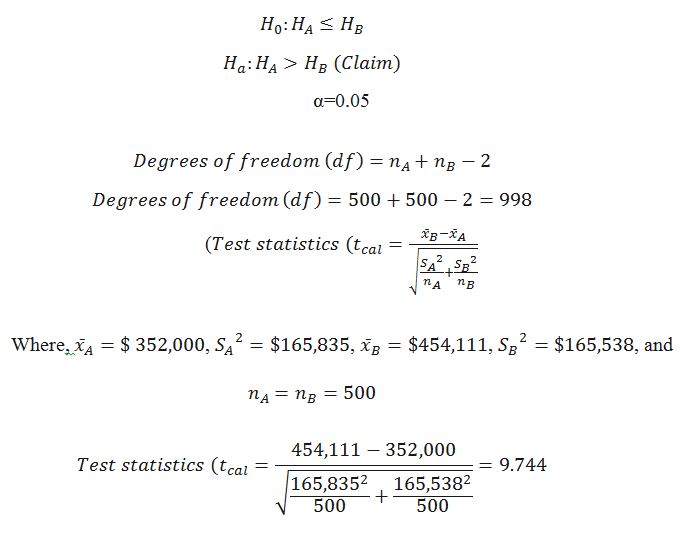
Feeding test statistics, one tail test, degrees of freedom, and α=0.05 in the p-value calculator from socscistatistics.com yielded a probability that is less than 0.05 (i.e., The p-value is <.00001). We reject the claim because there is no sufficient statistical evidence at a 95% significance level to show that the mean house listing price in MA is greater than that of CT.
Two Tail Test
In two-tail tests, analysts are driven to introspect whether the means for two different samples are equal. The mean house listing prices for CT and MA are marked as A and B. Symbolic expressions of the hypotheses are expressed below.
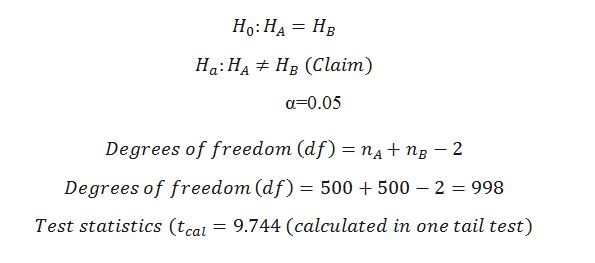
By feeding test statistics, degrees of freedom, two-tail test, and α=0.05 in the p-value calculator from socscistatistics.com, we obtain a probability that is less than 0.05 (i.e., The p-value is <.00001). We reject the claim because there is no sufficient statistical evidence at a 95% significance level to show that the mean house listing price in MA is not equal to that in CT.
Conclusion
One tail test proves that mean house listing prices in MA are not greater than in CT. Moreover, the average house listing price in MA does not differ significantly from one in CT. The results of the two tests affirm that housing prices do not fluctuate depending on the region. Simply put, the region is not a factor with a massive influence on house listing prices across all the states within the US.
References
Jafari, A., & Akhavian, R. (2019). Driving forces for the US residential housing price: a predictive analysis. Built Environment Project and Asset Management, 9(4), 515-529. Web.
Quick P value from T score calculator. (n.d.). Social Science Statistics. Web.
Realtor.com real estate data and market trends for download. (n.d.). Realtor.com Economic Research. Web.