Introduction
The transportation infrastructure is important since it leads to economic growth of countries in the world. It is believed that in the 19th century investments the transportation systems such as the roads, railways, and canals stimulated economic development in the United States of America. There have been the propounded changes that have been brought about by the Interstate Highway System in the United States of America and the Trans-Canada highway in Canada. The transportation infrastructure has expanded the range over which goods are marketed in the world. It has made production and distribution process to be more efficient, it has created opportunities for economies of scale and increased specialization, changed logistic systems and reduced costs all these factors lead to the economic productivity of a country.
The Federal Reserve System is the system that offers banking services to the customers of the United States of America. It was created in 1913 by the board of directors under the federal Reserves Act whose aim was to provide the nation with safer more flexible and more stable monetary and financial services to the residents of the country. The Federal Reserve System is headed by seven members who are appointed by the president that are confirmed by the senate of the country to run the affairs of the banking system. The roles of the Federal Reserves Systems is to conduct the nation’s monetary policy so as to help maintain, keep prices stable and to keep the interests rate as low as possible. It also supervises and regulates the banking institution so that they can provide secure safe places for people to keep their money and also to protect the customers’ credit rights so that they can not be exploited by the management of the banks. The Federal Reserve System has the responsibility of providing financial services to the depository institutions, the United States government and foreign central banks, processes electronic payments and it distributes coin and paper money to the nation’s banks, credit unions, and savings and loan association as well as the saving banks so that they can carry out their activities effectively and efficiently.
According to the United States Department of transportation (DOT) the annual investment of $82.3 billion is necessary to improve the current transportation system and to sustain it to the present level the government spends over $55.4 billion annually, but according to the government statistics, the current level of investment is $9 billion less than the subsistence cost and $36 billion is less than what is required to make significant safety, mobility and physical improvements. The current status of investment in the transportation by United States economy is much less than the required level and an expansion is imperative to maintain the safety and the standard of economic life of the country.
The investment in transportation infrastructure can increase the productivity of a region both by increasing resources and by enhancing productivity of the existing resources. The benefits of the investing in the transportation infrastructure are that it can enter into the production process as an input and other cases as an unpaid factors for instance the transportation services that is the highways, the infrastructure also makes other existing inputs more productive and this is achieved through well constructed highways that reduces the transportation time that enhances the reduction of total cost of production of the private companies. It may also act as a stimulus to economic growth of a particular region by attracting resources from other regions of a country.
The transportation infrastructure can contribute to the economic output of a country and hence can change the Aggregate Demand Curve. The transportation construction process increases the demand for the intermediate inputs from the different sectors and it stimulates multiplier effect in the economy. The public expenditure can also influence the output of a company by crowding in or out private inputs such as the labor and private capital. The increase of public infrastructure spending attracts private investments, but this depends on the nature of the relationship that exists between the private and public input that is whether they are complementing or they are substitutes.
Short term
The increase of transportation investment has an effect on the Aggregate Demand (AD) that is due to the change in public investment policy. The investment financed through taxes and public borrowings can affect the fiscal policy. The Keynesian theory is used to explain how an expansion in the transportation infrastructure can affect the Aggregate Demand (AD) and the Aggregate supply (AS) in both the short run and in the long run. The Keynesian theory states that an expansion of the public expenditure on transportation has an expansionary effect on the public demand that gives rise to an increase to the output, employment and income as well as the taxes that are levied on the income that is generated. The negative effect of transportation investment is that it may raise the interest rates and inflation that occur due to an increase in the public investment on transportation and the negative impacts may outweigh the positive impacts.
The increase in price has a negative effect on the trade balance and also on the Aggregate Demand (AD) curve and the rise of the interest rates has a crowding effect on the private investments by increasing the private consumption.
Long term effect
The transportation infrastructure from the new point of demand provides a skewed analysis. The transportation investment also affects the Aggregate Supply (AS) in the long-run that results to an improvement of productivity of the factors of production it also leads to increased private investment. The increase in the economic output and the reduction of cost offsets the inflationary effect of the Aggregate Demand (AD).The expansion of the transportation system in an economy in the long run affects both the Aggregate Demand (AD) and the Aggregate Supply (AS).
Neo-classical theory
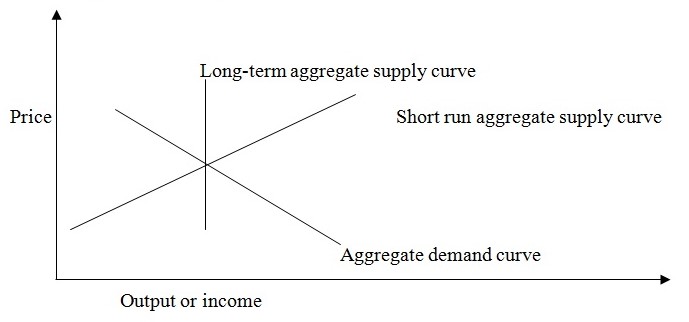
The theory states that in the long run the equilibrium national income is determined by the Long-Run Aggregate Supply Curve (LRAS). The Neo-classical production function or the Long-Run Aggregate supply curve can be shown as Y=f (K, L) for LRAS, where Y is production, L is labor and K is capital and LRAS is the Long-Run Aggregate Supply. As capital (K) or labor (L) rises the Long-Run Aggregate Supply (LRAS) shifts to the right and the production function that shows the maximum potential level of income moves to the right.
The Keynesian theory suggests that in the long-run the increase in transportation investment it creates a positive expectation in the economy that results in the shift of the Aggregate Supply curve to the left. According to the Keynesian theory the Aggregate Supply Curve in the long-run is vertical while in the Short-Run the Aggregate Supply Curve slopes upwards. The Long-Run Aggregate supply curve shifts to the left where an increased demand for labor or capital. The increased transport investment of the government led to the increased demand for labor and capital due to the increased public infrastructure building that led to increased productivity and this led to the leftward shift of the Aggregate Supply Curve in the long run.In the short run the aggregate supply curve remained unaffected by the increase of the transportation investment, but in the long run it was affected by the increase infrastructural investment and it led to the increased productivity as well as the increased efficiency of the private sector.
The introduction of transportation led to the increased road network between regions in the country and this improved the supply chain and it opened the new channels for business opportunities since the producers in the country could transport their goods and services from one place to another with ease and this resulted to the shifting of the Long Run Aggregate Supply Curve to the left side.
The monetary policy has an effect on the real economy in the short run because the changes in the official interest rates are followed by the banks and the financial intermediary’s decisions to change their interest rates. According to the Keynesian postulate the supply of money can be reduced by raising the level of interest rates of money that is borrowed from the financial institutions. When the demand for loans increases the financial institutions increases also increases the interest rate, the government also increases the interest rates on the money it disburses to the financial institutions so that the supply of money can not be more than the demand for money in the country and this can lead to inflation in the country. An increase in interest rates or a reduction of bank’s reserves reduces the volume of deposits and loanable funds that can not be offset by other sources of funds therefore the supply curve shifts- upwards.
The mortgage is a pledge of property e.g. land that acts as evidence that one can borrow money from a financial institution since he or she is creditworthy. In most jurisdictions the mortgages are associated with loans that are secured on real estates rather than other property such as ships. The investors can purchase residential and commercial real estates by arranging the mortgages using a standard form so as to enhance the sale of the real estates in an efficient and effective manner. The borrower of loan using the mortgage can discharge the mortgage once the loans have been paid to the banks that are given the loans. If the mortgagor fails to repay the loans according to the set conditions then the mortgagee could foreclose the property until it is paid.
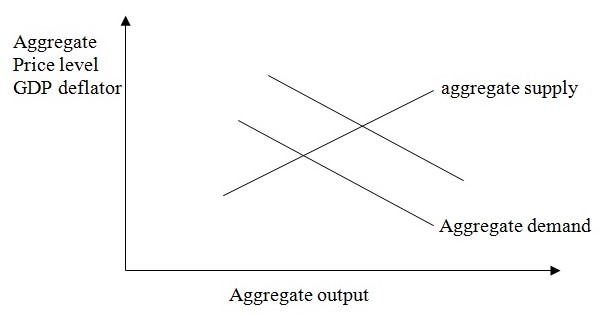
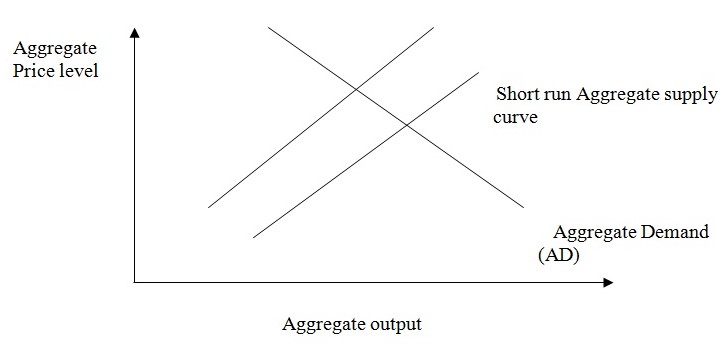
The aggregate demand model and the aggregate supply model are factors that are used for evaluating the factors and conditions that affect the level of real Gross Domestic Product (GDP) that is affected by inflation and are used for determining the level of inflation in a country. These models are used to represent the quantity of output of an entire economy. The implicit price deflators are used to compute the real Gross National Product (GNP) of goods and services of a country from the nominal inflated Gross National Product (GNP).The Aggregate Demand Curve that has a negative slope indicates that with any given amount of nominal income the purchaser can buy more real goods at a lower price and than when they are charged at higher prices if the aggregate demand curve has a positive slope. The slope of the Aggregate Supply (AS) curve are flat because the considerate part of its length turns upwards and vertical. The relatively flat region of the Aggregate Supply Curve (AS) is non-inflationary region while the vertical region is an inflationary region of the Aggregate Supply Curve. Some versions of the Aggregate Supply (AS) curve uses the price level instead of the inflation rate to make up this model so that it can be consistent with the microeconomics counterparts.
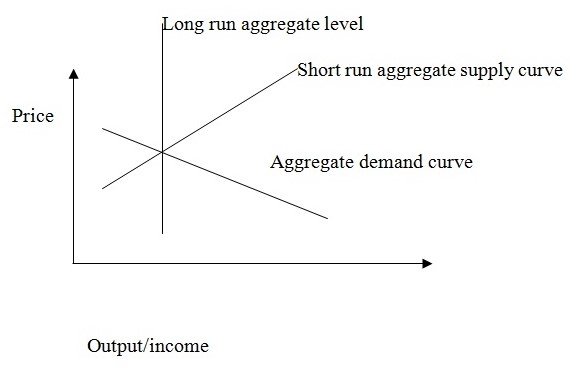
The Short-Run Aggregate Supply Curve (SRAS) shows the relationship between the price level and quantity of the real Gross National Product (GDP) that are supplied by the firms in the short run.. The factor that causes the Short Run Aggregate Supply Curve (SRASC) to slope upwards is contracts that make wages and prices to be sticky and stagnant and they are applied to firms that are slow in adjusting wages and the menu costs. The variables that cause the Short-Run Aggregate Supply Curve (SRASC) to shift are the increases of the labor force, capital stocks, technological change, changes in the future price level of goods and services, adjustments of works and firms so as to remove errors of the past expectations that deal with the price levels and the unexpected changes in the price of the natural resources.
The factor that affects the Aggregate Demand Curve (ADC) to shift is the changes in government policies, expectations of households and firms, changes in foreign variables. The implications of the federal reserves system to offer $300 billion to the financial institutions as loans are that the Aggregate Demand Curve to shifts upwards since the investor borrows the money that are used to purchase more infrastructures that would increase the productivity of the country.Inorder for the financial institutions to generate money that would be used to facilitate their operations of the banks, they increased the interest rates so that they could generate earnings for the company.The increase of the interest rates lead to the cost of the infrastructures to increase since they are affected by the interest rates and this causes the prices of the goods and services to also increase since the level of productivity was high and this translates to the demand for the goods into the country. The expansion of the transportation infrastructure in the short run leads to the shifting of the Aggregate Demand Curve upwards as it lead to the increase of production of goods and services since the customers would access the goods and also the producers were in a better position to deliver their goods and services to the customers hence facilitated in the carrying out of the business activities in an easier and faster way.
The Long Run Aggregate Supply Curve (LRAS) showed the relationship between the price level and the quantity of the real Gross Domestic Product that were applied in the long run. The Aggregate Supply Curve described the relationship between the price levels and the quantity of output that firms were willing to provide to the customers. The total supply of goods and services that were produced within an economy within a given price level in a given time period were represented using the curve. When the prices increased this meant that the businesses expanded their level of production so as to meet the higher level of the aggregate demand of the customers. The factors that caused the Aggregate Supply Curve to shift were changes in the size and quality of labor, technological innovations, and increases in wages, increase in production costs, changes in producer taxes, subsidies and the changes in inflation. The implications of the Federal Reserves Systems to offer $300 billion loan to the financial institutions led to the shifting of the Aggregate Supply Curve to the right hand since the supply of money in the economy was high. The introduction of the transportation infrastructures into the country led to the shifting of the Aggregate Supply Curve and the prices of goods and services to increase due to the high demand for goods and services. In the short run the Aggregate Supply Curve responded to the higher demand of goods and services and the prices brought in more inputs into the production process and it also increased the utilization of the current input of the company.
In the long run the Aggregate Supply curves were not affected by the price level, but were only driven by the improvements in productivity and efficiency. In the long run the aggregate supply curves were not affected by the expansion of the transportation infrastructures, but there was remarkable improvement in the productivity of goods and services of the companies in the country. The acceptance of the mortgages as collaterals to act as prove that one was credit worthy to clear up the debts of the company lead to the increased circulation of the money in the country and this lead to the high demand for the goods and services by the public since they had enough money to purchase infrastructures was required. The supply of the goods and services was scarce therefore the producers increased their level of production so they could supply the goods and services that were required by the public. The Short Run Aggregate Supply Curve shifted upwards due to the increased supply of factors of production and also the productivity of the country also increased.
The level of price was represented by an upright axis and the quantity variables that are on the horizontal axis were represented by real Gross Domestic Products (GDP) that was used to measure the true value of annual national production and are used for the adjustments for the inflation changes. The intersection of the Short Run Aggregate Supply Curve and the Long Run Aggregate Supply Curve and the Aggregate Demand Curve gave rise to the equilibrium price level and level of output. The factors that lead to the aggregate demand curve to shift were the domestic and foreign consumers and the government. The interaction of the aggregate demand curve and the aggregate supply curve determined the equilibrium level of the real national output of commodities, goods and services of a country and also determined the national inflation rate. The expansionary policy shifted the aggregate demand curve to their right while the contraction policy shifted the aggregate demand curve to the left.
In long run the Long Term Aggregate Demand Curve was affected by the fixed factors of production therefore fewer changes were seen to the affect the productivity of the country. The Short-Term Aggregate Supply shifted to the left so there were only the effect of a change in the aggregate demands could change the price level.
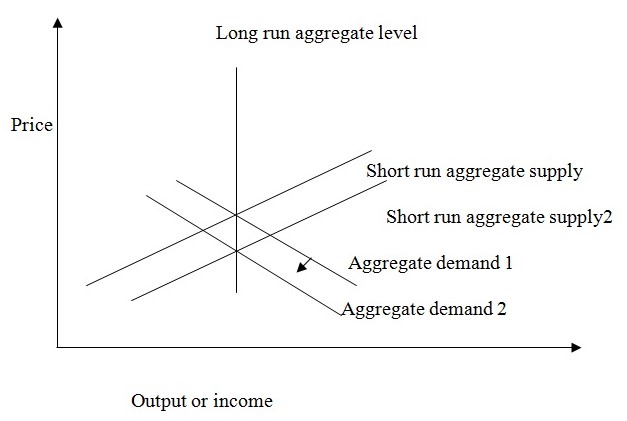
The shifting of the short run aggregate supply curves was rare as compared to the shifts in demand curve. The Short Run Aggregate Supply Curve there was only shifts that were in response to aggregate demand curve. When supply shock occurred they resulted to the shifting of the Short-Run Aggregate Supply Curve that did not affect the Aggregate Supply Curve. In the short run equilibrium occurred when the Short-Run Aggregate Supply Curve intersected with the Aggregate Demand Curve. The Aggregate Demand Curve shifted along the short run Aggregate Supply Curve until the aggregate demand intersected with both the short run and long run equilibrium curves, but when the economy reached the long run equilibrium level the price level changed, but the output was not affected. The introduction of the mortgages to act as evidence that the investors would repay back their debts, lead to the shifting of the aggregate demand curve upwards because as more investors demanded the money so that they could expand their investments so that could generate revenue for the companies and also lead to the growth of the economy since there was the creation of employment of the residents of the country and also the government would earn more income from the taxes they would collect from the industries of the country.
There were two types of supply shocks; these were adverse supply shocks such as the increases of oil prices, and aggressive union actions. These adverse supply shocks resulted to the increase of the price level of output and it resulted to the shift of the Short Run Aggregate Supply Curve to the left. The other supply shock was the positive supply shocks that included the decrease in prices of goods and services. It resulted to the price level for a given amount of output to decrease, that was represented by a shift of the Short Run Aggregate Supply Curve to the right. An adverse supply shock created a terrifying increase in the price of goods and services that resulted to the shifting of Short-Run Aggregate Supply Curve to the left.
The intersection of the Short Run Aggregate Supply Curve and the Aggregate Demand Curve and shifting to the left hand side lead to the decrease of the amount of output and the increase of the price level a condition that was referred to as stagflation that created the new short run equilibrium level.
The transportation infrastructure was an important infrastructure because it led to the carrying of business activities within the country in an effectively and efficiently manner so as increase productivity within the country. The importance of the transportation infrastructures were that it also leads to the production and distribution process to be effective, created opportunities for economies of scale and also increased the level of specialization between people who carried out businesses since the transportation of goods and services was easy because of the good transportation infrastructure. The other importances of transportation infrastructure were that it changed the logistic systems and it reduced the costs that could be incurred because of having a transportation infrastructure that was not effective.
The advantages of expanding the transportation infrastructure are that it would increase the economic competitiveness since it could encourage the United States residents and the state visitors to make frequent and larger trips to the United States tourist attraction and recreational areas so as to increase the earnings of the country.
The Monetarist argued that policies that lead to the increase in the money supply stimulated the national income into the country but it usually had short term effect on the real output that to the led to the creation of inflation into the country. The increase of money supply resulted to increased levels of spending through the transmission mechanism and it created the situation where the aggregate demand for goods and services exceeded the aggregate supply that lead to the demand-pull inflation and also lead to the shifting of the aggregate demand curve upwards in the short run.
The implication of the increased supply of money into the economy through offering the $300 billion loan and allowing mortgage to act as collateral for borrowing
money lead to the increased supply of money in circulation that led to the shifting of the Aggregate Demand Curve to the right since there was increased demand for the money for development purposes and also the demand for goods and services was also high that translated to production of the goods and services so that the producers could supply the goods and services that were needed by the public. The prices of the goods and services increased so that the producers could generate revenue that could meet the costs that were incurred during the implementation of the infrastructure that facilitated the production of the goods and services into the country.
The increased cost of production resulted to the shifting of the aggregate supply curve to the left, this occurred because the costs of inputs increased. When the firm’s costs increased they lead to the increase of the prices of the factor inputs so that the profits of an organization could be maintained. The cost-push inflation is caused by: the increased prices of factors of production increase in wage settlements, devaluation of the currency that leads to the increase of the import prices. The increased interest rates that lead to the increased cost of borrowing and the indirect taxes.
The expansion of the transportation infrastructure lead to the demand for the facilities that would facilitate the development of the transportation sector therefore this lead to the cost of the factors of production to increase and this resulted to the shifting of the Aggregate Supply Curve to the left and it translated to the increased prices of goods and services that were produced into the country.
References
Adams, C and Coe, D T ‘A Systems Approach to Estimating the Natural Rate Of Unemployment and Potential Output For the United States’, IMF Staff Papers, Vol 37, 1990 pages 232–93.
Alogoskoufis, G and Smith, R ‘The Phillips Curve, the Persistence of Inflation And The Lucas Critique: Evidence from Exchange-Rate Regimes’, American Economic Review, Vol 81, (1991), pages 1,254–75.
Amano, R, Coletti, D and Macklem, T ‘Monetary Rules When Economic Behavior Changes’, Bank of Canada, mimeo (1998).
Astley, M and Garratt, A ‘Interpreting Sterling Exchange Rate Movements’, Bank Of England Quarterly Bulletin, Vol 4, (1996) pages 394–404.
Astley, M and Haldane, A G ‘Money as an indicator’, Bank of England Working Paper, No 35. England (1995).
Astley, M and Haldane, A G ‘The Information in Money’, Bank Of England Quarterly Bulletin, Vol 2, England (1997), pages 174–80.
Ball, L. ‘Policy Rules for Open Economies’, In Taylor, J B (Ed), Monetary Policy Rules, Chicago: University Of Chicago Press for NBER (1999).
Barrell, R and Sefton, J ‘Output Gaps, Some Evidence from the UK, France and Germany’, National Institute Economic Review, (1995), Vol 0(15), pages 65–73.
Batini, N and Haldane, A G ‘Forward-Looking Rules For Monetary Policy’, In Taylor, J B (Ed), Monetary Policy Rules, Chicago: University Of Chicago Press for NBER (1999).
Blake, A P and West away, P F ‘Credibility and the Effectiveness of Inflation Targeting Regimes’, Manchester School, Vol 64, (1996), pages 28–50. Braun, Dennis Duane. The Rich Get Richer: The Rise of Income Inequality in the United States and the World. Chicago: Nelson-Hall Publishers, 1991.
Braun, Dennis Duane. The Rich Get Richer: The Rise of Income Inequality in the United States and the World. Chicago: Nelson-Hall Publishers, 1991.
Brigden, A, Martin, B and Salmon, C, ‘Decomposing Exchange Rate Movements According To the Uncovered Interest Rate Parity Condition’, Bank Of England Quarterly Bulletin, Vol 4, (1997), pages 377–89.
Britton, E and Whitley, J ‘Comparing the Monetary Transmission Mechanism In France, Germany and the United Kingdom: Some Issues and Results’, Bank of England Quarterly Bulletin, Vol 2 (1997), pages 152–62.
Britton, E and Whitley, J ‘The Inflation Report Projections: Understanding the Fan chart’, Bank of England Quarterly Bulletin, (1998), Vol 1, pages 30–7.
Campbell, J Y, Lo, A W and MacKinlay, A C (1997), The Econometrics of Financial Markets, Prince town University Press.
Christiano, L J and Gust, C J ‘Discussion of Levin, A, Wieland, V, and Williams, J.C, ‘Are Simple Monetary Policy Rules Robust To Model Uncertainty?’’ Forthcoming In Taylor, J (Ed), Monetary Policy Rules, Chicago: University Of Chicago Press Fornber. (1998).
Clarida, R and Gali, J ‘Sources Of Real Exchange Rate Fluctuations: How Important Are Nominal Shocks?’ Carnegie Rochester Conference Series on Public Policy, Vol 41(0), (1994), pages 1–56.
Cross, R (1995), ‘Is The Natural Rate Hypothesis Consistent With Hysteresis?’ In Cross, R (Ed), the Natural Rate of Unemployment—Reflections on 25 Years of the Hypothesis. Cambridge, Cambridge University Press. (1995), Collins, C. Economic Apartheid in America: A Primer on Economic Inequality and Insecurity. New York: New Press, 2000.
Daly, Mary C. and Vallotta R. G. “Inequality and Poverty in the United States: the Effects of changing family behavior and rising wage dispersion.” Federal Reserve Bank of San Francisco, 2000.
Fuhrer, J. C. The UN Importance of Forward-Looking Behaviors in Price Specifications’, Journal of Money, Credit and Banking, Vol 29, (1997), pages 338–50.
Gali, J ‘How well does the IS-LM model fit post-war US data?’, Quarterly(1992), Ganley, J and Salmon, C ‘The industrial impact of monetary policy’, Bank of England Quarterly Bulletin, England Vol 3(1996), pages 288–98.
Gruen, D, Pagan, A and Thompson, C ‘The Phillips Curve in Australia’, Reserve Bank of Australia, mimeo. (1998), Haldane, A. G, McCallum, B T and Salmon, C (‘Base money rules in the United Kingdom’, Manchester School of Economic and Social Studies, Vol King, M), ‘Monetary Policy and the Labor Market’, Bank Of England Quarterly Bulletin, England (1998) Vol 1, pages 90–7.
Lardner, J. “The Rich Get Richer: What Happens to American Society When the Gap in Wealth and Income Grows Larger? U.S. News and World Report, 2000.
Johnson, Nicholas. A Hand Up: How State Earned Income Tax Credits Help Working Families Escape Poverty. Washington, D.C.: Center on Budget And Policy Priorities, (1999).
Keister, Lisa. Wealth in America: Trends in Wealth Inequality. Cambridge: Cambridge University Press, 2000.
Kleymarket, A. et al. “Wealth Dynamics in the 1980s and 1990s: Sweden and the U.S.” Uppsala University Department of Economics Working Paper, 2000.
Lardner, J. “The Rich Get Richer: What Happens to American Society When the Gap in Wealth and Income Grows Larger? U.S. News and World Report, 2000.
Ray. B. “Poverty is More Than a Matter of Income New York.” New York Times-Late Edition, 2002.
Ray B and Sherraden. M. “For Every Child, a Stake in America.” New York New York Times, 2003.
Sachs, Jeffrey D. “A Rich Nation, a Poor Continent.” New York. New York Times, 2003.
Sterne, G and Bayoumi, T ‘Temporary Cycles or Volatile Trends? Economic Fluctuations in 21 Oecdeconomies’, Bank of England Working Paper, No 13. England (1993), Thomas, R.S., ‘The Demand for M4: A Sectoral Analysis. Part 1—the Personal Sector’, Bank Of England Working Paper, England (1997) No 61.
Thomas, R S), ‘The Demand for M4: A Sectoral Analysis. Part 2—The Corporate Sector’ England, Bank of England Working Paper (1997), No 62.
Turner, D (1995), ‘Speed Limit and Asymmetric Inflation Effects From the Output Gap in the Major 7 Economies’, OECD Economic Studies, No 24, (1995), Pages 57–87. Page 10 156.
Uhlig, H ‘A Toolkit for Analyzing Non-Linear Dynamic Stochastic Models Easily’, Federal Reserve Bank of Minneapolis Discussion Paper (1995), No 101.
Wolff, E. N. Top Heavy: A Study of the Increasing Inequality of Wealth in America. New York: Twentieth Century Fund Press, 1995. Vol 38, (1998), pages 233–. Yates, A ‘Are prices and wages sticky downwards?’ England Bank of England Quarterly Bulletin.