Introduction
Littlefield Laboratories is an automated service for delivering blood test results. In the course of the simulation, the team has accepted the role of the operations team aimed at maximizing the service’s efficiency and profit. The areas of primary areas include forecasting, capacity management for the stations, and the exit strategy. The report will focus on the simulation results and recommendations based on the outcomes.
Forecasting Approach
The initial challenge of forecasting was the fact that the service provided no historical data on the operations. Hence, the straight line and moving average forecasting options were eliminated from the discussion. The focus was made on the observational data obtained from days 1 to 50 of the laboratory’s work. In the beginning, the team chose the reactive forecasting method of adjusting the contract and capacity based on the existing lead time. However, the optimal choice for the calculation would be to pursue a simple lineal regression by estimating the lead time tendencies based on the revenue and job arrivals. Thus, the average cash on hand was $1,034 thousand, whereas the job arrival average was 2.7 orders placed with a maximum of 9 orders placed per day. Based on these data, the optimal contract option should have been chosen.
Contracts
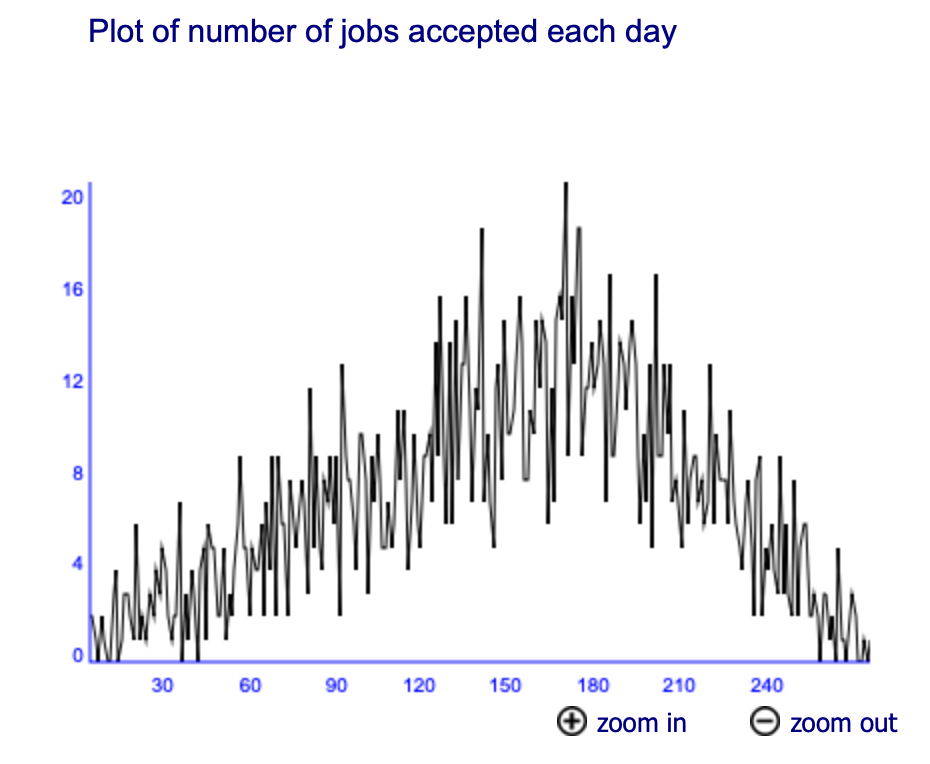
The team’s choice was based on the existing lead time for processing one order. The data revealed that the lead time allowed switching to Contract 2, with a maximum lead time of 24 hours and quoted lead time of 12 hours. In the beginning, this option seemed viable and more profitable. However, the order placement rate increased significantly over time, limiting the service’s capacity with record-breaking 21 orders placed on Day 164 (Figure 1). As a result, the team decided to switch back to the Contract 1 option with a lead time of 14 days. The optimal choice here would be to proceed with the initial option and expand the capacity by purchasing more machines. This option, however, was impossible due to poor capacity management at the beginning.
Capacity Management
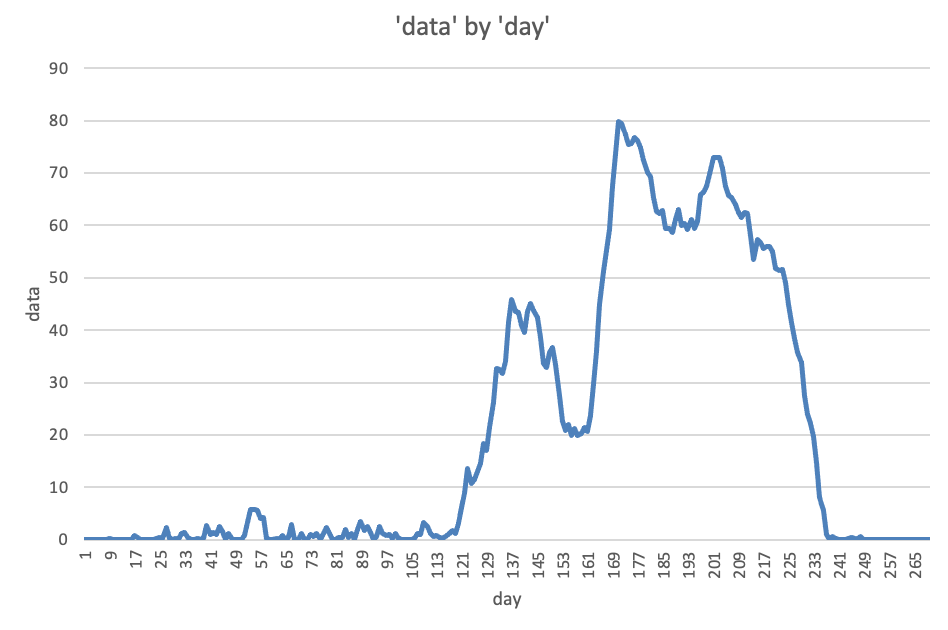
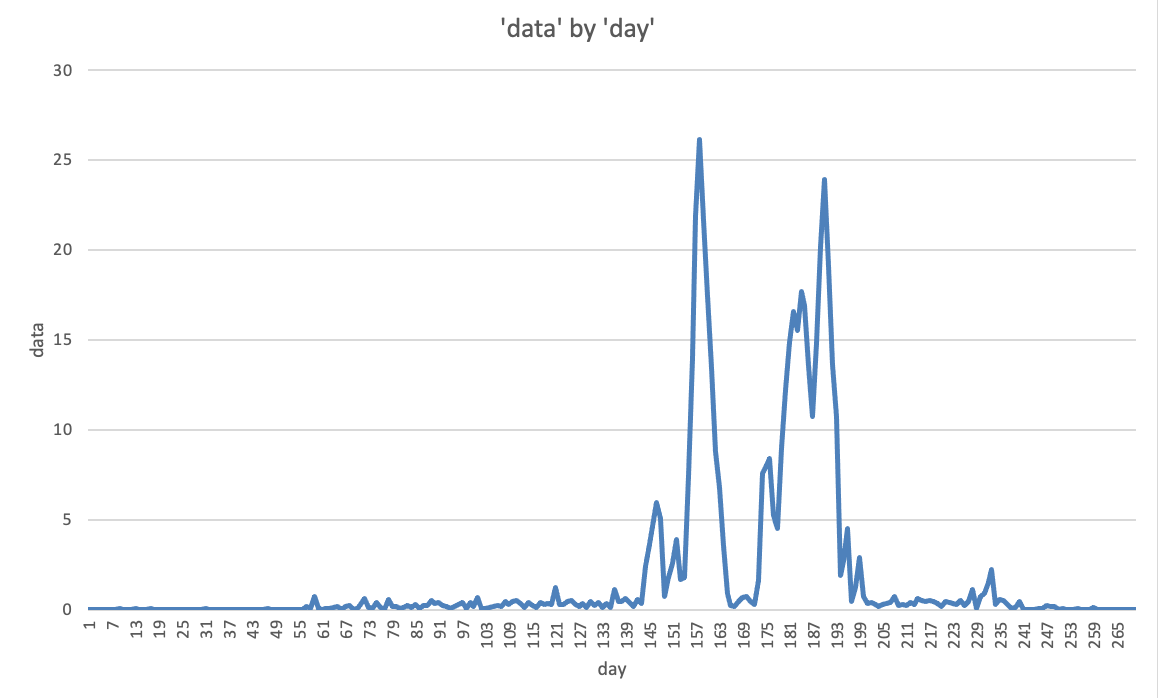
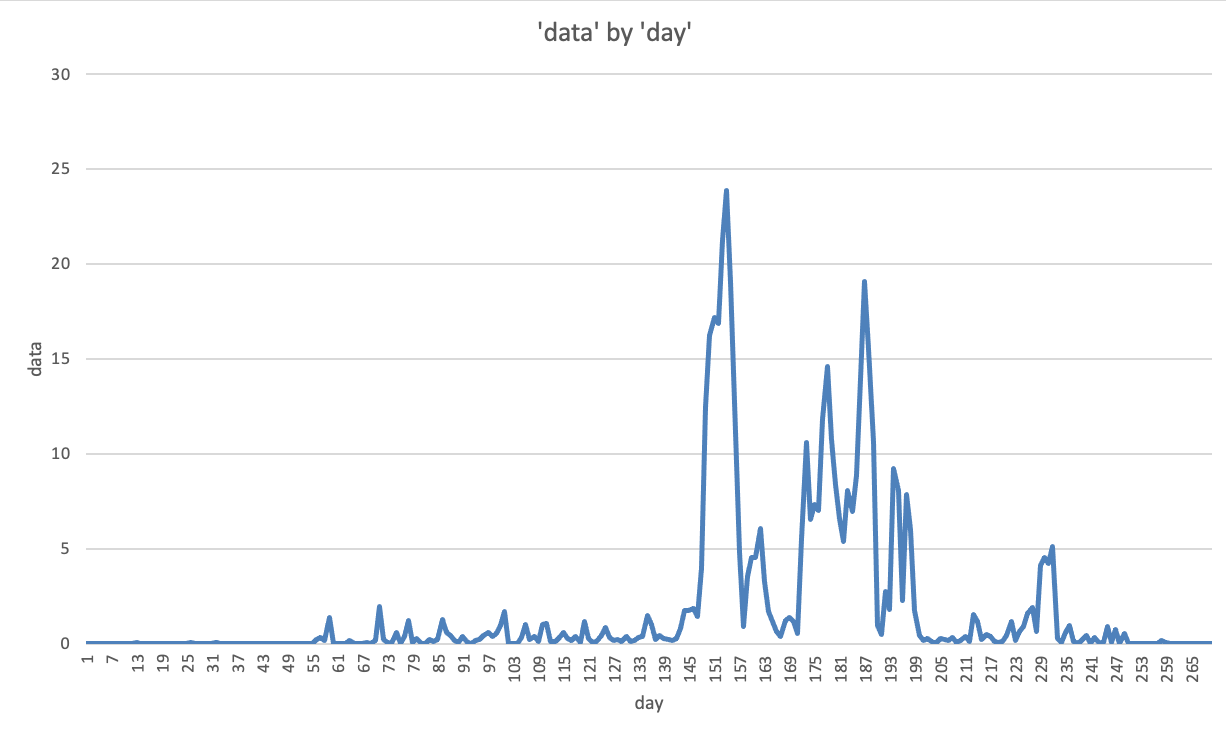
In order to identify the capacity required for each section, it is vital to understand the load for each of the three sections. Figures 2, 3, and 4, depicting the kits queued for each station, respectively, demonstrate that in order to process more orders, the service needs to expand its sample preparing and testing stations. The optimal ratio would be 3-2-1 for Stations 1, 2, and 3, respectively. Such capacity was not fulfilled because, at the preliminary stages, an additional Station 1 machine was purchased without consideration for raw inventory spending (Gallego-García et al. 5567). As a result, $270,000 spent on machinery without accurate calculations led to the inability to expand Station 2 and handle the increasing order load,
Exit Strategy and Conclusion
The chosen model for contract agility under the circumstances has resulted in financial loss and a cash balance of $454,460. When following a reactive approach to operations, the team is incapable of securing possible outcomes and modifications to the process. On the contrary, proactive forecasting models allow the team to consider several options at once in order to calculate the appropriate outcome. In the case of Littlefield Laboratories, the beneficial exit strategy would be to pursue with the first chosen contract option and postpone capacity management and inventory procurement to the point when more data were available for forecasting and analysis.
Work Cited
Gallego-García, Sergio, Jan Reschke, and Manuel García-García. “Design and Simulation of a Capacity Management Model Using a Digital Twin Approach Based on the Viable System Model: Case Study of an Automotive Plant.” Applied Sciences, vol. 9, no. 24, 2019, 5567.