Appreciation of Renminbi (Chinese Yuan)
Operations cost will reduce for firms that import raw materials (Reflections on RMB appreciation 2013, para. 8). Mainland firms that use local raw materials will not be affected directly. When investors are paid using US dollars, appreciation of the Renminbi causes investors to value the goods at a higher cost. High prices for goods produced in the mainland results in reduced international competitiveness.
Depreciation of the raw materials
Increased competitiveness causes firms in mainland China to expand their operations. They will be increased production and exports (Liu, Fan & Shek 2007, p. 23). Hong Kong investors in China will have the opportunity to expand their operations in mainland China to meet the growing demand for products in Hong Kong, the mainland, and worldwide (Genberg & He 2008, p. 85).
Depreciation of the products
Depreciation of products means lower prices for goods produced in mainland China. Products with a lower price may increase exports from both Hong Kong and mainland China. Investors in China will have to increase production in China. Increased production may be followed by increased operations cost but lower marginal costs. There is increased competitiveness when prices fall against major currencies. Increased competitiveness causes demand to increase from outside the country.
Give two examples of a “distinctive competence” of a company that can be sustained and not easily duplicated. (With brief explanation)
One of the companies that have developed distinctive competence is Toyota and its Kanban system. Toyota System of production (TPS) has been adopted by many companies but its Kanban system has been difficult to copy. Many companies that try to use the Kanban system fail to experience the same level of performance as Toyota. The TPS is built as organizational culture (Monden 2012, p. 10). The Kanban system is sustainable. Many firms that make visits to Toyota manufacturing plants fail to understand TPS because it is learned through working at Toyota.
Toyota has been able to meet specific consumer preferences through different car models. The distinctive competence is flexible automation of plant set up time. Toyota has been able to reduce machine setup time such that several models can be built at the same time (Monden 2012, p. 43). It enhances the JIT system. Other large companies met large costs of clearing inventory. Toyota has been able to prevent large unmoving inventory in its stores.
Perform a value analysis on a computer mouse, including “objective”, “basic function” and “secondary function”
The objective of the operations is to make a computer mouse. The basic function of the computer mouse is to direct the pointer to allow the user to select instructions that the computer should follow.
Secondary functions
- In the original design, there are 9 parts to assemble. The parts allow the mouse to fit in the hand of the user. There is a rolling ball at the bottom of the mouse.
- In the revised design, there are 8 parts to assemble. The ball at the bottom of the mouse is replaced with infra-red light. It reduces cases when the ball would get stuck as a result of wearing out. A rolling part is added at the top to reduce the need of moving the mouse when turning pages. The parts become more curved to make the mouse fit more comfortably in the hand. The width of the mouse is also reduced. The original design favored people with wide palms.
- In the final design, 7 parts to assemble. Different colors are considered. White and black are chosen for their neutrality.
Classify and give reasons for the following types of processes as line, batch, or project
Consult a doctor
Consulting a doctor is a project process. Gaspar (2006, p. 566) explains that professional processes such as law and medicine are grouped as project processes. The process is unique to different patients. The prescription is made according to patient needs. A project is a kind of process that gives out one outcome. The product is usually one of a kind made according to the customer’s order. Project processes do not have the flow of materials as output (Gaspar 2006, p. 566).
Automatic car wash
An automatic car wash is an example of a line process. The process is highly standardized. The same process is repeated to different customers. In a line process, products are made to fill inventory. The production follows the product which is running out of stock. The process is highly standardized (Gaspar 2006, p. 567).
Prepare college curriculum
Preparing a college curriculum is a project process because it is a unique product that matches customer specifications (Jones & Robinson 2012, p. 62).
Studying for an exam
Studying for an exam is a batch process. In a batch process, different parts may be assembled into a single unit. In studying for exams, different exams may comprise qualifications for one particular education level such as high school, graduate, or postgraduate. There is a limited flow of materials. A batch process is known for a large volume of production. There is less product variety. The different parts may be assembled to give the end product (Gaspar 2006, p. 567).
Make electric utility
Providing electricity is a single unique process. It may be categorized under a project. Providing electricity involves building a plant such as a dam, windmill, or nuclear reactor. These do not provide the flow of material out of the site. They are project processes.
Why are line processes usually less flexible than batch processes?
Line processes perform standardized procedures which may include automation or equipment specifically designed to perform one function. Batch processes allow a flow of a few varieties of materials. A batch process may involve different machinery and stages making it easier to accommodate changes.
In a batch process, a change can be made in one part of the many stages that make the product. Inline process, there is only one function. Making a change means changing the whole process.
Define the “cycle of service” for going to the theatre to see a movie (with a diagram and brief explanation)
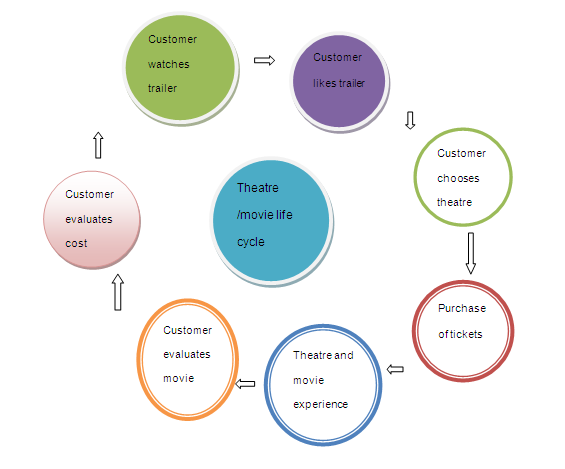
In the evaluation of value, the customer may feel there is value for money if the movie is as great as depicted in the trailer.
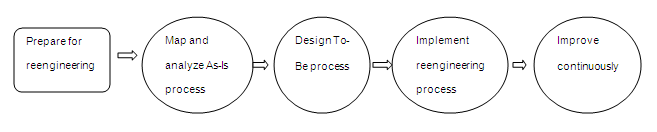
By studying the articles in the library or the internet, write a brief paragraph about Business Process Reengineering (BPR), including definition and methodology
BPR is a process of seeking new ways of making products. It involves designing new methods of achieving high quality, lower cost, and increasing the speed of processing. BPR is not only about creating new better methods of making the same product but also improving the new methods.
BPR methodology begins by adopting the reengineering process. It may involve setting a research and development department. The reengineering team maps and analyzes the current process. Mapping the existing process means examining the existing processes for strengths and weaknesses. It involves examining its capabilities and capacity. Processes that do not add value to the end product are eliminated.
The team then designs a new process that could make the same product. The designed process is tested and implemented. The main purpose of BPR is to develop new methods that improve production. Mohapatra (2012, p. 10) explains that BPR focuses on the outcome of the process. BPR means developing new ways rather than improve existing ones. Continuous improvement may be used to make the new design better functionally (Muthu, Whitman & Cheraghi 1999, p. 1).
What is the capacity of the process and what is the bottleneck?
Capacity refers to the maximum number of units that can be processed at any given time (Evaluating process capacity 2013, p. 2). In the cake ship case, the capacity of the oven is 3 cakes every 30 minutes. The oven determines the flow of units. The oven’s capacity is the bottleneck. If more than 3 orders arrive at the same time, the fourth customer will have to wait for an additional 30 minutes above the normal time. Cooling the cake is not a bottleneck because it does not limit the rate of output.
What is the throughput time for a typical cake?
The throughput time is the rate at which an order is received and processed in a stable process (Laguna & Marklund 2011, p. 141). A cake order takes 2 minutes to accept. It takes 8 minutes to mix ingredients, 30 minutes to bake, 1 hour to cool the cake, 2 minutes to pack, and 3 minutes for pick-up. The total time between placing an order and delivery is 1 hour and 45 minutes.
If an average of 5 orders is taken per hour, how many cakes are there in the process? (Work-in-progress, inventory)
The first three cakes take 40 minutes between placing an order and baking the cake. Additional cakes will only consume 30 minutes of additional time. Taking orders and mixing ingredients will take place when cakes are in the oven. The inflow rate into the oven is 6 cakes per hour and the outflow rate is 5 cakes an hour which leaves 1 cake extra every hour. Considering that the workers need a break, the company can produce 6 cakes an hour using oven time. Taking orders, mixing ingredients, packaging, pickups, and billing can take place when the cakes are in the oven. There will be an inventory of 5 cakes after 5 hours and 10 minutes. Workers can take a one-hour break before resuming work. There will always be 3 cakes in the oven and 1 cake inventory for every additional hour.
Experiencing a long queue in a bank
Tangible
Time lost waiting to deposit a check.
Reliability
Once you have queued, you will be served when you reach the counter.
Responsiveness
There is no mechanism to increase the rate of flow. The bank employees consider long queues as normal during certain periods of the month.
Assurances
There are no assurances that the system will change. The bank will continue to have queues. Those dissatisfied can move into other banks with higher service costs, but with shorter queues. Hernon and Altman (2010, p. 141) recommend that service providers should be courteous.
Empathy
The long queues appear normal to most of the employees but most customers are dissatisfied. The expression that I receive is that “If it happens in all banks then there is no need to worry.” There is a lack of empathy.
To utilize five steps to remove defects for process improvement
Six Sigma utilizes five steps for continuous improvement of the process. Six Sigma is used to reduce variations within a process. The principle of Six Sigma is that improvement should be measurable such as reduced cycle time, or a number of defects per unit (Harry et al. 2011, p. 2). Six Sigma follows five procedures which include defining opportunity, measure performance, analyze the opportunity, improve performance, and control performance. These procedures are known by the acronym DMAIC (Six Sigma 2011).
To rank the order of the causes of a quality problem
Pareto analysis is used to indicate the problem that should be prioritized. Pareto analysis is used to prioritize which change will give the biggest improvement (Pareto analysis 2013).
To indicate the capability of the process to meet its specification
Process capacity index is used to examine a process under investigation. It checks the rate at which a process will remain under specifications. It is also used to “specify performance requirements for new equipment and sampling interval for process control” (Sorli & Stokic 2009, p. 35). It finds out how long a process will perform a task as required.
To determine if a process is under control in the range
A control chart is “a graph with a central line, an upper limit and a lower limit” (Quality control charts 2000, para. 1). It is used to check whether a process is stable or out of control. It is also used to test whether the variations are built into the process or they are not part of the process.
To identify the various potential causes of the problem
The cause and effect diagram is used to find the causes of a problem. It uses four categories where problems may emerge. These are “people, machines, methods, and materials” (Charantimath 2006, p. 74).
Case study in Metro & Asian Dress
What are the main problems of Asian Dress’ current operations?
One of the problems is the inability to forecast customer needs so that it can keep an inventory that meets customer requirements. There are no sales and operating plans.
The supply chain management group should focus on logistic function only. Logistics can also be provided by a third party. Delay in receiving materials from suppliers increases lead time in delivering materials to customers.
There are only 5 purchasing people involved in ordering materials from 35 suppliers. If they are to continue working manually, more employees are needed. The materials need to be categorized for easy division of work.
Should Metro cancel the contract with Asian Dress? Please explain your choice
Metro should not cancel its contract with Asian Dress. Metro should use its forecast to keep inventory levels that accommodate Asian Dress lead time and its sales forecast (Beasley n.d.). Metro should order using its forecast 10 days before it runs out of stock.
Metro should insist that Asian Dress use automation which may result in lower costs in the long-run. Asian Dress will not need to add new employees to manage logistics when operations have been automated. The five employees may adequately serve all 35 suppliers. There will be a need for the categorization of supplies for easy division of responsibilities.
What initiatives should Metro take to resolve this dilemma?
Metro should always keep an inventory that can go for 10 days without running out of stock. Metro should advise Asian Dress to reduce lead time by hiring more workers and machines. Hiring more workers and machines may reduce lead time but increase costs.
Metro should emphasize the benefits of automation to Asian Dress. A CRM system or ERP system would be fast, accurate, and reliable. It would link suppliers and customers in one system. Most of the solutions should be carried out by Asian Dress.
Calculations
1.
MAD is the mean absolute deviation which is the mean of the absolute values of the standard error (Forecasting – suggested solutions 2009). A smoothing constant of 0.2 indicates that less weight has been given to recent data (Coyle et al. 2009, p. 239).
Forecast = α (demand this period) + (1 – α) (average calculated last period).
The tracking signal is obtained by dividing the cumulative errors by the MAD (Wisner, Tan & Leong 2011, p. 148). The tracking signal is used to check whether the forecast is within acceptable boundaries. Wisner, Tan & Leong (2011, p. 148) discuss that some experts put values between -/+0.4 for the product with high sales volume and -/+0.8 for the product with low sales volumes.
2.
p = sum of hiring + firing + holding cost in October = $ 7,350
q = sum of hiring cost = $0 + $ 22,750 + $30,100
r = total firing costs = $60,350
s = total holding costs = $0
t = total hiring + firing + holding = $90,450
Holding costs are zero because there are no inventories at the end of each period. The company also does not maintain extra workers.
The BOM of product A
a)
There will be no action taken in week 2 because of the ordering of materials earlier results in increased inventory. Inventory incurs cost. The firm can lower inventory costs by ordering only what is needed (Beasley n.d.).
Parts A, B, C, and D have no inventory at the end of week 6.
d)
If the lead time increases to 3 weeks, I would order 75 units of part D at the beginning of the second week, and 250 units at the beginning of the third week.
Reference List
Beasley, J n.d., OR-Notes: Materials requirements planning. Web.
Charantimath, P 2006, Total quality management, Pearson Education, New Delhi.
Coyle, J et al. 2009, Supply chain management: A logistics perspective, South-Western Cengage Learning, Mason.
Evaluating process capacity 2013. Web.
Forecasting – suggested solutions 2009. Web.
Gaspar, J 2006, Introduction to business, Houghton Mifflin, Boston.
Genberg, H & He, D 2008, Macroeconomic linkages between Hong Kong and mainland China, City University of Hong Kong Press, Kowloon.
Harry, M et al. 2011, Practitioner’s guide to statistics and lean Six Sigma for process improvements, John Wiley & Sons, Hoboken.
Hernon, P & Altman, E 2010, Assessing service quality: Satisfying the expectations of library customers, American Library Association, Chicago.
Jones, P & Robinson, P 2012, Operations management, Oxford University Press, 2012.
Laguna, M & Marklund 2011, Business process modeling, simulation and design, Dorling Kindersley, New Delhi.
Liu, L, Fan, K & Shek, J 2007, ‘Hong Kong’s trade patterns and trade elasticities’, Hong Kong Monetary Authority Quarterly Bulletin, pp 21-31. Web.
Mohapatra, S 2012, Business process reengineering: Automation decision points in process reengineering, Springer, New York.
Monden, Y 2012, Toyota Production System: An integrated approach to Just-In-Time (4th in.), CRC Press, Boca Raton.
Muthu, S, Whitman, L & Cheraghi, S 1999, ‘Business Process Reengineering: A consolidated methodology’, Proceedings of The 4th Annual International Conference on Industrial Engineering Theory, Applications and Practice, San Antonio, pp. 1-28. Web.
Pareto analysis 2013. Web.
Quality control charts 2000. Web.
Reflections on RMB appreciation 2013, media release. Web.
Six Sigma 2011. Web.
Sorli, M & Stokic, D 2009, Innovating in product/ process development: Gaining pace in new product development, Springer, London.
Wisner, J, Tan, K & Leong, G 2011, Principles of supply chain management: A balanced approach (3rd edn.), South-Western Cengage Learning, Mason.