Adolescence is characterized by numerous physical, emotional, and psychological changes in people. Sometimes, teens’ behaviors can be predicted by taking the necessary measures. However, in some cases, it turns out to be hard for children aged between 12 and 17 years to understand their emotional or physiological needs, which leads to the development of certain mental health problems. Approximately 241 million youth are affected by different mental disorders around the whole world (Polanczyk, Salum, Sugaya, Caye, & Rohde, 2015).
Depression is one of such disorders among adolescents who suffer from the feeling of sadness and low self-esteem. More than 47 million young people have at least one major depressive episode globally, and around 3 million of them are Americans (National Institute of Mental Health, 2017; Polanczyk et al., 2015). Early intervention of depression is a key aspect of pharmacological and non-pharmacological treatment to predict the risks of suicidality and severer forms of psychosocial impairment.
Depression Background
Major depressive disorder in childhood and adolescence, also known as adolescent depression, is a psychiatric disorder with a significant effect on human behavior and development. Due to the presence of symptom variation, this disease often stays unrecognized and untreated for a considerable period, provoking new complications and unpredictable outcomes (Mullen, 2018). Major symptoms in an adolescent population are divided into emotional and behavioral. On the one hand, emotional changes include a feeling of sadness, guilt, or hopelessness, annoyed mood, low self-esteem, extreme sensitivity, fatigue, and distraction (Centers for Disease Control and Prevention, 2018).
On the other hand, changes in behavior are frequently recognized in adolescents, including loss of energy, abnormal sleep patterns, eating habits, impaired school performance, and suicidal ideation (Mullen, 2018). According to the World Health Organization (2018), depression may be of three types: mild, moderate, and severe, depending on the presence or absence of manic episodes and the level of associated changes in work, functioning, and communication. Self-harming behavior cannot be ignored and requires additional investigation and evaluation.
Compared to adult depression, young people rather low ratings of depressive episodes. According to the reports by Mental Health America (2017), about 11% of American youth (3.1 million) suffer from at least one major depressive episode annually. In Oregon, the prevalence of depression in youth has the highest ratings (more than 14% that is 43,000 adolescents), and, in the District of Columbia, the lowest ratings (not more than 9% that is 3,000 adolescents) are observed (Mental Health America, 2017).
In this list, Florida is somewhere between with its 10.5% of adolescents (Mental Health America, 2017). However, regarding the size of the state and the number of people living there, depression episodes are remarkable – about 150,000 cases per year (Mental Health America, 2017). In general, in the world, 47 million children and adolescents report depressive disorders annually (Polanczyk et al., 2015). Risk factors for this condition are a history of physical or sexual abuse, alcohol or drug abuse, and the presence of other mental health conditions.
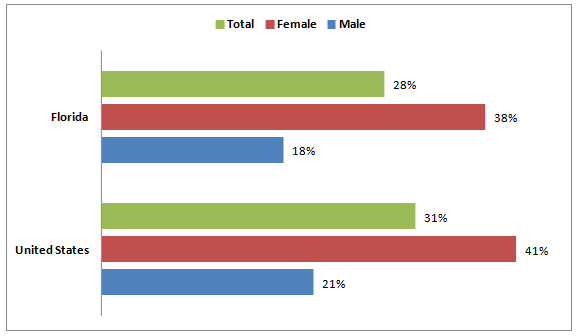
There are also certain distinctive features of depressive episodes depending on the gender and ethnicity of adolescents. For example, in the United States, its prevalence is higher among females (19.4%) compared to males (6.5%) (National Institute of Mental Health, 2017). White patients’ reports constitute about 13.8%, whereas 12.7% of Hispanic patients, 11.9% of Asian patients, and only 9.1% of Black patients are officially diagnosed with depression (National Institute of Mental Health, 2017). The prevalence of depression in American adolescents (Florida compared to the United States) is shown in Figure 1.
Surveillance Methods and Reporting
Surveillance and monitoring of depressive episodes among adolescents is an important step in targeting the necessary resources, reporting on the progress, and reducing the outcomes of the chosen mental health disorder. As a rule, mental health surveillance consists of the results of a systematic and ongoing collection of information that has to be further interpreted and provoke appropriate health actions (Perou et al., 2013). There are many research and screening instruments to measure the prevalence of mental illnesses, including depression. A survey of mental health may be developed in a variety of ways, and the most effective for reporting depression are as follows (Perou et al., 2013):
- The National Health and Nutrition Examination Survey (NHANES) is a surveillance technique that is conducted by the Centers for Disease Control and Prevention (CDC). Interviews are used to gather personal data, and the analysis of dietary habits, biochemical tests, and physical conditions is developed. In particular, depression is measured using the nine-item Patient Health Questionnaire (PHQ-9) about major symptoms within the last two weeks.
- The National Survey of Children’s Health (NSCH) is a population-based telephone survey that aims to gather information about the physical and emotional states of children from randomly selected parents or official guardians. Participants define the quality of mental health problems, and the CDC analytics combine the symptoms and the severity of a condition. Parents should also inform if any treatment, both pharmacological and non-pharmacological) is applied to a child.
- The National Youth Risk Behavior Survey consists of several self-administrated questions on a computer-scannable booklet. CDC uses this technique to identify behaviors that may contribute to violence, injuries, poor nutrition, or physical activities. Students from 9-12 grades are the participants of this research method. They have to evaluate their real-life experience during the last 12 months and give fair answers to each question.
The major differences of the chosen surveillance modalities lie in the priorities that are established by their developers. In some cases, special attention is paid to what has to be measured. In many techniques, various samples and sources of information are used to underline the uniqueness of each answer. Finally, even the way of how data should be collected defines the type of surveillance method for a population. In Florida, telephone and personal interviews are usually chosen by the official CDC representatives to collect information and present it to local healthcare provides medical centers and social services.
Descriptive Epidemiology Analysis
A descriptive epidemiology analysis includes the evaluation of three factors in disease development – person, time, and place. In this report, the evaluation of depressive episodes among adolescents (person) who live in South Florida (place) within the last five years (time) will be developed. Mental Health America (2017) proves that a considerable increase in depressed adolescents across the United States is observed over time. Such warning signs as frequent suicide threats, death-related poems and essays, unexplainable obsession with death or suffering, irrational behavior, and low school performance cannot be ignored.
The main challenge is that more than half of American adolescents remain undiagnosed and undertreated before reaching their adult years. Burnett-Zeigler et al. (as cited in Mullen, 2018) state that primary care physicians observe emotional disturbance in one-third of patients and 14% are usually diagnosed with depression. Compared to childhood when the frequency of depression between boys and girls is almost equal, after their puberty (adolescent period), female patients have depressive episodes more often than males (Perou et al., 2013). Therefore, young ladies who reach puberty are exposed to multiple exogenous factors that result in depression.
Depression in adolescence has also several social and economic impacts on families. For example, the review developed by Beecham (2014) shows that an ordinary American family should be prepared to pay about $1,000-$1,500 annually. However, these costs continue growing, depending on current economic conditions and employment ratings. In some states, the lack of psychiatric professionals cannot be ignored. Families should address several experts and take multiple screening tests to be diagnosed with depression and then be properly treated.
Depression Diagnosis Standards
Depression is usually diagnosed after the results of three types of evaluations. First, a physical examination of a patient occurs, including questions about an overall health condition. Second, lab tests are used to check the blood and the state of the thyroid and clarify the functioning of all the body systems. Finally, a psychological evaluation has to be developed through talks about personal thoughts and feelings. There are two frequently used systems in diagnosing depression known as national standards for screening – the International Classification of Diseases (ICD) and the Diagnostic and Statistical Manual of Mental Disorders (DSM) (Polanczyk et al., 2015).
PHQ-9 is a screening instrument within the NHANES that aims to identify depression symptoms. It is easy to find this test online, answer the questions, and interpret the results at the end. Its latest version, Urdu, has optimal sensitivity of 76%, specificity of 76%, and a positive predictive value of 48% (Gholizadeh, Khan, Vahedi, & Davidson, 2017). It financially costs nothing for a person to take this test online, except the access to the Internet and some personal time to read the questions and give true answers.
A Plan to Address Depression
Regarding the number of adolescents who have emotional and behavioral problems because of depression, a plan to address this chronic condition and prevent its complications has to be developed. There are three stages in this plan: primary (prevention and recommendations adolescents), secondary (treatment to reduce disabilities and prevent negative outcomes), and tertiary (rehabilitation to restore mental health). The outcomes of each intervention can be measured by a variety of methods, and some of them will be discussed in this plan.
In the plan with three interventions, the concept of mental health advocacy plays an important role as it promotes the rights of people with depression and reduces discrimination in treatment. The World Health Organization (2018) supports advocacy movements in different countries to increase services for different people who are at risk of having mental disorders, improve the quality of education, and strengthen social support. In the offered plan, interventions can be properly integrated with health policy advocacy efforts.
Conclusion
Depression is a burning mental health topic in the United States, including Florida, as well as worldwide. People of different ages may have this condition, demonstrating such symptoms as a lack of energy or interest in doing something, fatigue, and a low level of performance. Adolescents suffer from serious depression-related complications because of the impossibility to diagnose and treat this disorder properly. To avoid unpleasant outcomes, the Centers for Disease Control and Prevention and the World Health Organization introduce multiple guidelines and screening tests to check young people for various depressive episodes and behaviors. In this report, a plan of treatment includes primary, secondary, and tertiary interventions, proving that depression management is important at different stages.
References
Beecham, J. (2014). Annual research review: Child and adolescent mental health interventions: A review of progress in economic studies across different disorders. Journal of Child Psychology and Psychiatry, and Allied Disciplines, 55(6), 714-732. Web.
Centers for Disease Control and Prevention. (2018). Anxiety and depression in children. Web.
Gholizadeh, L., Khan, S. A., Vahedi, F., & Davidson, P. M. (2017). Sensitivity and specificity of Urdu version of the PHQ-9 to screen depression in patients with coronary artery disease. Contemporary Nurse, 53(1), 75–81. Web.
Mental Health America. (2017). 2017 state of mental health in America – Youth data. Web.
Mullen, S. (2018). Major depressive disorder in children and adolescents. The Mental Health Clinician, 8(5), 275-283. Web.
National Institute of Mental Health. (2017). Major depression. Web.
Perou, R., Bitsko, R. H., Blumberg, S. J., Pastor, P., Ghandour, R. M., Gfroerer, J. C., … Huang, L. N. (2013). Mental health surveillance among children – the United States, 2005-2011. Morbidity and Mortality Weekly Report, 62(2), 1-35. Web.
Polanczyk, G. V., Salum, G. A., Sugaya, L. S., Caye, A., & Rohde, L. A. (2015). Annual Research review: A meta-analysis of the worldwide prevalence of mental disorders in children and adolescents. Journal of Child Psychology and Psychiatry, 56(3), 345–365. Web.
U.S. Department of Health & Human Services. (2018). Florida adolescent mental health facts. Web.
World Health Organization. (2018). Depression. Web.